. 2020 Oct;16(10):1807-1822.
doi: 10.1080/15548627.2019.1704117. Epub 2019 Dec 29.

TGFB-INHB/activin signaling regulates age-dependent autophagy and cardiac health through inhibition of MTORC2

Affiliations

TGFB-INHB/activin signaling regulates age-dependent autophagy and cardiac health through inhibition of MTORC2

Kai Chang et al. Autophagy. 2020 Oct.

Abstract

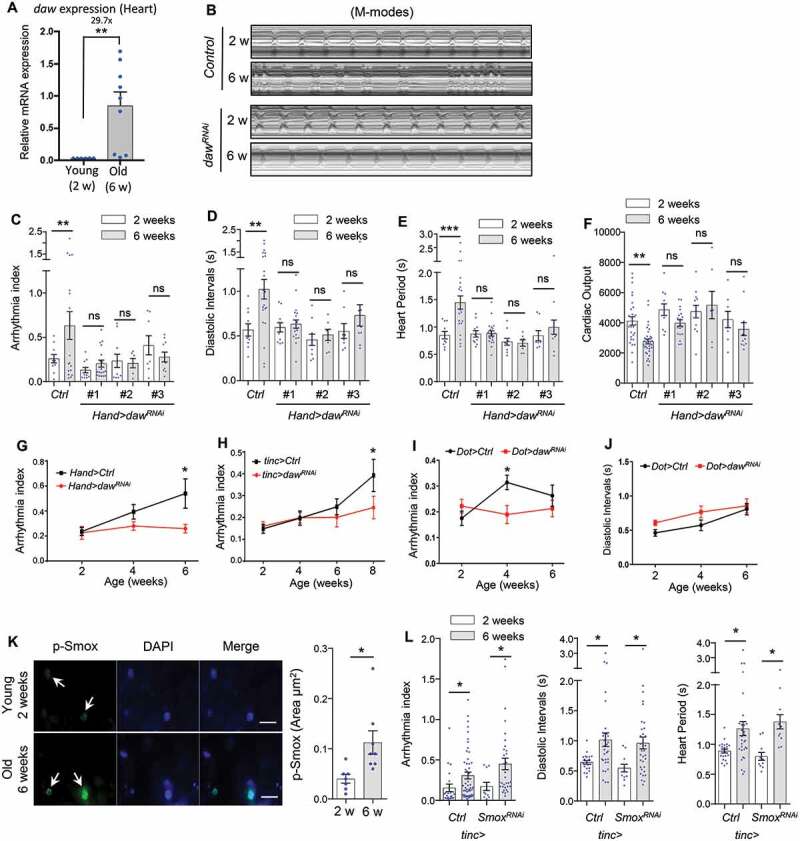
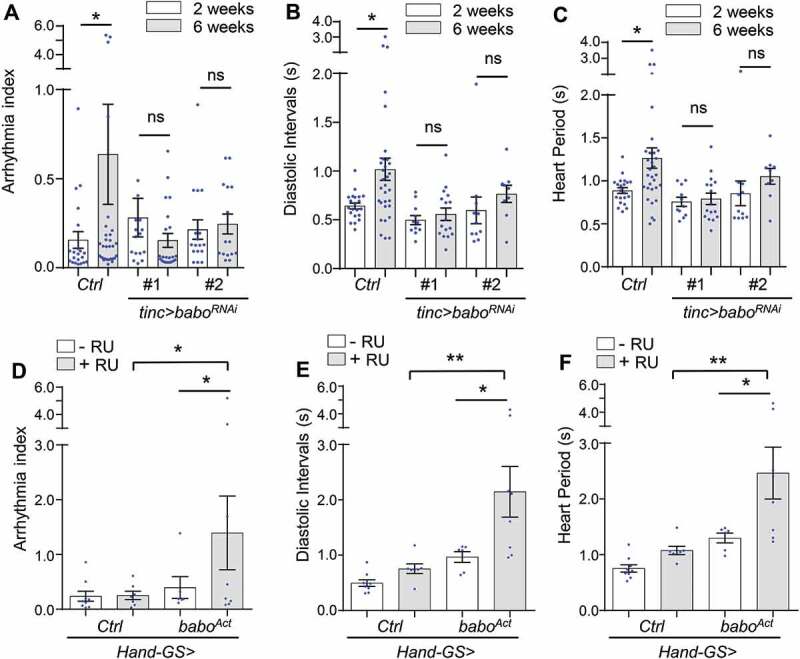
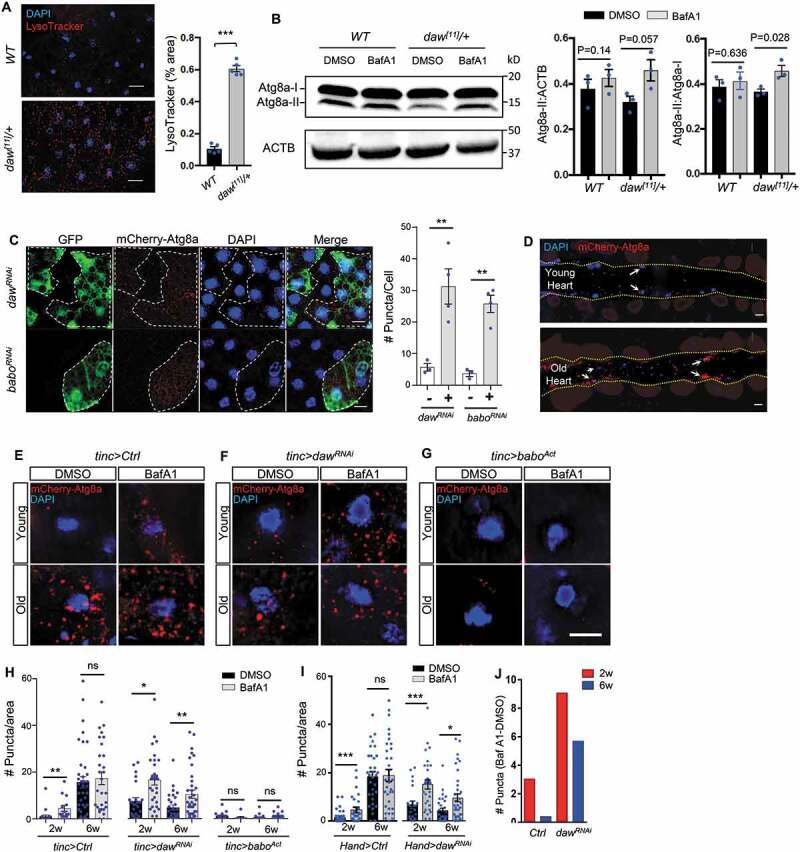
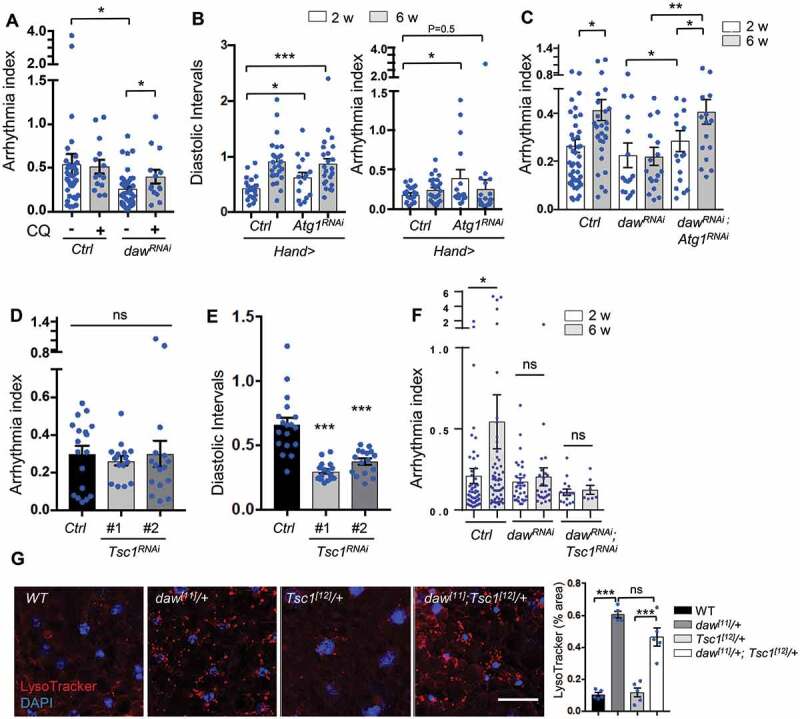
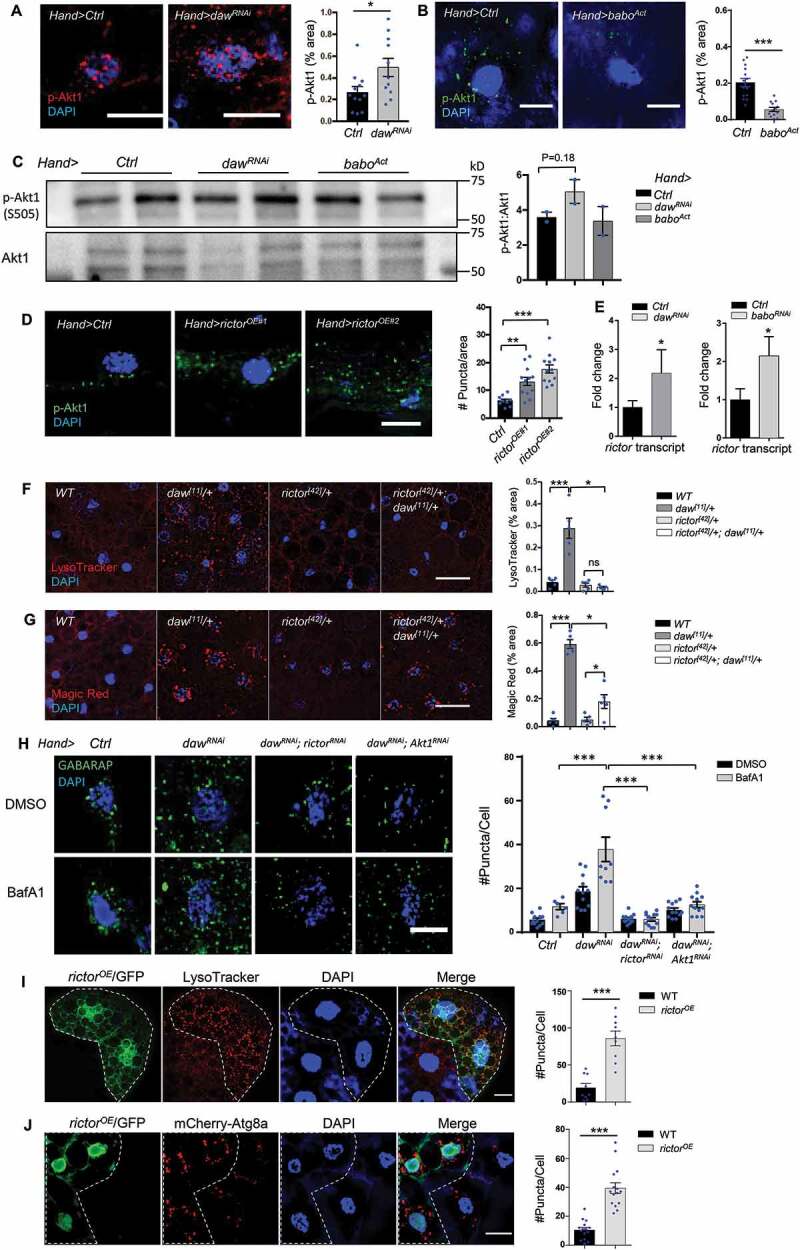
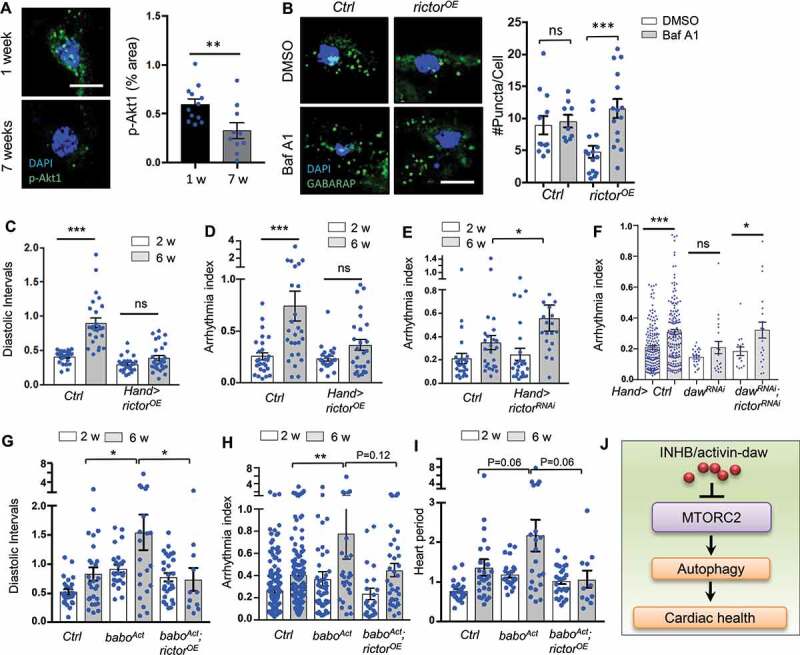
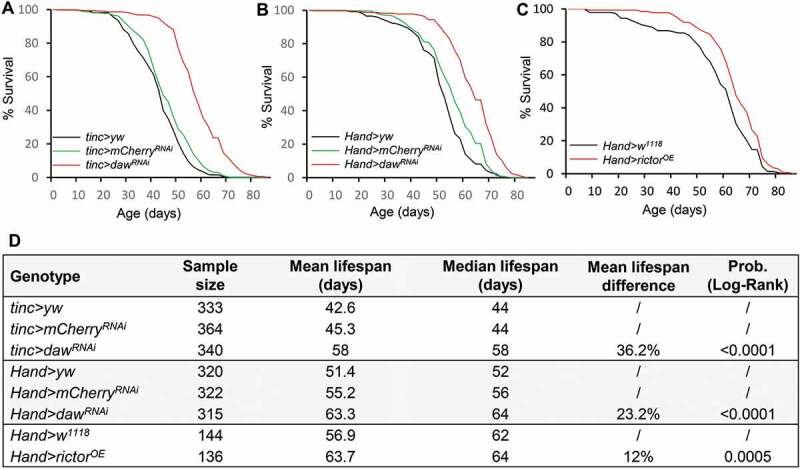
Age-related impairment of macroautophagy/autophagy and loss of cardiac tissue homeostasis contribute significantly to cardiovascular diseases later in life. MTOR (mechanistic target of rapamycin kinase) signaling is the most well-known regulator of autophagy, cellular homeostasis, and longevity. The MTOR signaling consists of two structurally and functionally distinct multiprotein complexes, MTORC1 and MTORC2. While MTORC1 is well characterized but the role of MTORC2 in aging and autophagy remains poorly understood. Here we identified TGFB-INHB/activin signaling as a novel upstream regulator of MTORC2 to control autophagy and cardiac health during aging. Using Drosophila heart as a model system, we show that cardiac-specific knockdown of TGFB-INHB/activin-like protein daw induces autophagy and alleviates age-related heart dysfunction, including cardiac arrhythmias and bradycardia. Interestingly, the downregulation of daw activates TORC2 signaling to regulate cardiac autophagy. Activation of TORC2 alone through overexpressing its subunit protein rictor promotes autophagic flux and preserves cardiac function with aging. In contrast, activation of TORC1 does not block autophagy induction in daw knockdown flies. Lastly, either daw knockdown or rictor overexpression in fly hearts prolongs lifespan, suggesting that manipulation of these pathways in the heart has systemic effects on longevity control. Thus, our studies discover the TGFB-INHB/activin-mediated inhibition of TORC2 as a novel mechanism for age-dependent decreases in autophagic activity and cardiac health. Abbreviations: AI: arrhythmia index; BafA1: bafilomycin A1; BMP: bone morphogenetic protein; CQ: chloroquine; CVD: cardiovascular diseases; DI: diastolic interval; ER: endoplasmic reticulum; HP: heart period; HR: heart rate; MTOR: mechanistic target of rapamycin kinase; NGS: normal goat serum; PBST: PBS with 0.1% Triton X-100; PDPK1: 3-phosphoinositide dependent protein kinase 1; RICTOR: RPTOR independent companion of MTOR complex 2; ROI: region of interest; ROUT: robust regression and outlier removal; ROS: reactive oxygen species; R-SMAD: receptor-activated SMAD; SI: systolic interval; SOHA: semi-automatic optical heartbeat analysis; TGFB: transformation growth factor beta; TSC1: TSC complex subunit 1.

Keywords: Atg8a; INHB/activin ligand; TOR complex 2; autophagic flux; dawdle; semi-automatic optical heartbeat analysis (SOHA).


Conflict of interest statement

No potential conflict of interest was reported by the authors.

Figures

Figure 1.
Figure 1.
Heart-specific knockdown of daw slows cardiac aging. (A) QRT-PCR analysis of daw expression in young and old fly hearts. N = 3. Student t-test (** p < 0.01). (B) Representative M-mode traces (8 s) showing age-dependent movement of heart wall in control and heart-specific daw knockdown flies (Hand-gal4> UAS-dawRNAi). (C-F) Age-related changes in arrhythmia index, diastolic intervals, heart period, and cardiac output in control (Ctrl) and cardiac-specific daw knockdown flies (dawRNAi). Flies were cultured at 40% relative humidity. Hand-gal4 driver was used to knockdown gene expression specifically in cardiac tissues (cardiomyocytes and pericardial cells). Results from three independent UAS-dawRNAi lines are shown (RNAi #1: BDSC, 34974, RNAi #2: Vienna Drosophila Resource Center, 105309, RNAi #3: BDSC, 50911). N = 7 ~ 20. Two-way ANOVA followed by Tukey multiple comparisons test (* p < 0.05, ** p < 0.01, *** p < 0.001, ns = not significant). The interaction between genotype and age is statistically significant for heart period (p = 0.0041) and diastolic interval (p = 0.0243). (G-I) Age-dependent changes in cardiac arrhythmia between control and daw knockdown using various tissue drivers, Hand-gal4 (cardiomyocytes and pericardial cells), tinc-gal4 (cardiomyocytes), and Dot-gal4 (pericardial cells). N = 25 ~ 31. Student t-test (* p < 0.05, ** p < 0.01, *** p < 0.001). (J) Age-dependent changes in diastolic intervals between control and daw knockdown in pericardial cells (Dot-gal4). N = 13 ~ 26. Student t-test (* p < 0.05, ** p < 0.01, *** p < 0.001). (K) Immunostaining of p-Smox in fly hearts at young (2 weeks) and old ages (6 weeks). Arrows indicate cardiomyocyte nuclei and positive p-Smox staining. Scale bar: 20 μm. Quantification shown on the right. N = 8. Student t-test (* p < 0.05). Data are represented as mean ± SEM in all figures. (L) Age-dependent changes in arrhythmia index, diastolic intervals, heart period between control and Smox knockdown (tinc-gal4). N = 11 ~ 31. Student t-test (* p < 0.05).
Figure 2.
Figure 2.
Cardiomyocyte-specific knockdown of INHB/activin receptor babo delays cardiac aging. (A-C) Age-dependent changes in cardiac arrhythmia, diastolic intervals, and heart period in control (Ctrl) and cardiomyocyte-specific babo knockdown flies (babo RNAi). Flies were cultured at 40% relative humidity. tinc-gal4 driver was used. Results from two independent UAS-baboRNAi lines are shown (RNAi #1: BDSC, 25933, RNAi #2: BDSC, 40866). N = 15 ~ 30. One-way ANOVA (*** p < 0.001, ** p < 0.01, * p < 0.05, ns = not significant). (D-F) Changes in cardiac arrhythmia, diastolic intervals, and heart period in fly hearts expressing constitutively activated babo (baboAct). GeneSwitch heart driver Hand-GS-gal4 was used to induce adult-onset babo activation. RU: RU486 (Mifepristone). Flies were cultured at 40% relative humidity. N = 6 ~ 9. One-way ANOVA (*** p < 0.001, ** p < 0.01, * p < 0.05, ns = not significant).
Figure 3.
Figure 3.
Daw negatively regulates autophagy in fly hearts. (A) Representative images of LysoTracker staining of young adult fat body between wild-type (WT) and heterozygous daw[11]/+ mutants. Scale bar: 20 μm. Quantification shown on the right. N = 5. Student t-test (*** p < 0.001). (B) Western blot analysis on Atg8a lipidation between WT and daw[11]/+ mutants. GABARAP antibodies were used to detect Atg8a. The lower band represents lipidated Atg8a (Atg8a-II), and the upper band represents non-lipidated Atg8a (Atg8a-I). Abdominal fly carcass is incubated with 5 μM of BafA1 prior to western blots. ACTB (actin beta) is used as the loading control. Quantification of band intensity shown on the right. N = 3. Student t-test (*** p < 0.001). (C) Representative images of mosaic analysis on autophagosome staining in larval fat body. Fat body clones were generated by crossing dawRNAi and baboRNAi lines into a FLPout line carrying mCherry-Atg8a reporter (hs-flp; endogenous P-3xmCherry-Atg8a, UAS-GFP/Cyo; Act>CD2> Gal4,UAS-Dcr-2). RNAi Clones are GFP-positive cells (dashed lines). Scale bar: 20 μm. Quantification of autophagosome puncta shown on the right. N = 5. Student t-test (** p < 0.01). (D) Representative images of fly hearts expressing autophagosome reporter mCherry-Atg8a at both young and old ages. Arrows indicate cardiomyocyte nuclei and surrounding autophagosomes. Abdominal segments A2-A3 are shown. Heart tube is located between two yellow dashed lines. (E-G) Representative images of mCherry-Atg8a reporter surrounding cardiomyocyte nuclei in control, dawRNAi, and baboAct flies with or without BafA1 treatment. Semi-intact hearts were incubated with 100 nM of bafilomycin A1 (BafA1) for 2 h prior to immunostaining. Scale bar: 10 μm. (H) Quantification of age-dependent changes in autophagic flux in control, dawRNAi, and baboAct fly hearts. tinc-gal4 was used to drive the expression of mCherry-Atg8a reporter and gene knockdown. N = 5 ~ 7. One-way ANOVA (*** p < 0.001, ** p < 0.01, * p < 0.05, ns = not significant). (I) Quantification of age-dependent changes in autophagic flux in control and dawRNAi fly hearts. Hand -gal4 was used to drive the expression of mCherry-Atg8a reporter and daw knockdown. N = 5 ~ 7. One-way ANOVA (*** p < 0.001, ** p < 0.01, * p < 0.05, ns = not significant). (J) Quantification of BafA1-induced mCherry-Atg8a-positive puncta between control and dawRNAi. The data represent the differences in the number of puncta between BafA1 and DMSO treatments.
Figure 4.
Figure 4.
Inhibition of autophagy, but not activation of TORC1, blocks daw knockdown-mediated cardioprotection. (A) Cardiac arrhythmia of chloroquine-treated (20 mM, 24 h) 6-week-old control and daw knockdown flies (Hand-gal4 used). N = 14 ~ 38. One-way ANOVA (*** p < 0.001, ** p < 0.01, * p < 0.05, ns = not significant). (B) Cardiac diastolic intervals and arrhythmia in heart-specific knockdown of Atg1 at young and old ages (Hand-gal4 used). N = 16 ~ 19. One-way ANOVA (*** p < 0.001, * p < 0.05). (C) Age-dependent changes in cardiac arrhythmia in control, dawRNAi, and dawRNAi; Atg1RNAi flies (tinc-gal4 used). N = 16 ~ 35. One-way ANOVA (*** p < 0.001, ** p < 0.01, * p < 0.05, ns = not significant). (D-E) Cardiac arrhythmia and diastolic intervals of Tsc1 knockdown flies (tinc-gal4 used). Two independent Tsc1 RNAi lines were used (RNAi-1: BDSC, 52931, RNAi-2: BDSC, 54034). N = 16 ~ 18. One-way ANOVA (*** p < 0.001, ** p < 0.01, * p < 0.05, ns = not significant). (F) Age-dependent changes in cardiac arrhythmia in control, dawRNAi, and dawRNAi; Tsc1RNAi flies (tinc-gal4 used). N = 7 ~ 30. One-way ANOVA (*** p < 0.001, ** p < 0.01, * p < 0.05, ns = not significant). (G) Representative images of LysoTracker staining in adult fat body of WT, daw[11]/+, Tsc1[12]/+ and double mutants daw[11]/+; Tsc1[12]/+. Scale bar: 10 μm. Quantification shown on the right. N = 5. One-way ANOVA (*** p < 0.001, ** p < 0.01, * p < 0.05, ns = not significant).
Figure 5.
Figure 5.
Daw genetically interacts with TORC2 (rictor) to control autophagy. (A) Representative images of p-Akt1 staining in cardiomyocytes of control and daw knockdown flies (Hand-gal4). Scale bar: 10 μm. Quantification shown on the right. N = 5. Student t-test (* p < 0.05). (B) Representative images of p-Akt1 staining in cardiomyocytes of control and babo-activated flies (Hand-gal4). Scale bar: 10 μm. Quantification shown on the right. N = 5. Student t-test (*** p < 0.001). (C) Western blot analysis on Akt1 phosphorylation of the hearts dissected from control, daw knockdown and babo-activated flies (Hand-gal4). Quantification of band intensity shown on the right. N = 3. Student t-test. (D) Representative images of p-Akt1 staining in cardiomyocytes of control and rictor overexpression (Hand-gal4). Two independent rictor overexpression used (#1: UAS-rictor, #2: UAS-HA-rictor [72]). Scale bar: 10 μm. Quantification shown on the right. N = 5. One-way ANOVA (*** p < 0.001, ** p < 0.01, * p < 0.05, ns = not significant). (E) QRT-PCR analysis of rictor expression in fly hearts with daw and babo knockdown (Hand-gal4). N = 3. Student t-test (* p < 0.05). (F) Representative images of LysoTracker staining in adult fat body of WT, daw[11]/+, rictor[42]/+ and double mutants rictor[42]/+; daw[11]/+. Scale bar: 20 μm. Quantification shown on the right. N = 5. One-way ANOVA (*** p < 0.001, ** p < 0.01, * p < 0.05, ns = not significant). (G) Representative images of Magic Red staining in adult fat body of WT, daw[11]/+, rictor[42]/+ and double mutants rictor[42]/+; daw[11]/+. Scale bar: 20 μm. Quantification shown on the right. N = 5. One-way ANOVA (*** p < 0.001, ** p < 0.01, * p < 0.05, ns = not significant). (H) Representative images of GABARAP immunostaining in cardiomyocytes of BafA1-treated control, dawRNAi alone, dawRNAi; rictorRNAi, and dawRNAi; Akt1RNAi flies. Scale bar: 20 μm. Quantification shown on the right. N = 15. Student t-test (*** p < 0.001). (I) Representative images of mosaic analysis of LysoTracker staining in larval fat body. Fat body clones were generated by crossing rictor overexpression lines into a FLPout line (yw, hs-flp, UAS-CD8::GFP; Act>y+>Gal4,UAS-GFP.nls;UAS-Dcr-2). Clones with rictor overexpression are GFP-positive cells (dashed lines). Scale bar: 20 μm. (J) Representative images of mosaic analysis of autophagosome staining in larval fat body. Fat body clones were generated by crossing rictor overexpression lines into a FLPout line carrying mCherry-Atg8a reporter (hs-flp; endogenous P-3x mCherry-Atg8a, UAS-GFP/Cyo; Act>CD2> Gal4,UAS-Dcr-2). Clones with rictor overexpression are GFP-positive cells (dashed lines). Scale bar: 20 μm.
Figure 6.
Figure 6.
Heart-specific overexpression of rictor preserved cardiac function during aging. (A) Representative images of p-Akt1 staining in young and old cardiomyocytes of wild-type flies. Scale bar: 10 μm. Quantification shown on the right. N = 12. Student t-test (** p < 0.01). (B) Representative images of autophagic flux in control and rictor overexpressing cardiomyocytes at old ages (Hand-gal4). Scale bar: 10 μm. Quantification shown on the right. N = 15. One-way ANOVA (*** p < 0.001, ** p < 0.01, * p < 0.05, ns = not significant). (C-D) Diastolic intervals and arrhythmia index in flies with heart-specific overexpression of rictor (Hand-gal4). N = 19 ~ 26. One-way ANOVA (*** p < 0.001, ** p < 0.01, * p < 0.05, ns = not significant). (E) Cardiac arrhythmia index in flies with heart-specific knockdown of rictor. N = 24. One-way ANOVA (*** p < 0.001, ** p < 0.01, * p < 0.05, ns = not significant). (F) Cardiac arrhythmia index in flies with heart-specific knockdown of daw alone or daw; rictor double knockdown. N = 15 ~ 30. Student t-test (*** p < 0.001, * p < 0.05, ns = not significant). (G-I) Diastolic intervals, arrhythmia index, and heart period in flies with heart-specific expression of baboAct, or baboAct; rictorOE (Hand-gal4). N = 11 ~ 27. One-way ANOVA (*** p < 0.001, ** p < 0.01, * p < 0.05, ns = not significant). (J) Proposed model: INHB/activin-mediated inhibition of MTORC2 as a novel mechanism for age-dependent regulation of autophagy and cardiac health.
Figure 7.
Figure 7.
Cardiac-specific knockdown of daw and overexpression of rictor prolong lifespan. (A-B) Survival analysis of cardiac-specific (tinc-gal4 and Hand-gal4) knockdown of daw. Two control lines used (yw and mCherry RNAi) were performed. Log-Rank test, p < 0.0001. (C) Survival analysis of heart-specific (Hand-gal4) overexpression of rictor. Log-Rank test, p = 0.0005. (D) Lifespan table to show sample size, mean and median lifespan of the survival analysis.

References

    1. Dai DF, Chen T, Johnson SC, et al. Cardiac aging: from molecular mechanisms to significance in human health and disease. Antioxid Redox Signal. 2012;16:1492–1526. - PMC - PubMed
    1. North BJ, Sinclair DA.. The intersection between aging and cardiovascular disease. Circ Res. 2012;110:1097–1108. - PMC - PubMed
    1. Lakatta EG, Levy D.. Arterial and cardiac aging: major shareholders in cardiovascular disease enterprises: part II: the aging heart in health: links to heart disease. Circulation. 2003;107:346–354. - PubMed
    1. Rubinsztein DC, Marino G, Kroemer G. Autophagy and aging. Cell. 2011;146:682–695. - PubMed
    1. Shibutani ST, Yoshimori T. A current perspective of autophagosome biogenesis. Cell Res. 2014;24:58–68. - PMC - PubMed

Publication types

MeSH terms

LinkOut - more resources