. 2019 Dec 30;17(1):108.
doi: 10.1186/s12915-019-0726-5.

Multi-species annotation of transcriptome and chromatin structure in domesticated animals

Affiliations

Multi-species annotation of transcriptome and chromatin structure in domesticated animals

Sylvain Foissac et al. BMC Biol. .

Abstract

Background: Comparative genomics studies are central in identifying the coding and non-coding elements associated with complex traits, and the functional annotation of genomes is a critical step to decipher the genotype-to-phenotype relationships in livestock animals. As part of the Functional Annotation of Animal Genomes (FAANG) action, the FR-AgENCODE project aimed to create reference functional maps of domesticated animals by profiling the landscape of transcription (RNA-seq), chromatin accessibility (ATAC-seq) and conformation (Hi-C) in species representing ruminants (cattle, goat), monogastrics (pig) and birds (chicken), using three target samples related to metabolism (liver) and immunity (CD4+ and CD8+ T cells).

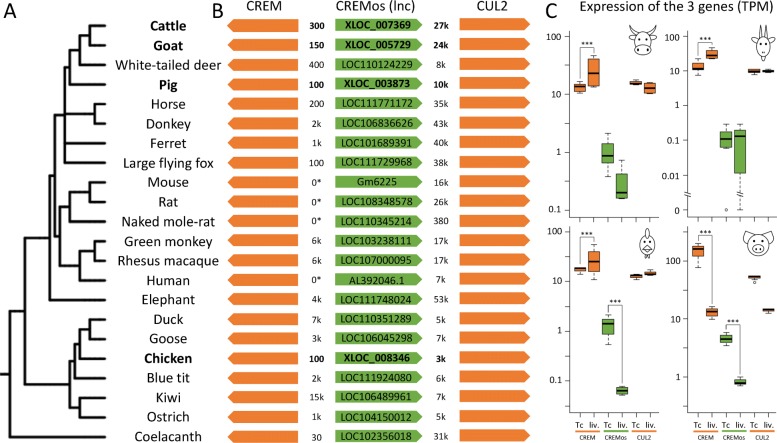
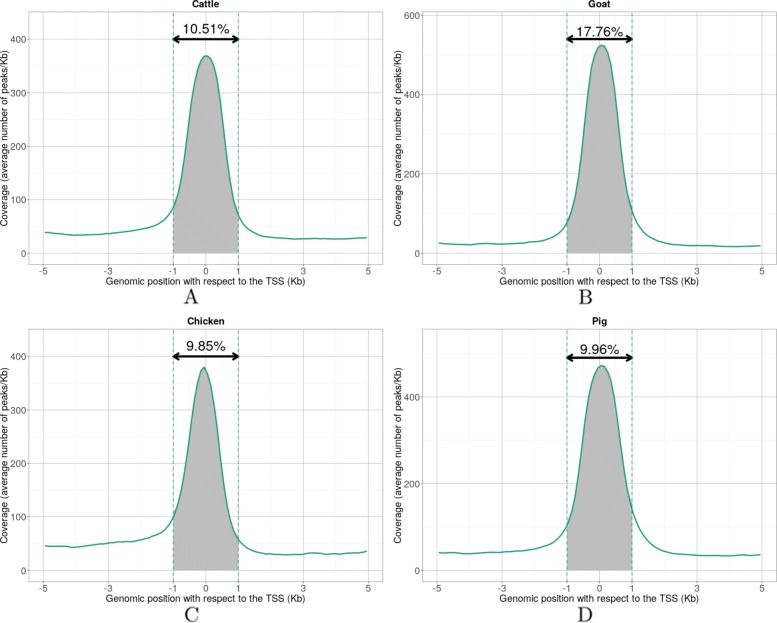
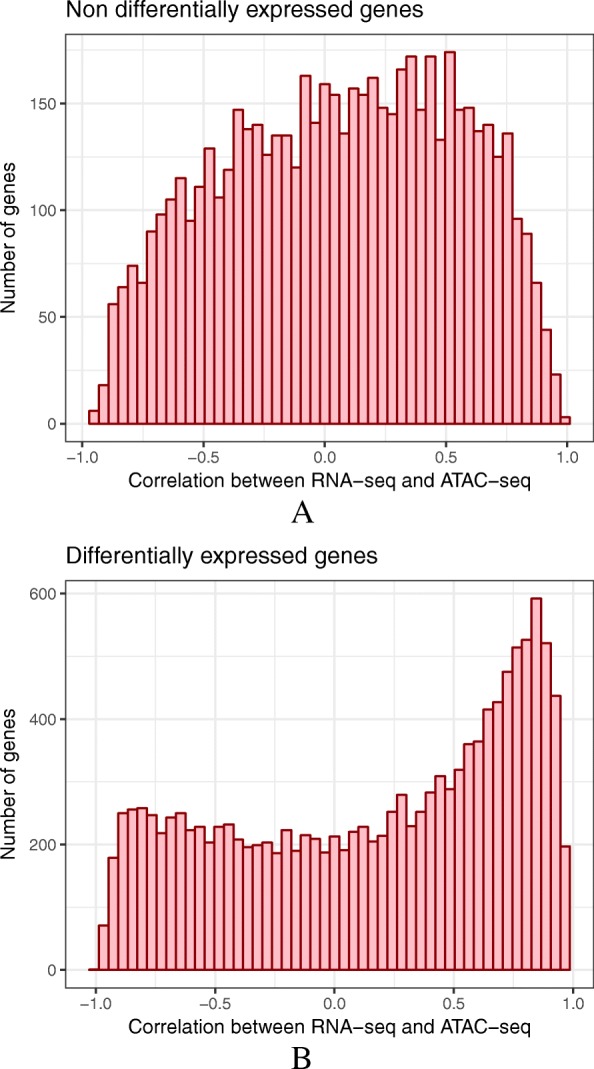
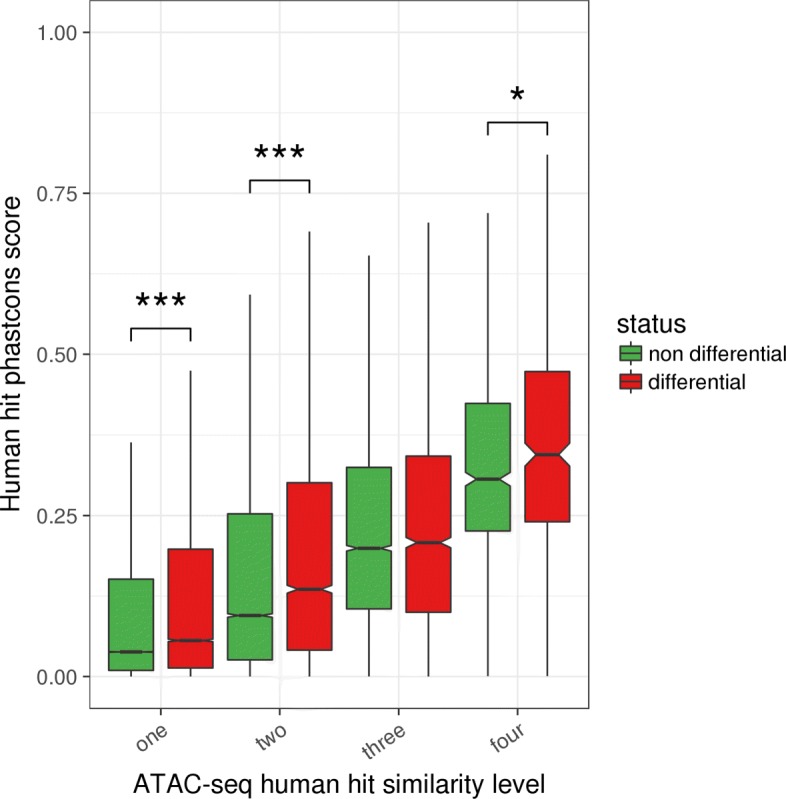
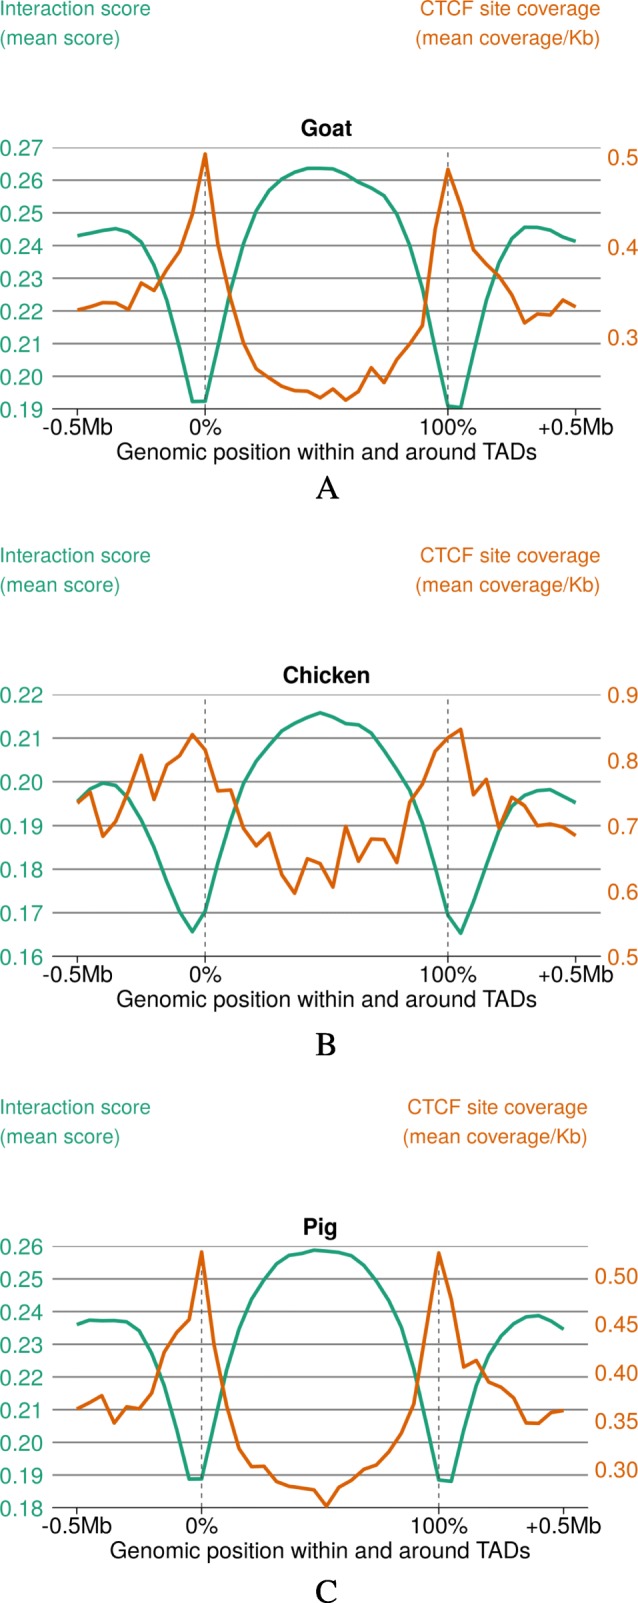
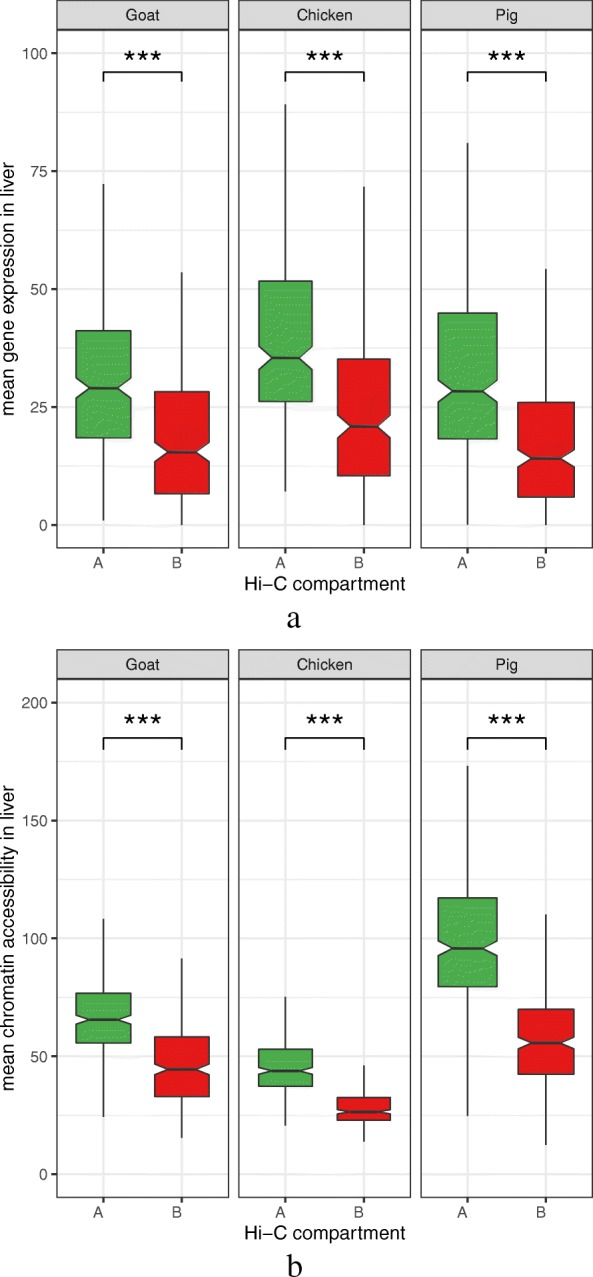
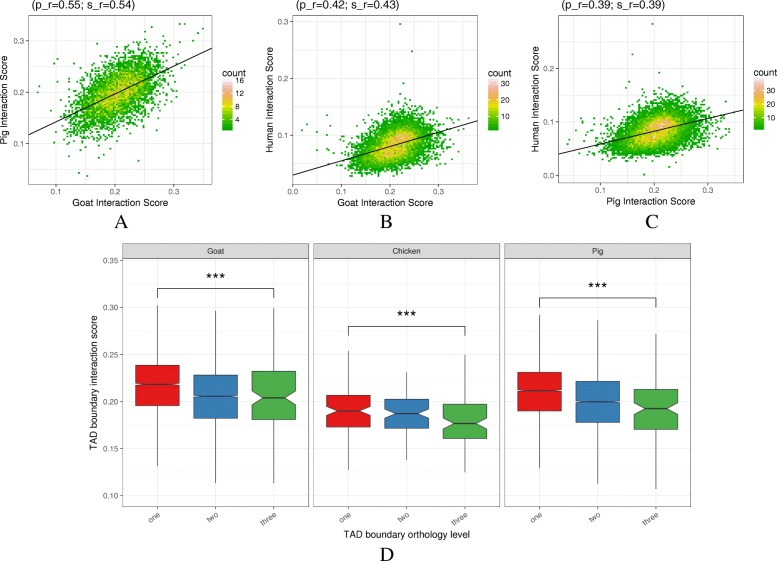
Results: RNA-seq assays considerably extended the available catalog of annotated transcripts and identified differentially expressed genes with unknown function, including new syntenic lncRNAs. ATAC-seq highlighted an enrichment for transcription factor binding sites in differentially accessible regions of the chromatin. Comparative analyses revealed a core set of conserved regulatory regions across species. Topologically associating domains (TADs) and epigenetic A/B compartments annotated from Hi-C data were consistent with RNA-seq and ATAC-seq data. Multi-species comparisons showed that conserved TAD boundaries had stronger insulation properties than species-specific ones and that the genomic distribution of orthologous genes in A/B compartments was significantly conserved across species.

Conclusions: We report the first multi-species and multi-assay genome annotation results obtained by a FAANG project. Beyond the generation of reference annotations and the confirmation of previous findings on model animals, the integrative analysis of data from multiple assays and species sheds a new light on the multi-scale selective pressure shaping genome organization from birds to mammals. Overall, these results emphasize the value of FAANG for research on domesticated animals and reinforces the importance of future meta-analyses of the reference datasets being generated by this community on different species.

Keywords: ATAC-seq; Functional annotation; Hi-C; Livestock; RNA-seq.


Conflict of interest statement

The authors declare that they have no competing interests.

Figures

Fig. 1.
Fig. 1.
Experimental design overview. For each species, samples from liver and T cells of two males and two females were processed by RNA-seq, ATAC-seq, and Hi-C assays. See Additional file 1: Table S1 for a complete list of experiments performed and available datasets
Fig. 2.
Fig. 2.
RNA-seq sample heatmap and hierarchical clustering based on the expression of the 9461 orthologous genes across the four species. Pairwise similarity between samples is computed as the Pearson correlation between the base 10 logarithm of the expression (TPM) of the 9461 orthologous genes. These similarities are plotted as a heatmap, where samples appear both as rows and columns and are labelled by their species and tissue and the sex of the animal. The color of each heatmap cell also reflects the similarity (Pearson correlation) between each sample pair (the lighter, the higher). Hierarchical clustering is performed using one minus the squared Pearson correlation as a distance and the complete linkage aggregation method
Fig. 3.
Fig. 3.
A novel lncRNA conserved across multiple species. Phylogenetic representation based on the NCBI taxonomy of the 22 annotated species from fishes to mammals using iTOL [41]. a, b Three gene syntenic region centered on CREMos lncRNA with NCBI IDs for lncRNAs already annotated in reference databases and distance between entities in nucleotides. The cases where CREM and CREMos genes are overlapping are indicated by the “0*” distance. c Expression of the 3 genes in cattle, goat, chicken and pig: CREMos is generally less expressed in liver than in T cells (in cattle, chicken and pig) whereas CREM is generally more expressed in liver than in T cells (in cattle, chicken and goat)
Fig. 4.
Fig. 4.
Density of ATAC-seq peaks around Transcription Start Sites (TSS) for cattle (a), goat (b), chicken (c), and pig (d). Mean coverage values of ATAC-seq peaks (y-axis) were computed genome-wide relatively to TSS positions (x-axis). The proportion of ATAC-seq peaks within the [−1;+1]Kb interval is represented by the shaded area between the dotted lines. The corresponding percentage is indicated above the double arrow, indicating that most of the ATAC-seq signal is distal to TSSs
Fig. 5.
Fig. 5.
Correlation between gene expression and promoter accessibility in pig. For each expressed FR-AgENCODE gene with an ATAC-seq peak in the promoter region, the Pearson correlation was computed between the base 10 logarithm of the RNA-seq gene expression (TMM) and the base 10 logarithm of the ATAC-seq chromatin accessibility (normalized by csaw). The distribution is represented for genes with no significant differential expression between liver and T cells (a, top) and for differentially expressed genes (b, bottom). The distribution obtained for differentially expressed genes showed an accumulation of both positive and negative correlation values, suggesting a mixture of regulatory mechanisms
Fig. 6.
Fig. 6.
Relationship between chromatin accessibility conservation and differential accessibility Phastcons scores of ATAC-seq human hits were plotted after dividing the human hits according to both their similarity level (between 1 and 4, x-axis) and their differential accessibility (DA) status (DA in at least one species or DA in none of the 4 species, boxplot color). Although the phastcons score obviously increases with the similarity level, it is clear that, for a given similarity level, the phastcons score is higher for DA human hits than for non DA human hits (all similarity levels except 3, p values <0.01 overall, Wilcoxon tests) (number of elements in the boxplots from left to right: 163509, 21578, 16329, 4437, 6231, 6231, 2241, 878, 417)
Fig. 7.
Fig. 7.
CTCF motif density and local interaction score within and around TADs. Local interaction score across any position measured from Hi-C matrices and represented on the y-axis (left). The mean density of predicted CTCF binding sites is also shown on the y-axis (right). Mean interaction score and CTCF density are plotted relative to the positions of Hi-C-derived Topologically Associating Domains. Dotted lines indicate TAD boundaries. Absolute scale is used on the x-axis up to 0.5 Mb on each side of the TADs while relative positions are used inside the domains (from 0 to 100% of the TAD length)
Fig. 8.
Fig. 8.
Gene expression (a) and chromatin accessibility (b) in A and B topological compartments. For the three species with Hi-C-derived A and B compartments, the distribution of the RNA-seq gene expression values (normalized read counts, top panel) and ATAC-seq chromatin accessibility values (normalized read counts, bottom panel) is shown per compartment type. A “active” compartments. B “repressed” compartments. As Hi-C data was only available from liver, only RNA-seq and ATAC-seq values from the same samples were considered. The significant and systematic difference of gene expression and chromatin accessibility values between A and B compartments (p values <2.2×10⁻¹⁶ overall, Wilcoxon tests) confirms a general consistency between RNA-seq, ATAC-seq and Hi-C data across species
Fig. 9.
Fig. 9.
Relationship between chromatin structure conservation and functionality Interaction scores of orthologous TAD boundaries between goat and pig (a), goat and human (b), and pig and human (c). d For each species with Hi-C data, TAD boundaries were divided according to their similarity level (1, 2, and 3, x-axis, and boxplot colours) and their interaction scores were plotted (y-axis). There is a clear decrease of the interactions core with the TAD boundary similarity level, indicating a stronger insulation for more evolutionarily conserved TAD boundaries

References

    1. Siepel A, Bejerano G, Pedersen JS, Hinrichs AS, Hou M, Rosenbloom K, et al. Evolutionarily conserved elements in vertebrate, insect, worm, and yeast genomes. Genome Res. 2005;15:1034–50. doi: 10.1101/gr.3715005. - DOI - PMC - PubMed
    1. Hindorff LA, Sethupathy P, Junkins HA, Ramos EM, Mehta JP, Collins FS, et al. Potential etiologic and functional implications of genome-wide association loci for human diseases and traits. Proc Natl Acad Sci. 2009;106:9362–7. doi: 10.1073/pnas.0903103106. - DOI - PMC - PubMed
    1. Maurano MT, Humbert R, Rynes E, Thurman RE, Haugen E, Wang H, et al. Systematic localization of common disease-associated variation in regulatory DNA. Science. 2012;337:1190–95. doi: 10.1126/science.1222794. - DOI - PMC - PubMed
    1. The ENCODE Project, Consortium An integrated encyclopedia of DNA elements in the human genome. Nature. 2012;489:57–74. doi: 10.1038/nature11247. - DOI - PMC - PubMed
    1. Yue F, Cheng Y, Breschi A, Vierstra J, Wu W, Ryba T, et al. A comparative encyclopedia of DNA elements in the mouse genome. Nature. 2014;515:355–64. doi: 10.1038/nature13992. - DOI - PMC - PubMed

Publication types