. 2019 Nov 6:27:104756.
doi: 10.1016/j.dib.2019.104756. eCollection 2019 Dec.

Data in support of the longitudinal characterization of pulmonary function in children with Mucopolysaccharidoses IVA

Affiliations

Data in support of the longitudinal characterization of pulmonary function in children with Mucopolysaccharidoses IVA

Johnny J Kenth et al. Data Brief. .

Abstract

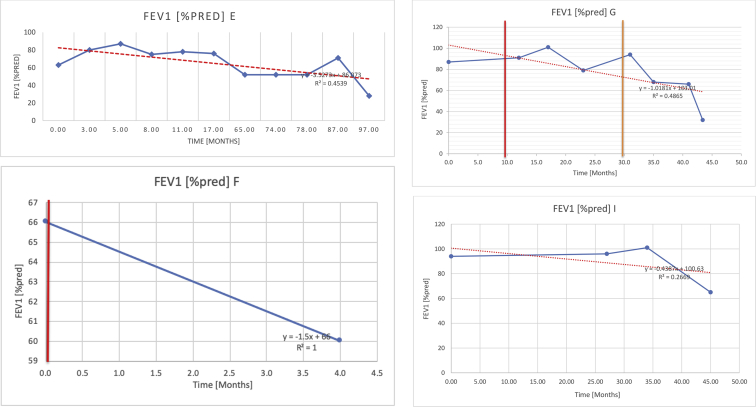
Mucopolysaccharidoses type IVA (Morquio disease) is a rare, autosomal recessive lysosomal storage disease that causes both obstructive and restrictive airway pathology, with respiratory failure being the primary cause of death. This article provides original data on the longitudinal characterization of pulmonary function changes in children with Mucopolysaccharidoses (MPS) IVA by presenting the data and nuanced trends of changes from sequential spirometry and oximetry. The sample size included 16 subjects, 13 had undergone enzyme replacement therapy (ERT), three had not undergone ERT treatment. A total of 180 individual plots are presented for spirometry variables (FEV1, FEV1 [%Pred] FVC, FVC [%Pred] and FEV1/FVC), 6MWT and oximetry variables (median %Spo2, ODI 3%, mean nadir 3%, ODI 4%, mean nadir 4% and min dip SpO2 [%]); over a nine-year period at a single quaternary paediatric metabolic centre. This data has been made public and has utility to clinicians and researchers due to the following: [1,2] by providing the first comprehensive report of detailed changes in pulmonary function in children with MPS IVA, with and without ERT; [1-3] as well as changes in pulmonary function following the institution of non-invasive ventilation (NIV) and adenotonsillectomy. The data presented is related to the research article by Kenth et al. "The Characterization of Pulmonary Function in Patients with Mucopolysaccharidoses IVA: A Longitudinal Analysis".

Keywords: Enzyme replacement therapy; MPS; Morquio syndrome; Mucopolysaccharidosis IVA; Respiratory changes; Sleep-disordered breathing.


Figures

Fig. 1
Fig. 1
Forced expiratory volume in 1 second (FEV1) changes. The above graphs demonstrates each of the individual plots where constructed to ascertain the changes in pulmonary function over time for the given variable. The starting timepoint in the ERT group was shortly after ERT therapy had commenced. Data points are in blue and a line of best fit creating a regression line was created to ascertain the overall trend of whether there was a decline or improvement. For each of the regression curve the intercept and R2 value is sated under the curve. Note also, the solid red and orange bars, that mark when a therapeutic intervention was undertaken. The solid vertical, red line () indicates when adenotonsillectomy was undertaken and the orange line () illustrates when NIV was instituted. There was incomplete data for some individuals, as adenotonsillectomy was undertaken prior to formal diagnosis and thus full lung function tests would not of been undertaken at the time. Subjects A to M were ERT treated and data recorded was post commencing ERT therapy; subjects N and O were not ERT treated and data was recorded after diagnosis.
Fig. 1
Fig. 1
Forced expiratory volume in 1 second (FEV1) changes. The above graphs demonstrates each of the individual plots where constructed to ascertain the changes in pulmonary function over time for the given variable. The starting timepoint in the ERT group was shortly after ERT therapy had commenced. Data points are in blue and a line of best fit creating a regression line was created to ascertain the overall trend of whether there was a decline or improvement. For each of the regression curve the intercept and R2 value is sated under the curve. Note also, the solid red and orange bars, that mark when a therapeutic intervention was undertaken. The solid vertical, red line () indicates when adenotonsillectomy was undertaken and the orange line () illustrates when NIV was instituted. There was incomplete data for some individuals, as adenotonsillectomy was undertaken prior to formal diagnosis and thus full lung function tests would not of been undertaken at the time. Subjects A to M were ERT treated and data recorded was post commencing ERT therapy; subjects N and O were not ERT treated and data was recorded after diagnosis.
Fig. 2
Fig. 2
FEV1 as percentage of predicted, (FEV1 [%pred]).
Fig. 2
Fig. 2
FEV1 as percentage of predicted, (FEV1 [%pred]).
Fig. 2
Fig. 2
FEV1 as percentage of predicted, (FEV1 [%pred]).
Fig. 3
Fig. 3
Forced vital capacity (FVC).
Fig. 3
Fig. 3
Forced vital capacity (FVC).
Fig. 3
Fig. 3
Forced vital capacity (FVC).
Fig. 4
Fig. 4
FVC [% predicted].
Fig. 4
Fig. 4
FVC [% predicted].
Fig. 4
Fig. 4
FVC [% predicted].
Fig. 5
Fig. 5
FEV1/FVC ratio.
Fig. 5
Fig. 5
FEV1/FVC ratio.
Fig. 5
Fig. 5
FEV1/FVC ratio.
Fig. 6
Fig. 6
Six minute walk test (6MWT). The above graphs demonstrates each of the individual plots where constructed to ascertain the changes in pulmonary function over time for the given variable. Data points are in blue and a line of best fit creating a regression line was created to ascertain the overall trend of whether there was a decline or improvement. Note also, the solid red and orange bars, that mark when a therapeutic intervention was undertaken. The solid red line (−) indicates when adenotonsillectomy was undertaken and the orange line (−) illustrates when NIV was instituted.
Fig. 6
Fig. 6
Six minute walk test (6MWT). The above graphs demonstrates each of the individual plots where constructed to ascertain the changes in pulmonary function over time for the given variable. Data points are in blue and a line of best fit creating a regression line was created to ascertain the overall trend of whether there was a decline or improvement. Note also, the solid red and orange bars, that mark when a therapeutic intervention was undertaken. The solid red line (−) indicates when adenotonsillectomy was undertaken and the orange line (−) illustrates when NIV was instituted.
Fig. 7
Fig. 7
Median Spo2%.
Fig. 7
Fig. 7
Median Spo2%.
Fig. 7
Fig. 7
Median Spo2%.
Fig. 8
Fig. 8
Oxygen desaturation index (ODI) 3% from baseline.
Fig. 8
Fig. 8
Oxygen desaturation index (ODI) 3% from baseline.
Fig. 8
Fig. 8
Oxygen desaturation index (ODI) 3% from baseline.
Fig. 9
Fig. 9
Mean nadir 3%.
Fig. 9
Fig. 9
Mean nadir 3%.
Fig. 9
Fig. 9
Mean nadir 3%.
Fig. 10
Fig. 10
Odi 4%.
Fig. 10
Fig. 10
Odi 4%.
Fig. 10
Fig. 10
Odi 4%.
Fig. 11
Fig. 11
Mean nadir 4%.
Fig. 11
Fig. 11
Mean nadir 4%.
Fig. 11
Fig. 11
Mean nadir 4%.
Fig. 12
Fig. 12
Minimum dips in % SpO2.
Fig. 12
Fig. 12
Minimum dips in % SpO2.
Fig. 12
Fig. 12
Minimum dips in % SpO2.

References

    1. Kenth Johnny J., Thompson Gabrielle, Fullwood Catherine, Wilkinson Stuart, Jones Simon, Bruce I.A. The characterisation of pulmonary function in patients with mucopolysaccharidoses IVA: a longitudinal analysis. Mol. Genet. Metab. Rep. 2019;20 - PMC - PubMed
    1. Broomfield A., Kenth J., Bruce I.A., Hl T., Wilkinson S. Respiratory complications of metabolic disease in the paediatric population: a review of presentation, diagnosis and therapeutic options. Paediatr. Respir. Rev. 2019 - PubMed
    1. Jones S., Wynn R. Mucopolysaccharidoses: Clinical features and diagnosis - UpToDate. https://www.uptodate.com/contents/mucopolysaccharidoses-clinical-feature...
    1. Standardization of Spirometry Update. American thoracic society. Am. J. Respir. Crit. Care Med. 1994;152(1995):1107–1136. - PubMed
    1. Pal A.R., Langereis E.J., Saif M.A., Mercer J., Church H.J., Tylee K.L., Wynn R.F., Wijburg F.A., Jones S.A., Bruce I.A., Bigger B.W. Sleep disordered breathing in mucopolysaccharidosis I: a multivariate analysis of patient, therapeutic and metabolic correlators modifying long term clinical outcome. Orphanet J. Rare Dis. 2015;10:42. - PMC - PubMed

LinkOut - more resources