. 2019 Dec 19:2:474.
doi: 10.1038/s42003-019-0721-y. eCollection 2019.

Insights into the κ/ι-carrageenan metabolism pathway of some marine Pseudoalteromonas species

Affiliations

Insights into the κ/ι-carrageenan metabolism pathway of some marine Pseudoalteromonas species

Andrew G Hettle et al. Commun Biol. .

Abstract

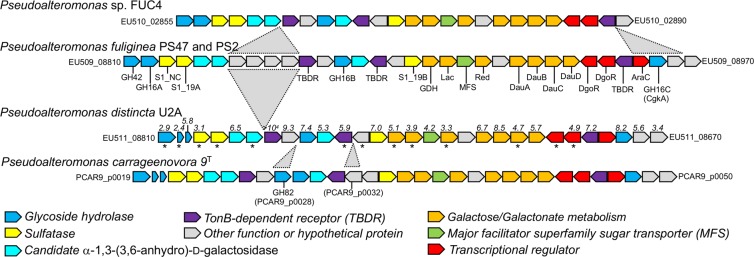
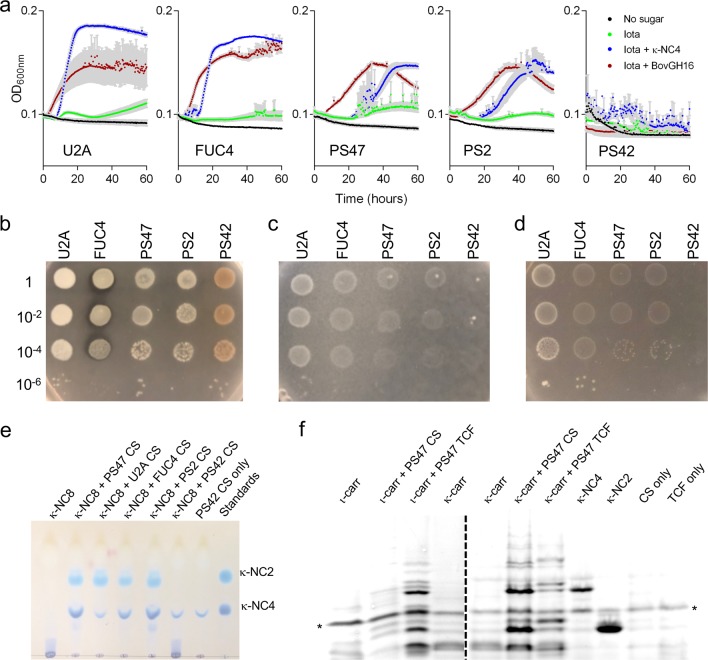
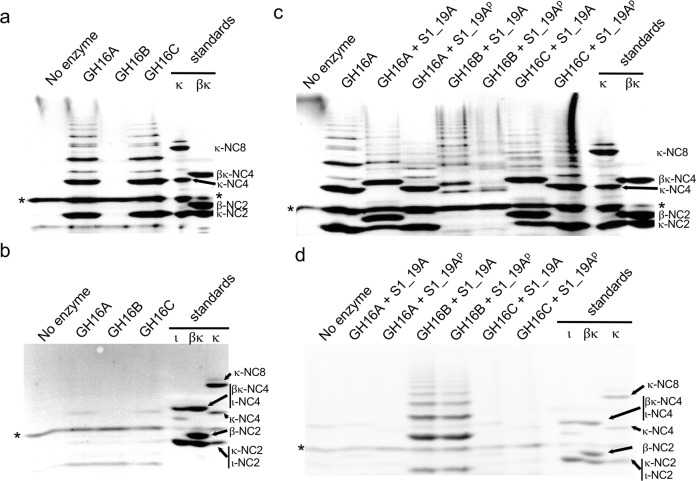
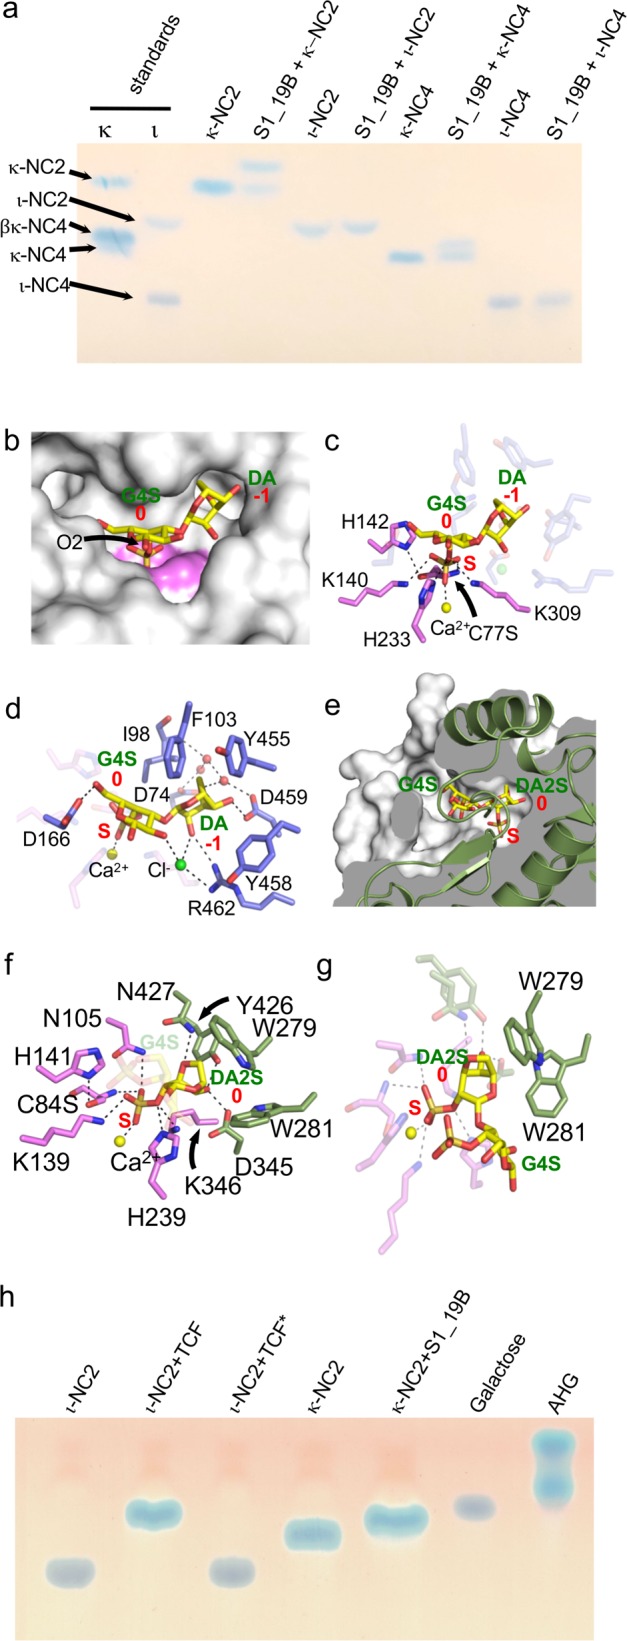
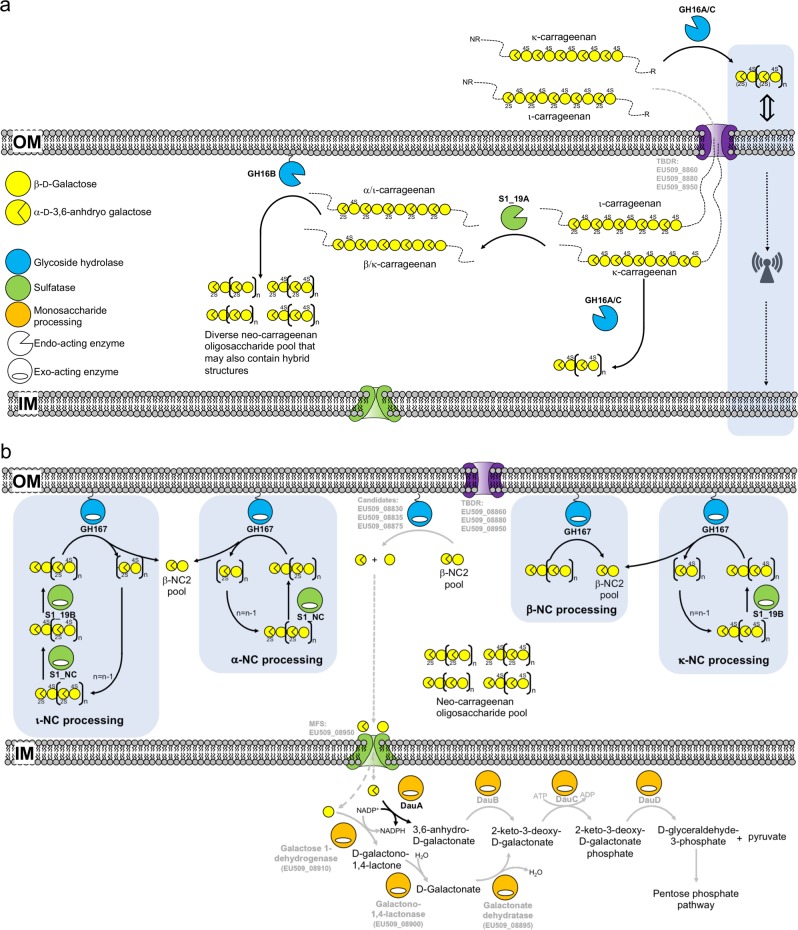
Pseudoalteromonas is a globally distributed marine-associated genus that can be found in a broad range of aquatic environments, including in association with macroalgal surfaces where they may take advantage of these rich sources of polysaccharides. The metabolic systems that confer the ability to metabolize this abundant form of photosynthetically fixed carbon, however, are not yet fully understood. Through genomics, transcriptomics, microbiology, and specific structure-function studies of pathway components we address the capacity of newly isolated marine pseudoalteromonads to metabolize the red algal galactan carrageenan. The results reveal that the κ/ι-carrageenan specific polysaccharide utilization locus (CarPUL) enables isolates possessing this locus the ability to grow on this substrate. Biochemical and structural analysis of the enzymatic components of the CarPUL promoted the development of a detailed model of the κ/ι-carrageenan metabolic pathway deployed by pseudoalteromonads, thus furthering our understanding of how these microbes have adapted to a unique environmental niche.

Keywords: Carbohydrates; Enzymes; Glycobiology; Structural biology; X-ray crystallography.


Conflict of interest statement

Competing interestsThe authors declare no competing interests.

Figures

Fig. 1
Fig. 1. Schematic of the carrageenan PULs in newly isolated Pseudoalteromonas sp. compared with Pseudoalteromonas carrageenovora 9T.
Each gene is represented by an arrow, which are color coded according to putative function. Gray triangles indicate inserted regions. All other genes are otherwise orthologous. Numbers above the genes in the Pseudoalteromonas distincta U2A CarPUL indicate the Differential Expression Log2 Ratio of transcript levels detected when grown on ι-carrageenan vs. galactose as determined by RNA sequencing experiments (values are only shown for genes with |Log2 Ratios| > 1.5 and p-values < 0.05). Asterisks (*) below the genes indicate those with significant transcripts (>10 transcripts per kilobase million) when grown on galactose. Locus tags for the first and last genes are provided. See also Supplementary Table 2 for more details of the gene annotations.
Fig. 2
Fig. 2. Growth and carrageenan degradation properties of Pseudoalteromonas isolates.
a Growth of the Pseudoalteromonas isolates in liquid minimal marine media (MMM) with no carbon source (black), MMM with 0.4% ι-carrageenan (green), MMM with 0.4% ι-carrageenan and 0.04% κ-NC4 (blue), and MMM with 0.4% ι-carrageenan and BovGH16 (red). Gray bars indicate the error from n = 4 independent experiments. bd Growth of the Pseudoalteromonas isolates on MMM solidified with 1% κ-carrageenan. In panels (b) and (d), prior to spotting on the plates, the bacteria were pre-grown in liquid medium comprising MMM, 0.4% ι-carrageenan and 0.04% κ-NC4. In panel (b), the solid medium was also supplemented with 1% galactose. For these plates, the pre-growth media was also supplemented with 0.5% galactose to grow PS42. In panel (c), the bacteria were pre-grown in liquid medium comprising MMM and 0.5% galactose. The numbers to the left of the panels indicates the fold dilution of the pre-culture that was used to spot the solid medium. e Thin layer chromatography (TLC) analysis of κ-NC8 incubated with cell-free culture supernatants (CS) taken from the Pseudoalteromonas isolates after growth on MMM supplemented with 0.4% ι-carrageenan and 0.04% κ-NC4 (medium also contained 0.5% galactose for PS42). f Fluorophore-assisted carbohydrate electrophoresis (FACE) analysis of ι-carrageenan (ι-carr) and κ-carrageenan (κ-carr) incubated with CS or total cell fraction (TCF) from PS47 after growth on MMM supplemented with 0.4% ι-carrageenan and 0.04% κ-NC4. The asterisks (*) indicate the band corresponding to excess ANTS fluorophore.
Fig. 3
Fig. 3. The carrageenan degradation properties of recombinant GH16 enzymes from PS47.
FACE analysis of the products of κ-carrageenan (a) and ι-carrageenan (b) degradation. Panels (c) and (d) show the FACE analysis of κ-carrageenan (c) and ι-carrageenan (d) degradation when the GH16 enzymes are used in conjunction with the S1_19A endo-4S-κ/ι-carrageenan sulfatase. The superscript “p” (p) in the sample label indicates that the carrageenan was pretreated overnight with the sulfatase, followed by heat inactivation of the sulfatase then digestion with the GH16. The asterisks (*) indicates the band corresponding to excess ANTS fluorophore.
Fig. 4
Fig. 4. Activity and structural features of PS47 sulfatases.
a TLC analysis of S1_19B activity. bd Structural analysis of S1_19B with (b) showing the active site pocket of the S1_19B C77S mutant in complex with κ-NC2 as a solvent accessible surface (gray) and the area comprising the S-subsite colored in violet. The bound κ-NC2 is shown as yellow sticks. c The interactions of the sulfate ester of κ-NC2 with the sulfate binding S-subsite. d The specific interactions of κ-NC2 with the active site pocket 0 and −1 subsites. eg Structural analysis of S1_NC with (e) showing the cutaway of S1_NC C84S in complex with ι-NC2, which reveals the tunnel like nature of the active site. S1_NC is shown as a green cartoon and the solvent accessible surface is shown in white. Gray represents the interior of the enzyme and ι-NC2 as shown as yellow sticks. f The interactions of the targeted sulfate ester of ι-NC2 with the sulfate binding S-subsite and the DA2S unit with the residues of the 0 subsite. g The specific interactions of DA2S in the 0 subsite highlighting the tryptophan cradle. In panels (c), (d), (f), and (g) residues specifically comprising the S-subsite are shown as violet sticks and those comprising the additional subsites are shown as blue (S1_19B) or green (S1_NC) sticks. Calcium ions are shown as a yellow sphere, and hydrogen bonds as dashed lines. In panels (b)–(g) sugar residues and subsites are labeled in green and red, respectively. h TLC analysis of ι-NC2 conversion by the total cellular fraction (TCF) from PS47. TCF* indicates heat inactivated TCF. κ-NC2 incubated with S1_19B, which produces β-NC2, is shown as a standard.
Fig. 5
Fig. 5. Activity and structure of β-neocarrabiose releasing exo-β-galactosidases.
a TLC analysis of GH167 and BovGH167 activity. “S” indicates the addition of S1_19B to the reactions. b Cartoon representation of the BovGH167 structure showing the domain organization and secondary structure elements. The N-terminal domain (domain N) is shown in gray, the (α/β)8 domain (domain A) in purple, the mixed α/β-fold domain (domain B) in yellow, and the C-terminal β-sandwich domain (domain C) in blue. c Overlap of the BovGH167 active site (blue) with BbgII from Bifidobacterium bifidum S17 in complex with galactose in the −1 subsite (gray; PDB ID 4UCF). The catalytic acid/base (A/B) and nucleophile (N) for BbgII are indicated.
Fig. 6
Fig. 6. Structure of DauA.
a The dimer of DauA in complex with NADP+ shown with one monomer in cartoon representation and the second monomer as its solvent accessible surface. α-helixes are colored purple, β-sheets colored yellow, and loops are colored gray. The NADP+ to each monomer is shown in stick representation with its corresponding electron density shown as a 2Fo−Fc map contoured at 1σ (blue mesh). b Close-up of the active site where 3,6-anhydro-d-galactose binding occurs. Catalytic residues are shown as magenta sticks and residues likely involved in 3,6-anhydro-d-galactose binding as blue sticks.
Fig. 7
Fig. 7. Model of carrageenan metabolism by Pseudoalteromonas fuliginea PS47 and other Pseudoalteromonas sp. that possess a CarPUL.
a Model of carrageenan depolymerization steps. A signal for the induction of carrageenan metabolism is provided by κ-carrageenan or a κ-carrageenan oligosaccharide through an unknown mechanism (indicated by the blue shaded area on the right of the panel), though this likely involves the TonB-dependent receptor complex. Polymeric carrageenan is imported and subsequently depolymerized to a heterogeneous pool of neocarrageenan oligosaccharides. b Model of sequential carrageenan oligosaccharide desulfation and depolymerization steps. Steps indicated by gray arrows and gray text are those that are not presently supported by experimental evidence.

References

    1. Field CB, Behrenfeld MJ, Randerson JT, Falkowski P. Primary production of the biosphere: integrating terrestrial and oceanic components. Science. 1998;281:237–240. doi: 10.1126/science.281.5374.237. - DOI - PubMed
    1. Smith SV. Marine macrophytes as a global carbon sink. Science. 1981;211:838–840. doi: 10.1126/science.211.4484.838. - DOI - PubMed
    1. Schaumann K, Weide G. Efficiency of uronic acid uptake in marine alginate-degrading fungi. Helgol.änder Meeresuntersuchungen. 1995;49:159–167. doi: 10.1007/BF02368346. - DOI
    1. Genilloud O, Peláez F, González I, Díez MT. Diversity of actinomycetes and fungi on seaweeds from the Iberian coasts. Microbiologia. 1994;10:413–422. - PubMed
    1. Uchida M, Murata M. Isolation of a lactic acid bacterium and yeast consortium from a fermented material of Ulva spp. (Chlorophyta) J. Appl. Microbiol. 2004;97:1297–1310. doi: 10.1111/j.1365-2672.2004.02425.x. - DOI - PubMed

Publication types