. 2019;1(1):fcz017.
doi: 10.1093/braincomms/fcz017. Epub 2019 Sep 16.

Longitudinal assessments highlight long-term behavioural recovery in disorders of consciousness

Affiliations

Longitudinal assessments highlight long-term behavioural recovery in disorders of consciousness

Corinne A Bareham et al. Brain Commun. 2019.

Abstract

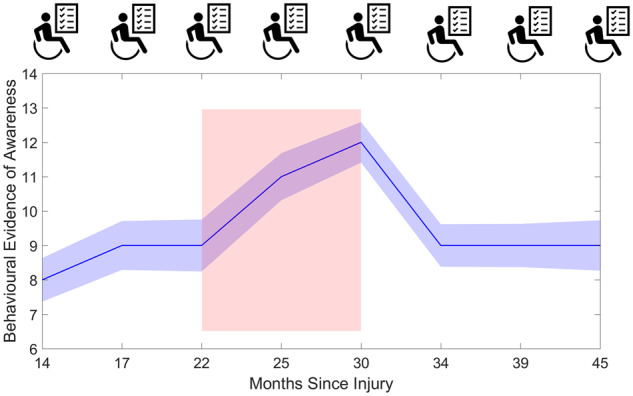
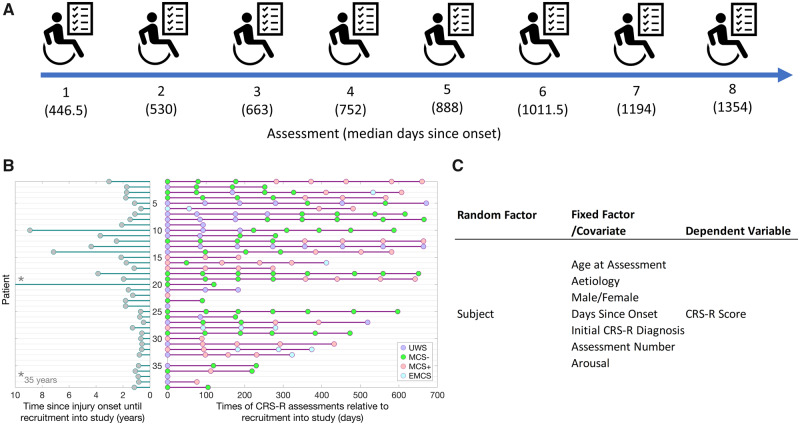
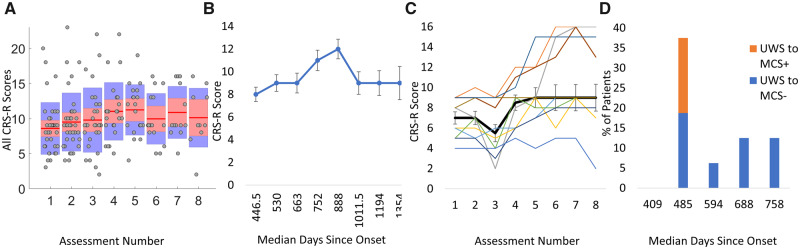
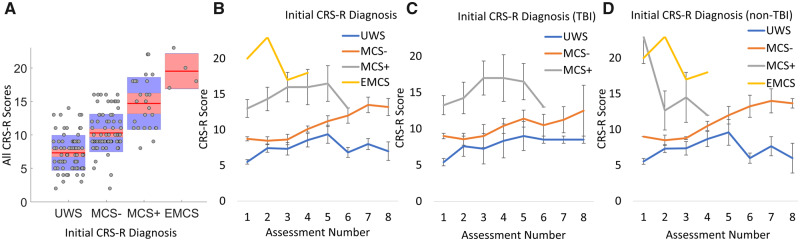
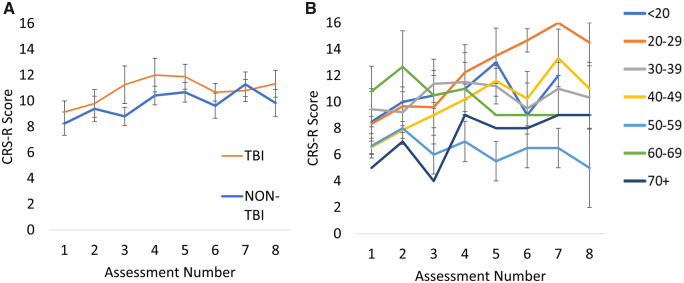
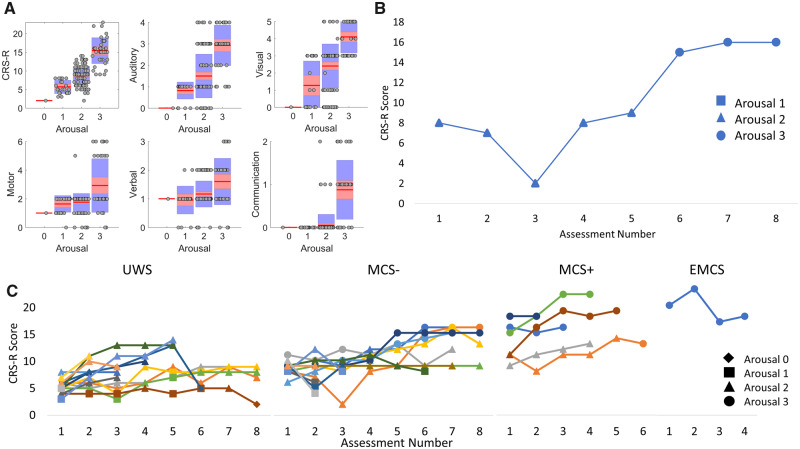
Accurate diagnosis and prognosis of disorders of consciousness is complicated by the variability amongst patients' trajectories. However, the majority of research and scientific knowledge in this field is based on cross-sectional studies. The translational gap in applying this knowledge to inform clinical management can only be bridged by research that systematically examines follow-up. In this study, we present findings from a novel longitudinal study of the long-term recovery trajectory of 39 patients, repeatedly assessed using the Coma Recovery Scale-Revised once every 3 months for 2 years, generating 185 assessments. Despite the expected inter-patient variability, there was a statistically significant improvement in behaviour over time. Further, improvements began approximately 22 months after injury. Individual variation in the trajectory of recovery was influenced by initial diagnosis. Patients with an initial diagnosis of unresponsive wakefulness state, who progressed to the minimally conscious state, did so at a median of 485 days following onset-later than 12-month period after which current guidelines propose permanence. Although current guidelines are based on the expectation that patients with traumatic brain injury show potential for recovery over longer periods than those with non-traumatic injury, we did not observe any differences between trajectories in these two subgroups. However, age was a significant predictor, with younger patients showing more promising recovery. Also, progressive increases in arousal contributed exponentially to improvements in behavioural awareness, especially in minimally conscious patients. These findings highlight the importance of indexing arousal when measuring awareness, and the potential for interventions to regulate arousal to aid long-term behavioural recovery in disorders of consciousness.

Keywords: Coma Recovery Scale-Revised; arousal; disorders of consciousness; longitudinal; natural history.


Figures

Graphical Abstract
Graphical Abstract
Figure 1
Figure 1
Longitudinal design of the project and the statistical model. (A) Illustration of the longitudinal design of the project. Patients were assessed at the bedside every 3 months with the CRS-R. Data collection began in June 2016 and was completed in June 2018. Patients were recruited at any point in the data collection period up until February 2018 to obtain a minimum of two assessments. (B) Figure illustrating, for each patient, time elapsed since injury onset at the point of recruitment (left), alongside the timeline of individual assessments and CRS-R diagnoses (right). Patients are ordered by time of recruitment into the study, and those recruited later had fewer assessments at the end of the 2-year study period. (C) Table of the independent random and fixed factors included in the GLMM.
Figure 2
Figure 2
Patients’ behavioural recovery over time. (A) Boxplots showing the CRS-R scores of the patients across assessment. Red lines represent the medians and shaded areas represent the inter-quartile ranges. Individual scores are indicated as grey dots. (B) Illustration of the mean CRS-R scores plotted against the median days since onset (three patients’ data were removed from this graph as observations were >2 × SDs above the group mean). Error bars represent the standard errors for the group. (C) Trajectory of mean CRS-R scores (black line) of a subgroup of 10 patients who all had eight assessments. Standard error bars represent the standard error of the mean. Trajectories of individual patients in the group are plotted as thin coloured lines. (D) Stacked bar chart showing the proportion of UWS patients that changed diagnosis against the median days since injury onset at the time of the change.
Figure 3
Figure 3
Initial diagnosis as a predictor of recovery. (A) Boxplot of all 185 CRS-R scores collected from all patients, grouped by initial diagnosis. Pairwise Bonferroni contrasts showed no difference between MCS patients but statistical differences between UWS and both the MCS− and MCS+ groups. (B) Mean CRS-R scores for patients grouped by initial diagnosis at each assessment. (C) Mean CRS-R scores at each assessment for patients with a TBI aetiology grouped by initial diagnosis. (D) Mean CRS-R scores at each assessment for patients with a non-TBI aetiology grouped by initial diagnosis. Standard error bars represent the standard errors of the means for all plots.
Figure 4
Figure 4
CRS-R scores grouped by aetiology and age. (A) Mean CRS-R scores for patients grouped by aetiology. Standard error bars represent standard errors of the mean. (B) Illustration of trajectories for patients grouped by age. Younger patients, particularly those 20–29 years show a more promising trajectory with higher CRS-R scores on later assessments than older patients. Standard error bars represent standard errors of the mean.
Figure 5
Figure 5
Arousal as an important predictor of recovery. (A) Boxplots illustrating the total CRS-R scores and the subscale scores associated with each categorical score on the arousal subscale. The plots demonstrate that higher scores on all the subscales typically occur at highest arousal scores. (B) Example of an (initially) MCS− patient that shows higher CRS-R scores at later assessments (6–8) that coincides with higher scores on the arousal subscale. (C) Individual CRS-R score trajectories across assessments for each patient grouped by Initial diagnosis. Individual patients’ trajectories are represented by different coloured lines. For most patients, there are clearly higher CRS-R scores when the arousal subscale score is also higher. CRS-R scores are typically higher for later assessments and those later CRS-R scores are higher for patients with an MCS or EMCS initial diagnosis.

References

    1. Andrews K. Recovery of patients after four months or more in the persistent vegetative state. BMJ 1993; 306: 1597–600. - PMC - PubMed
    1. Bagnato S, Boccagni C, Sant'Angelo A, Fingelkurts AA, Fingelkurts AA, Galardi G.. Longitudinal assessment of clinical signs of recovery in patients with unresponsive wakefulness syndrome after traumatic or nontraumatic brain injury. J Neurotrauma 2017; 34: 535–9. - PubMed
    1. Bodien YG, Carlowicz CA, Chatelle C, Giacino JT.. Sensitivity and specificity of the Coma Recovery Scale–Revised total score in detection of conscious awareness. Arch Phys Med Rehabil 2016; 97: 490–2.e1. - PMC - PubMed
    1. Braakman R, Jennett W, Minderhoud J.. Prognosis of the posttraumatic vegetative state. Acta Neurochir 1988; 95: 49–52. - PubMed
    1. Candelieri A, Cortese MD, Dolce G, Riganello F, Sannita WG.. Visual pursuit: within-day variability in the severe disorder of consciousness. J Neurotrauma 2011; 28: 2013–7. - PubMed

LinkOut - more resources