

Association Between Automotive Assembly Plant Closures and Opioid Overdose Mortality in the United States: A Difference-in-Differences Analysis
- PMID: 31886844
- PMCID: PMC6990761
- DOI: 10.1001/jamainternmed.2019.5686
Association Between Automotive Assembly Plant Closures and Opioid Overdose Mortality in the United States: A Difference-in-Differences Analysis
Erratum in
-
Errors in Abstract and Figure 2A.JAMA Intern Med. 2020 Apr 1;180(4):618. doi: 10.1001/jamainternmed.2020.0222. JAMA Intern Med. 2020. PMID: 32119026 Free PMC article. No abstract available.
Abstract
Importance: Fading economic opportunity has been hypothesized to be an important factor associated with the US opioid overdose crisis. Automotive assembly plant closures are culturally significant events that substantially erode local economic opportunities.
Objective: To estimate the extent to which automotive assembly plant closures were associated with increasing opioid overdose mortality rates among working-age adults.
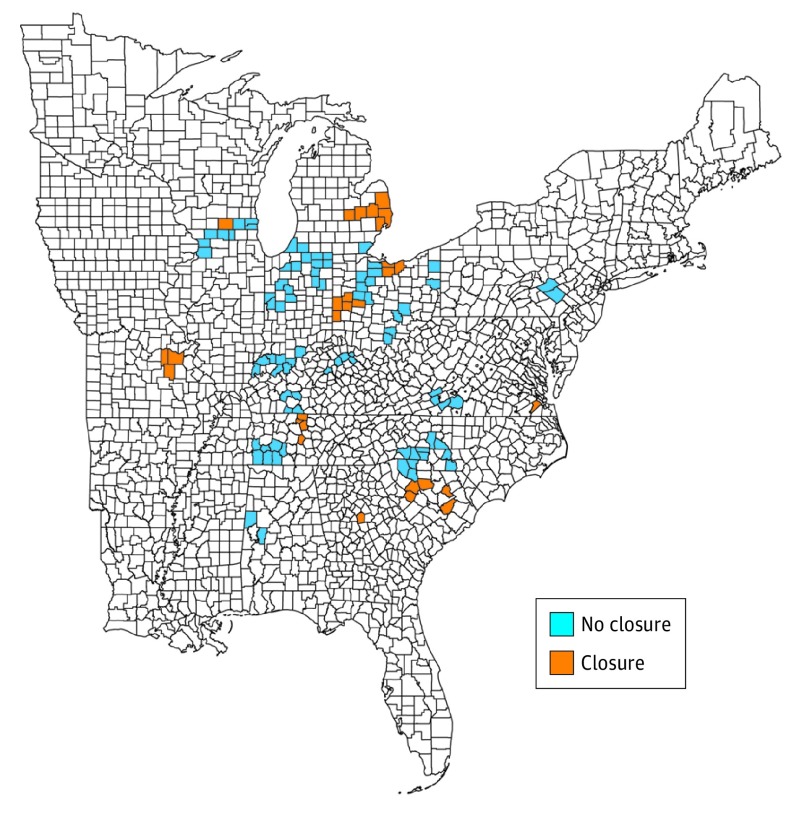
Design, setting, and participants: A county-level difference-in-differences study was conducted among adults aged 18 to 65 years in 112 manufacturing counties located in 30 commuting zones (primarily in the US South and Midwest) with at least 1 operational automotive assembly plant as of 1999. The study analyzed county-level changes from January 1, 1999, to December 31, 2016, in age-adjusted, county-level opioid overdose mortality rates before vs after automotive assembly plant closures in manufacturing counties affected by plant closures compared with changes in manufacturing counties unaffected by plant closures. Data analyses were performed between April 1, 2018, and July 20, 2019.
Exposure: Closure of automotive assembly plants in the commuting zone of residence.
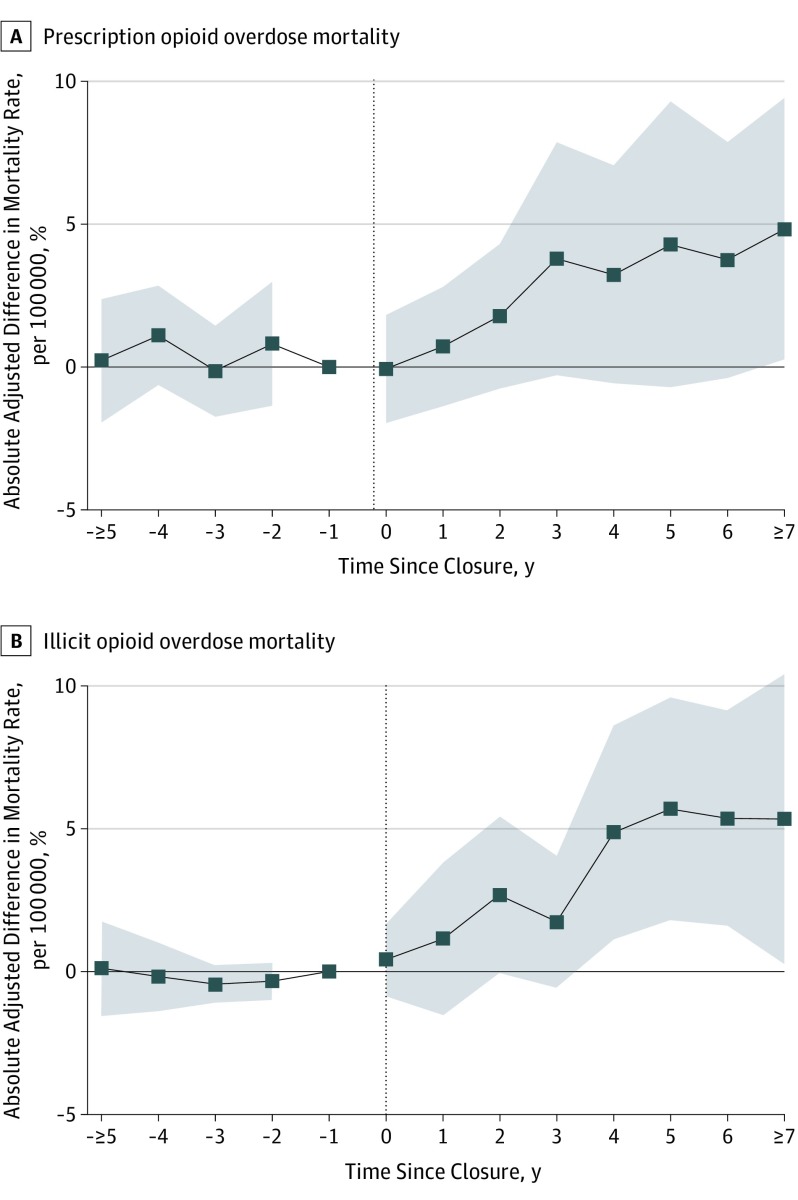
Main outcomes and measures: The primary outcome was the county-level age-adjusted opioid overdose mortality rate. Secondary outcomes included the overall drug overdose mortality rate and prescription vs illicit drug overdose mortality rates.
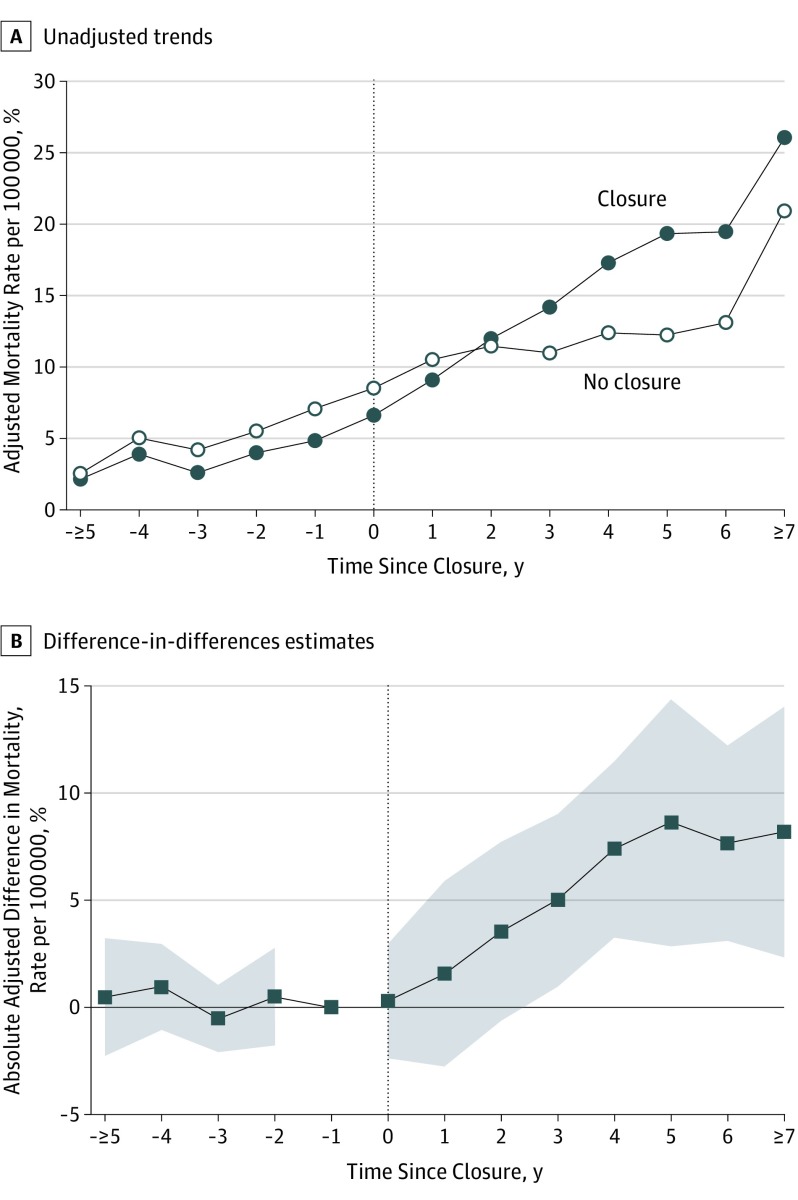
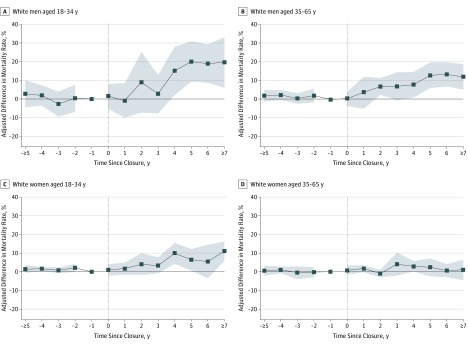
Results: During the study period, 29 manufacturing counties in 10 commuting zones were exposed to an automotive assembly plant closure, while 83 manufacturing counties in 20 commuting zones remained unexposed. Mean (SD) baseline opioid overdose rates per 100 000 were similar in exposed (0.9 [1.4]) and unexposed (1.0 [2.1]) counties. Automotive assembly plant closures were associated with statistically significant increases in opioid overdose mortality. Five years after a plant closure, mortality rates had increased by 8.6 opioid overdose deaths per 100 000 individuals (95% CI, 2.6-14.6; P = .006) in exposed counties compared with unexposed counties, an 85% higher increase relative to the mortality rate that would have been expected had exposed counties followed the same outcome trends as unexposed counties. In analyses stratified by age, sex, and race/ethnicity, the largest increases in opioid overdose mortality were observed among non-Hispanic white men aged 18 to 34 years (20.1 deaths per 100 000; 95% CI, 8.8-31.3; P = .001) and aged 35 to 65 years (12.8 deaths per 100 000; 95% CI, 5.7-20.0; P = .001). We observed similar patterns of prescription vs illicit drug overdose mortality. Estimates for opioid overdose mortality in nonmanufacturing counties were not statistically significant.
Conclusions and relevance: From 1999 to 2016, automotive assembly plant closures were associated with increases in opioid overdose mortality. These findings highlight the potential importance of eroding economic opportunity as a factor in the US opioid overdose crisis.
Conflict of interest statement
Figures
Comment in
-
Re: Association between Automotive Assembly Plant Closures and Opioid Overdose Mortality in the United States: A Difference-in-Differences Analysis.J Urol. 2020 Sep;204(3):609. doi: 10.1097/JU.0000000000001171.01. Epub 2020 Jun 26. J Urol. 2020. PMID: 32586175 No abstract available.
References
Publication types
MeSH terms
Substances
LinkOut - more resources
Full Text Sources
Miscellaneous
