. 2020 May;35(5):942-955.
doi: 10.1002/jbmr.3951. Epub 2020 Jan 16.

Myeloma Cells Down-Regulate Adiponectin in Bone Marrow Adipocytes Via TNF-Alpha

Affiliations

Myeloma Cells Down-Regulate Adiponectin in Bone Marrow Adipocytes Via TNF-Alpha

Emma V Morris et al. J Bone Miner Res. 2020 May.

Abstract

Multiple myeloma is caused by abnormal plasma cells that accumulate in the bone marrow and interact with resident cells of the bone microenvironment to drive disease progression and development of an osteolytic bone disease. Bone marrow adipocytes (BMAds) are emerging as having important endocrine functions that can support myeloma cell growth and survival. However, how BMAds respond to infiltrating tumor cells remains poorly understood. Using the C57BL/KaLwRij murine model of myeloma, bone marrow adiposity was found to be increased in early stage myeloma with BMAds localizing along the tumor-bone interface at later stages of disease. Myeloma cells were found to uptake BMAd-derived lipids in vitro and in vivo, although lipid uptake was not associated with the ability of BMAds to promote myeloma cell growth and survival. However, BMAd-derived factors were found to increase myeloma cell migration, viability, and the evasion of apoptosis. BMAds are a major source of adiponectin, which is known to be myeloma-suppressive. Myeloma cells were found to downregulate adiponectin specifically in a model of BMAds but not in white adipocytes. The ability of myeloma cells to downregulate adiponectin was dependent at least in part on TNF-α. Collectively our data support the link between increased bone marrow adiposity and myeloma progression. By demonstrating how TNF-α downregulates BMAd-derived adiponectin, we reveal a new mechanism by which myeloma cells alter the bone microenvironment to support disease progression. © 2019 The Authors. Journal of Bone and Mineral Research published by American Society for Bone and Mineral Research.

Keywords: ADIPOCYTE; ADIPONECTIN; BONE MARROW ADIPOSE TISSUE; CANCER; MULTIPLE MYELOMA.


Figures

Figure 1
Figure 1
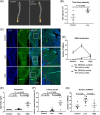
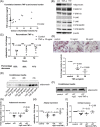
Bone marrow adiposity is increased in early stage multiple myeloma. (A) Osmium tetroxide–stained tibia analyzed in a model of low tumor burden, <10% myeloma cells in bone marrow. (B) Total bone adiposity was measured using CT Analyzer v1.13.5.1 (Bruker, Kontich, Belgium) software. (C) Immunofluorescence imaging using anti‐GFP was used to visualize the tumor area and BMAd localization in the femur (white dotted line highlights area of tumor, red dotted line denotes tumor‐bone interface). (D) Quantitation of BMAd number, inside and outside of the tumor area. (E) Paraprotein levels measured by ELISA. (F) Tumor burden was calculated using osteometric software. (G) The number of BMAds was counted using osteometric software. Data represent the mean ±SE.
Figure 2
Figure 2
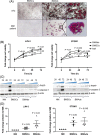
BMAds support myeloma growth and survival. (A) ST2 cell line BMSCs and patient‐derived BMSCs treated with an adipogenic cocktail. Scale bar = 200 μm. (B) Viability of myeloma cell lines was measured using Alamar blue after co‐culture with either normal media alone (NM), BMSCs, or BMAds. Results are expressed as fold change relative to control cultures. Cells were cultured in normal RPMI media. Data represent the mean ±SE of three independent experiments. Statistical significance was calculated compared with NM. (C) The expression of apoptotic markers was assessed by immunoblotting. (D) Migration was assessed using Boyden chambers. Cell number in the lower chamber was measured using Alamar blue. Data represent the mean ±SE of four independent experiments. Statistical significance was calculated compared with NM control.
Figure 3
Figure 3
BMAds support myeloma cell growth by a lipid‐independent mechanism. (A) BODIPY 493/503 staining of myeloma patient‐derived lipid droplets (green) in JJN‐3 cells. Scale bar = 50 μm. (B) Lipidtox neutral red staining of ST2‐derived lipid droplets in JJN‐3 cells. Scale bar = 50 μm. (C) Lipidtox neutral red staining of ST2‐derived lipid droplets in 5TGM1‐GFP cells. Scale bar = 50 μm. All microscopy images show a representative image from four independent experiments. (D) The percentage of cells exhibiting lipid droplets was calculated using ImageJ software. Data points represent the mean ±SE of four independent experiments. (E) Viability was measured using Alamar blue in JJN‐3 and 5TGM1 cells after incubation with normal media (NM), NM with supernatant from scraped ST2 BMSCs, or NM with ST2 BMAd‐derived lipid droplets. Data points represent the mean ±SE of three independent experiments. Statistical significance was calculated compared with NM control.
Figure 4
Figure 4
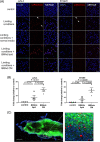
Growth‐limiting conditions induce de novo lipogenesis in myeloma cells. (A) Lipidtox neutral red staining of ST2‐derived lipid droplets in JJN‐3 and 5TGM1 cells cultured in limiting conditions and treated with liberated lipids or conditioned media from BMAds. Scale bar = 50 μm. All microscopy images show a representative image from three independent experiments. (B) Viability was measured using Alamar blue. Results are expressed as fold change relative to control cultures. Cells were cultured under limiting conditions for 24 hours followed by the addition of BMAd‐derived lipid or BMAd conditioned media for a further 24 hours. Data represent the mean ±SE of four independent experiments. Statistical significance was calculated compared with limiting media control. (C) Bone marrow plug taken from a 6‐month‐old mouse 23 days post inoculation with 5TGM1 myeloma cells. Immunofluorescence of 5TGM1‐GFP (green) cells and Lipidtox (red) to visualize adipocytes/lipid. Scale bars = 200 and 50 μm, respectively.
Figure 5
Figure 5
Myeloma cells downregulate adiponectin in BMAds. (A) Adiponectin expression in human serum. (B) Bone marrow plasma concentrations of adiponectin in an experimental cohort of KaLwRij mice. (C) Adiponectin expression in ST2 cells co‐cultured with myeloma cell lines for 24, 48, and 72 hours was assessed by immunoblotting. (D) Secreted adiponectin levels in conditioned media from ST2 cells co‐cultured with myeloma cell lines for 24, 48, and 72 hours were assessed by immunoblotting. Equal volumes of conditioned media were loaded into each lane. (E) Adipoq expression in ST2 cells co‐cultured with myeloma cells for 24, 48, and 72 hours was assessed using RT‐PCR (ND = not detectable). Data points represent the mean ±SE of three independent experiments. Statistical significance was calculated compared to ST2 alone control (no adipogenic media). (F) Adiponectin expression in ST2 cells co‐cultured with primary human myeloma cells for 24 and 72 hours was assessed by immunoblotting.
Figure 6
Figure 6
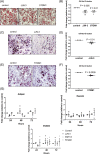
Myeloma cells reduce BMAd size and number without causing a generalized loss in adipokine secretion. (A) Oil Red O–stained BMAds after 72 hours of direct co‐culture with myeloma cells. Scale bar = 50 μm. (B) Eluted Oil Red O stain from BMAds after direct co‐culture with JJN‐3 or 5TGM1 cells. (C) BMAds after 72 hours of transwell co‐culture with JJN‐3 cells. Scale bar = 50 μm. (D) Eluted Oil Red O stain from BMAds after transwell co‐culture with JJN‐3 cells. (E) BMAds after 72 hours of transwell co‐culture with 5TGM1 cells. Scale bar = 50 μM. (F) Eluted Oil Red O stain from BMAds after transwell co‐culture with 5TGM1 cells. Data points represent the mean ±SE of three independent experiments. Statistical significance was calculated compared with ST2 alone control. (G) CFD/Adispsin, ADSF/Resistin, and Nampt/Visfatin expression was assessed by RT‐PCR. Data points represent the mean ±SE of three independent experiments, p > 0.05. Exact p values are shown in Supplemental Table S1.
Figure 7
Figure 7
TNF‐α downregulates adiponectin in BMAds. (A) Correlation between bone marrow plasma–derived TNF‐α and tumor burden from 5TGM1 myeloma‐bearing mice. (B) Myeloma cells activate ERK1/2 signaling in BMAds. Protein levels of Adiponectin, P‐ERK1/2, T‐ERK1/2, P‐JNK, T‐JNK, P‐P38 MAPK, and T‐P38 MAPK were assessed by immunoblotting in ST2‐derived BMAds after 24‐hour treatment with 10 ng/mL recombinant TNF‐α or co‐culture with 5TGM1 cells. (C) Adipoq expression in ST2‐derived BMAds after treatment with 10 ng/mL mouse recombinant TNF‐α for 24, 48, and 72 hours was measured by RT‐PCR. Percentage decrease was calculated compared with time point control. (D) Protein levels of adiponectin in conditioned media taken from ST2‐derived BMAds after 10 or 20 ng/mL mouse recombinant TNF‐α treatment for 24, 48, or 72 hours were assessed by immunoblotting. Equal volumes of conditioned media were loaded into each lane. (E) BMAds were treated with 10 or 20 ng/mL mouse recombinant TNF‐α for 72 hours. Cells were fixed and stained with Oil Red O stain. Scale bar = 50 μm. Stain was eluted and absorbance measured. (F) BMAds were co‐cultured with myeloma cells (5TGM1) in the presence or absence of an anti‐TNF‐α neutralizing antibody. Secreted adiponectin level in the conditioned media was measured. Equal volumes of conditioned media was loaded into each lane. (G) Densitometry using ImageJ software was used to quantify the level of secreted adiponectin shown in F. (H) BMAds were cultured with myeloma cells (5TGM1) in the presence or absence of an anti‐TNF‐α neutralizing antibody and Adipoq expression was assessed by RT‐PCR. Data points represent the mean (±SE) of three independent experiments. Statistical significance was calculated compared with control. (I) BMAds were co‐cultured with myeloma cells (5TGM1) in the presence or absence of an anti‐TNF‐α neutralizing antibody for 72 hours. BMAds were fixed and stained with Oil Red O. Stain was eluted and absorbance measured. Data points represent the mean ±SE of six independent experiments. Statistical significance was calculated compared with control.

Similar articles

Cited by

References

    1. Mundy GR. Mechanisms of bone metastasis. Cancer. 1997;80(8 Suppl):1546–56. - PubMed
    1. Fazeli PK, Horowitz MC, MacDougald OA, et al. Marrow fat and bone—new perspectives. J Clin Endocrinol Metab. 2013;98(3):935–45. - PMC - PubMed
    1. Scheller EL, Rosen CJ. What's the matter with MAT? Marrow adipose tissue, metabolism, and skeletal health. Ann N Y Acad Sci. 2014;1311:14–30. - PMC - PubMed
    1. Cawthorn WP, Scheller EL, Learman BS, et al. Bone marrow adipose tissue is an endocrine organ that contributes to increased circulating adiponectin during caloric restriction. Cell Metab. 2014;20(2):368–75. - PMC - PubMed
    1. Herroon MK, Rajagurubandara E, Hardaway AL, et al. Bone marrow adipocytes promote tumor growth in bone via FABP4‐dependent mechanisms. Oncotarget. 2013;4(11):2108–23. - PMC - PubMed

Publication types