. 2019 Dec 30;15(12):e1008249.
doi: 10.1371/journal.ppat.1008249. eCollection 2019 Dec.

Cross-talk between microglia and neurons regulates HIV latency

Affiliations

Cross-talk between microglia and neurons regulates HIV latency

David Alvarez-Carbonell et al. PLoS Pathog. .

Abstract

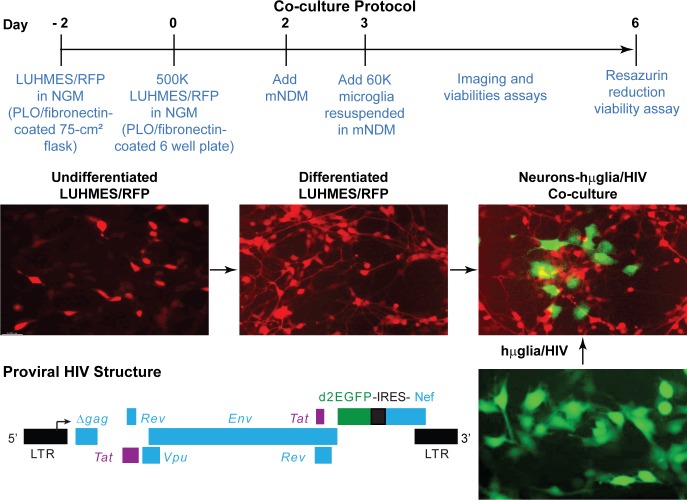
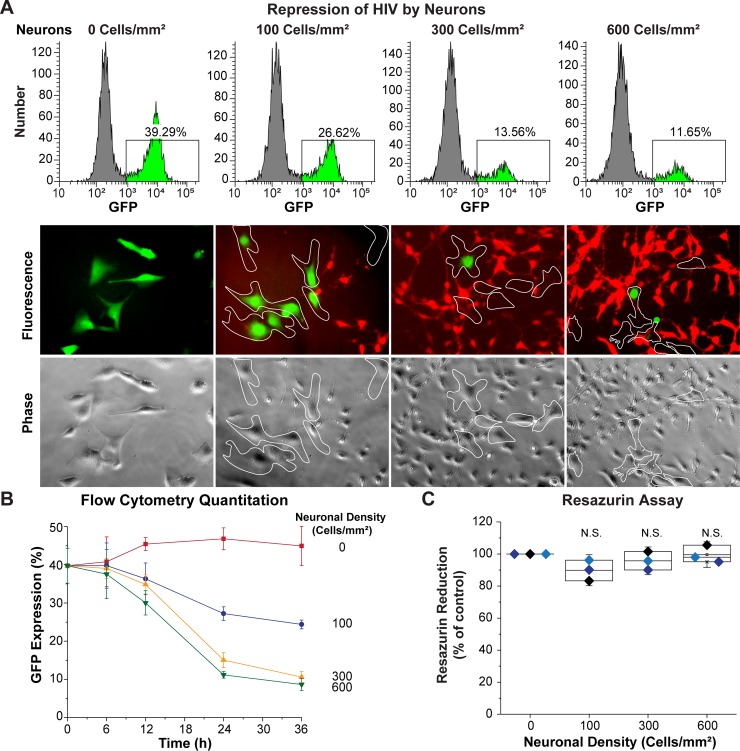
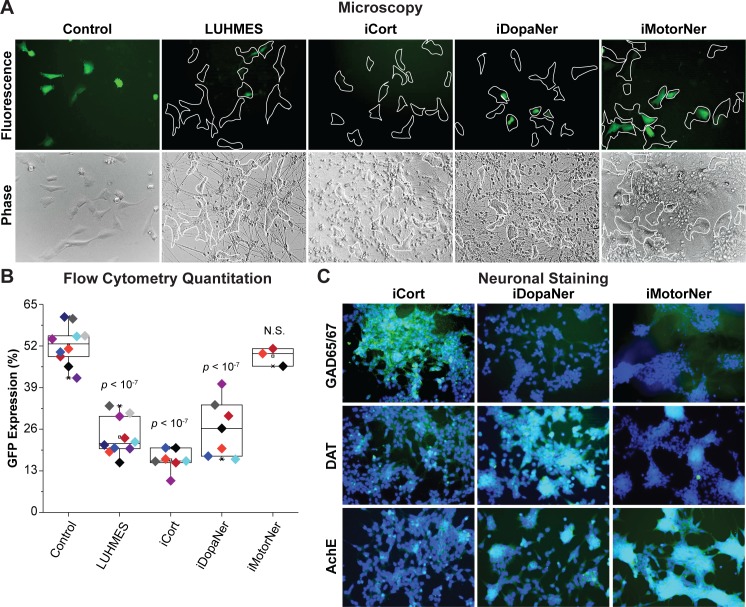
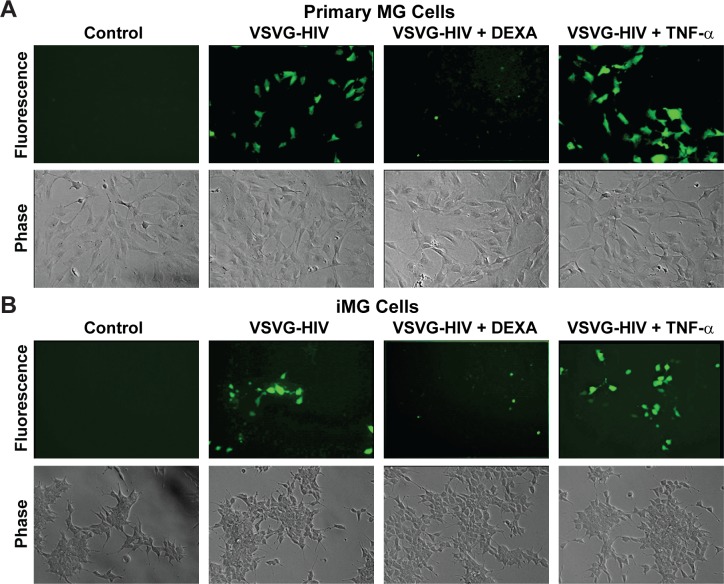
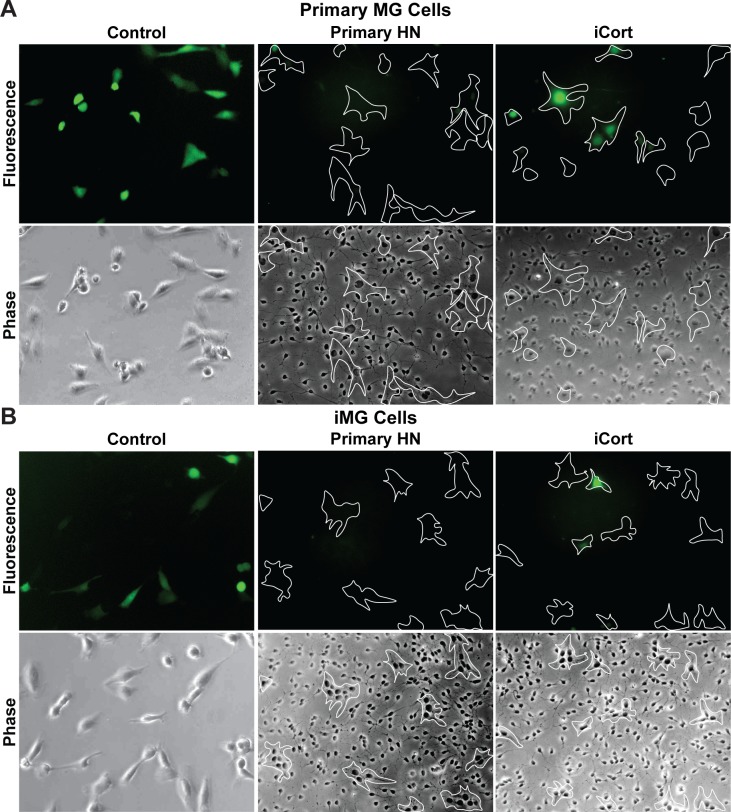
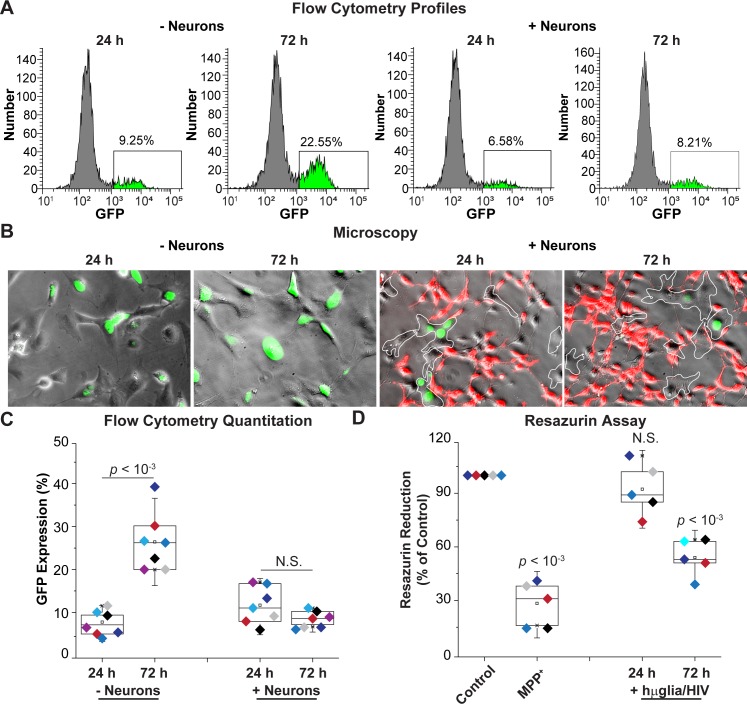
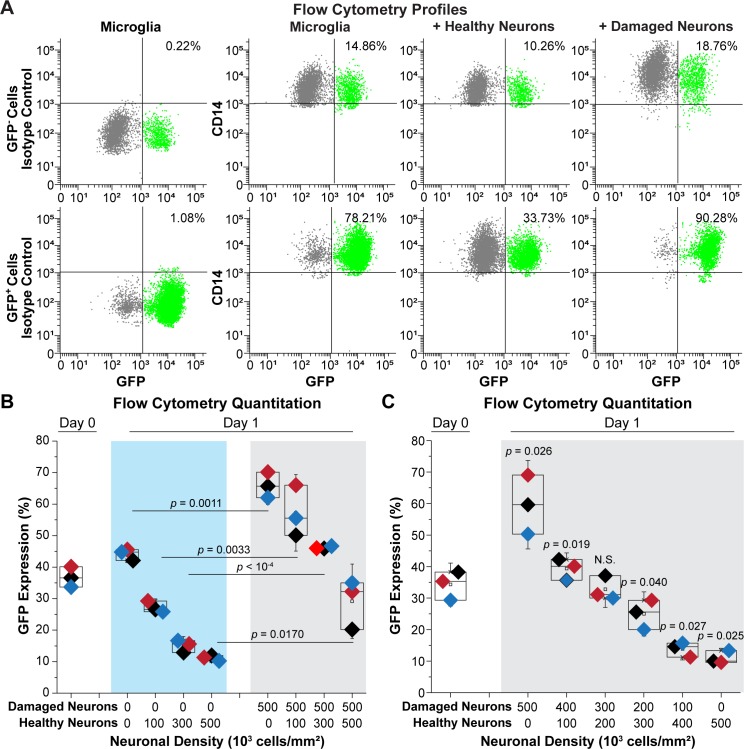
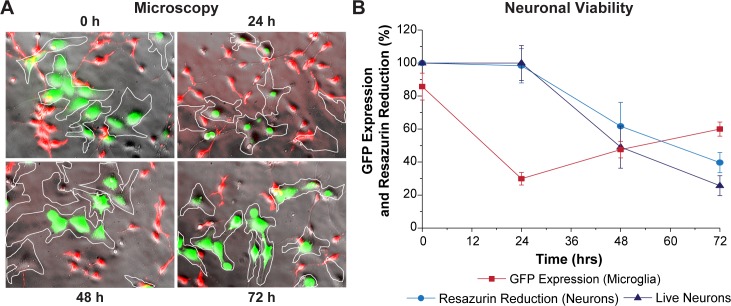
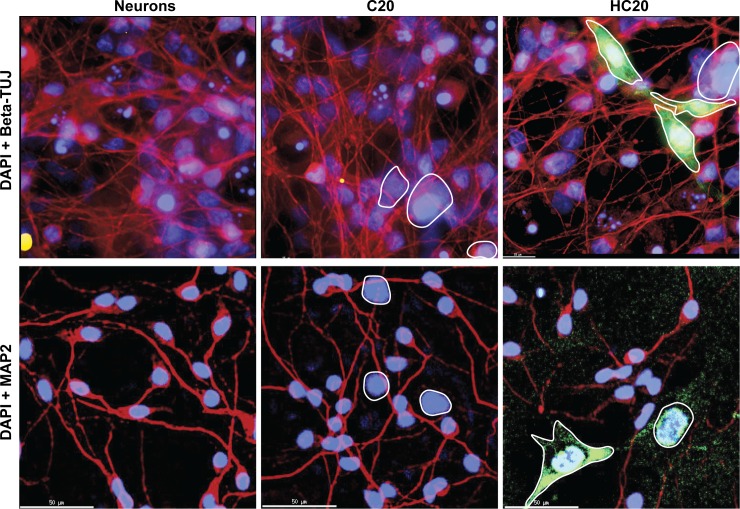
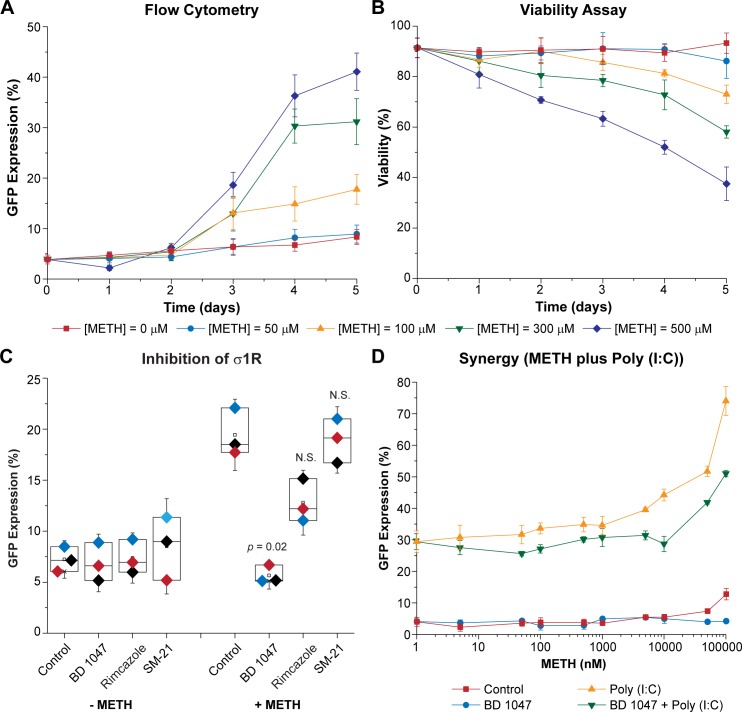
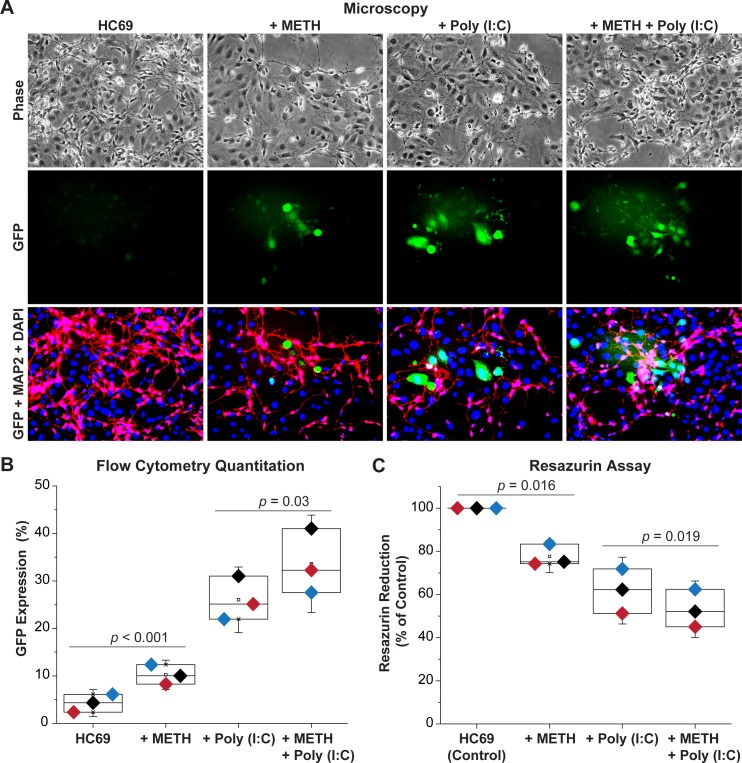
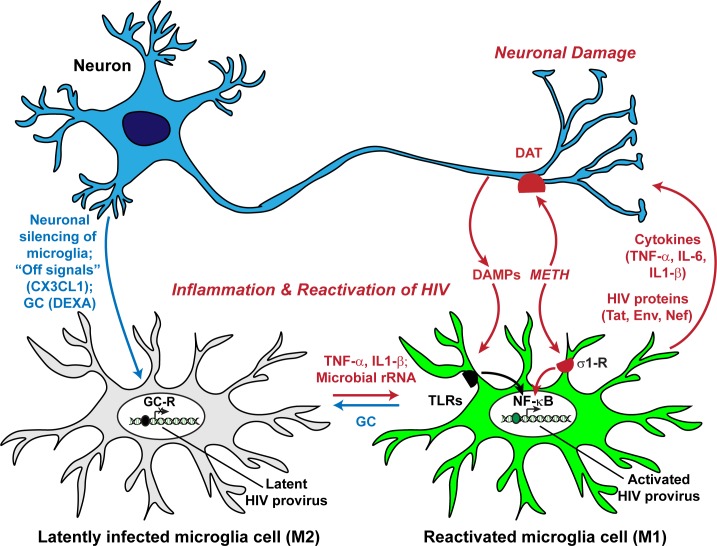
Despite effective antiretroviral therapy (ART), HIV-associated neurocognitive disorders (HAND) are found in nearly one-third of patients. Using a cellular co-culture system including neurons and human microglia infected with HIV (hμglia/HIV), we investigated the hypothesis that HIV-dependent neurological degeneration results from the periodic emergence of HIV from latency within microglial cells in response to neuronal damage or inflammatory signals. When a clonal hμglia/HIV population (HC69) expressing HIV, or HIV infected human primary and iPSC-derived microglial cells, were cultured for a short-term (24 h) with healthy neurons, HIV was silenced. The neuron-dependent induction of latency in HC69 cells was recapitulated using induced pluripotent stem cell (iPSC)-derived GABAergic cortical (iCort) and dopaminergic (iDopaNer), but not motor (iMotorNer), neurons. By contrast, damaged neurons induce HIV expression in latently infected microglial cells. After 48-72 h co-culture, low levels of HIV expression appear to damage neurons, which further enhances HIV expression. There was a marked reduction in intact dendrites staining for microtubule associated protein 2 (MAP2) in the neurons exposed to HIV-expressing microglial cells, indicating extensive dendritic pruning. To model neurotoxicity induced by methamphetamine (METH), we treated cells with nM levels of METH and suboptimal levels of poly (I:C), a TLR3 agonist that mimics the effects of the circulating bacterial rRNA found in HIV infected patients. This combination of agents potently induced HIV expression, with the METH effect mediated by the σ1 receptor (σ1R). In co-cultures of HC69 cells with iCort neurons, the combination of METH and poly(I:C) induced HIV expression and dendritic damage beyond levels seen using either agent alone, Thus, our results demonstrate that the cross-talk between healthy neurons and microglia modulates HIV expression, while HIV expression impairs this intrinsic molecular mechanism resulting in the excessive and uncontrolled stimulation of microglia-mediated neurotoxicity.


Conflict of interest statement

The authors have declared that no competing interests exist.

Figures

Fig 1
Fig 1. Establishment of a neurons-hμglia/HIV co-culture system.
The time line is indicated by the large black arrow, with the corresponding day number shown in red. Undifferentiated, neuron precursor cells LUHMES/RFP are plated and allowed to expand for 2 days prior to transferring to the experimental wells at 500,000 neurons per well of a six-well plate at day 0. After 2 days, the neuronal differentiation is initiated by adding modified neuronal differentiation medium (mNDM). After differentiation for 1 day, 60,000 immortalized human microglial cells (hμglia/HIV) carrying a single round HIV construct with a GFP reporter (diagrammed, bottom left) are added. The viability of the neurons and the expression levels of HIV are monitored for 3 days.
Fig 2
Fig 2. LUHMES-derived neurons inhibit HIV expression.
60,000 HC69 (hμglia/HIV) cells were plated in the absence or presence of increasing densities of LUHMES-derived neurons (Cells/mm2). The level of HIV expression was evaluated after 24 h by flow cytometry and fluorescence microscopy. (A) Flow cytometry profiles from representative single cultures (top) and microscopy (bottom). In the histograms GFP+ cells are indicated in bright green. Microglia were identified by phase contrast microscopy and are outlined by the white contours on the micrographs. (B) Progressive inhibition of HIV expression (Y-axis) at increasing neuronal densities during a time-course of 36 h (X-axis). The error bars represent the SD of n = 3 independent experiments. (C) Resazurin assay to evaluate neuronal viability. The resazurin reduction values (Y-axis) were normalized to the control culture of neurons alone. Each colored symbol represents one experiment. There was no statistically significant (N.S.) differences in cell viability in these experiments.
Fig 3
Fig 3. iPSC-derived neurons repress HIV expression.
(A) 60,000 hμglia/HIV HC69 cells were plated in the presence of 0.5 x 10⁶ LUHMES-derived neurons (as positive control) or 0.5 x 10⁶ iPSC-derived GABAergic cortical (iCort), dopaminergic (iDopaNer) or motor neurons (iMotorNer). HIV expression was evaluated after 24 h by fluorescence microscopy. Microglia identified by phase contrast microscopy are outlined by the white contours. (B) Flow cytometric analysis of microglial cell GFP expression. The p-values of pair-sample, Student’s t-tests comparing the microglial cells cultured alone or in the presence of neurons are shown. Individual independent experiments are color coded (n = number of independent samples). N.S.: non-significant. (C) Identification of differentiation of iPSC-derived neurons. Super-imposed images of DAPI stained nuclei (blue) and Alexa-Fluor 488 stained neuronal antigens (green) are shown. Neurons were stained with antibodies against GAD65/67, DAT, and AchE and Alexa Fluor 488-conjugated anti-rabbit secondary antibody.
Fig 4
Fig 4. Human primary and iPSC-derived microglia infected with VSVG-HIV-GFP can establish latent infections.
(A) Human primary microglial (MG) cells. (B) iPSC-derived microglial (iMG cells). Each cell type was infected with VSVG-HIV-GFP viruses for 72 h and GFP-expressing cells visualized by fluorescence microscopy. The infected cells were then either treated with DEXA (1 μM) for 24 h or with TNF-α (200 pg/mL) for 16 h and the proportion of GFP-expressing cells measured by fluorescence microscopy.
Fig 5
Fig 5. Primary neurons silence HIV expression in primary microglia.
(A) Human primary microglial (MG) cells. (B) iPSC-derived microglial (iMG cells). For each cell type, 60 x 103 cells were plated in the absence or presence of 0.5 x 10⁶ human primary neurons (Primary HN) or iPSC-derived GABAergic cortical neurons (iCort). HIV expression was evaluated after 24 h by fluorescence microscopy. Microglia identified by phase contrast microscopy are outlined by the white contours. Healthy neurons prevent spontaneous HIV reactivation in GFP- cells.
Fig 6
Fig 6. Neurons prevent HIV emergence from latency.
(A) Flow cytometry profiles of representative single cultures. hμglia/HIV HC69 cells were sorted into a GFP- cell population and cultured in the presence or absence of neurons. GFP expression was measured after 24 h or 72 h. (B) Microscopy of HC69 cells unexposed or exposed to neurons for 24 or 72 h. Microglial cells are outlined by a white dashed-line. (C) Quantitation of GFP expression. (D) Resazurin assay to evaluate neuronal viability. The resazurin reduction values (Y-axis) plotted are referenced to the control culture (neurons only), set at 100%. MPP+ was used a positive control for resazurin reduction. For both (C) and (D), the p-values of pair-sample t-tests of multiple experiments (n = number of independent samples) comparing the unexposed vs. the exposed cells are shown. N.S.: non-significant. Individual experimental series are color-coded.
Fig 7
Fig 7. Effect of healthy neurons vs. damaged neurons on HIV expression.
(A) Representative flow cytometry profiles. hμglia/HIV HC69 cells were sorted into GFP- and GFP+ cells. Each population was expanded for 48 h prior to collection and co-cultured with either healthy neurons or damaged neurons at a ratio of 50:6. GFP (X-axis) and CD14 (Y-axis) expression, and the percentage of GFP+ cells that were CD14+ is shown. Isotype controls for the anti-CD14 antibody were performed for both the GFP+ and GFP- populations (left). (B) Quantitation of GFP expression. 60 x 103 HC69 cells were co-cultured in the presence of an increasing number of healthy (H) neurons in the absence damaged (H) neurons (X-axis) for 24 h prior to measuring GFP expression (Y-axis) (left). In parallel experiments, microglial cells were co-cultured with increasing numbers of healthy (H) neurons in the presence of 500 x 103 damaged (D) neurons (right). (C) Quantitation of GFP expression. 60 x 103 HC69 cells were co-cultured in the presence of 500 x 103 total neurons at the indicated ratios of damaged (D) to healthy (H) neurons (X-axis) for 24 h prior to measuring GFP expression (Y-axis). Diamonds of similar color represent an individual experimental series. (n = number of individual samples). The p-values of paired-sample t-tests comparing the unexposed vs. exposed cells are shown. N.S.; non-significant.
Fig 8
Fig 8. HIV expression rebounds in microglia exposed to neurons.
(A) Super-imposed phase contrast and fluorescence images of HC69 GFP+ cells exposed to neurons for 24, 72, or 96 h. Microglial cells are outlined by the white contours. (B) Quantitation of GFP expression (red), relative resazurin reduction (blue), and relative live neuron counts (purple), Y-axis, vs. Time, X-axis. Error bars: standard deviation (n = 3).
Fig 9
Fig 9. Activated human microglia/HIV induce neuronal damage.
LUHMES-derived neurons were co-cultured with hμglia clone C20 or mixed population of cells that had been infected with HIV (HC20). Top: The neurons or co-cultures were stained with anti-beta-TUJ antibody (Red). Bottom: Neurons were co-cultured with C20 or HC20 cells and stained with anti-MAP2 (Red). Green: GFP expression in activated HC20 cells. Red: Alexa Fluor 488 antibodies were used as secondary antibodies. Blue: DAPI stained cell nuclei.
Fig 10
Fig 10. METH-mediated reactivation of HIV.
(A) Effect of METH on HIV reactivation. (B) Cell viability. HC69 cells were incubated for 1, 2, 3, 4 or 5 days (X-axis) with indicated concentrations of METH prior to flow cytometry analysis and PI exclusion cell viability assay (Y-axis). Error bars represent standard deviations of three or more experiments. (C) σ1R mediates METH effect on HIV reactivation. HC69 cells were either untreated (Control) or treated with BD1047, rimcazole, or SM-21 prior to exposure to 300 μM of METH (+ METH) or untreated (- METH). Diamonds of similar color represent an individual experimental series. (n = number of individual samples). The p-values of pair-sample t-tests comparing the unexposed vs. the exposed cells are shown. N.S.: non-significant. (D) METH sensitizes hμglia for poly (I:C)-mediated HIV reactivation at low doses. HC69 cells were treated with increasing concentrations of METH (Control; 0, 1, 5, 50, 100 and 500 nM, and 1, 5, 10, 50 and 100 μM; X-axis, log scale) for 72 h prior to exposure to poly (I:C) (50 ng/mL). Parallel experiments were performed in the presence of BD1047 (10 μM). Error bars represent standard deviation of three or more experiments.
Fig 11
Fig 11. Exposure of co-cultures to combinations of METH- and Poly (I:C) induce extensive neuronal damage.
(A) Microscopy of HC69 cells co-cultured with iCort neurons for 96 h in the presence and absence of 100 nM METH and 50 ng/ml Poly (I:C). Top: Phase contrast image. Middle: GFP positive microglial cells. Bottom: Neurons were stained with anti-MAP2 (Red). Green: GFP expression in activated HC69 cells. Red: Alexa Fluor 488 antibodies were used as secondary antibodies. Blue: DAPI stained cell nuclei. (B) Induction of GFP expression in HC69 cells co-cultured with iCort neurons for 96 h and then measured by flow cytometry. Cells were treated with 100 nM METH or 50 ng/ml Poly (I:C) or a combination of 100 nM METH or 50 ng/ml Poly (I:C). Error bars represent standard deviations of three experiments. (C) Resazurin assay to evaluate neuronal viability. The resazurin reduction values (Y-axis) plotted are referenced to the control culture (untreated HC69 cells), set at 100%. The p-values of pair-sample t-tests of multiple experiments comparing the control vs. the METH exposed cells and Poly (I:C) treated cells vs. the METH plus Poly (I:C) treated cells are shown. Error bars represent standard deviation of three experiments.
Fig 12
Fig 12. Disruption of microglial cell-neuron communication drives HIV replication in the brain and leads to neuronal degeneration.
Healthy neurons suppress HIV expression in microglia. Although the mechanisms are not fully understood, HIV silencing correlates with establishment of a resting (M0) state. This is likely to be mediated by glucocorticoids (GC) and the fractalkine (CX3CL1) system. Inflammatory cytokines such as TNF-α and IL-1β, or TLR agonists such as LPS and microbial metabolites, including rRNA fragments, activate microglia (M1) and induce HIV transcription. The production of inflammatory cytokines and HIV proteins then leads to further neuronal damage. METH, acting through the σ1R receptor on microglia and DAT on neurons, works in concert with the pro-inflammatory agents to further disrupt normal cell physiology and enhance HIV transcription. Thus, inflammation can initiate a vicious cycle of neuronal damage/microglial cell activation leading to HIV reactivation.

References

    1. Sacktor N, McDermott MP, Marder K, Schifitto G, Selnes OA, McArthur JC, et al. HIV-associated cognitive impairment before and after the advent of combination therapy. J Neurovirol. 2002;8(2):136–42. Epub 2002/04/06. 10.1080/13550280290049615 . - DOI - PubMed
    1. Cherner M, Masliah E, Ellis RJ, Marcotte TD, Moore DJ, Grant I, et al. Neurocognitive dysfunction predicts postmortem findings of HIV encephalitis. Neurology. 2002;59(10):1563–7. Epub 2002/11/27. 10.1212/01.wnl.0000034175.11956.79 . - DOI - PubMed
    1. Heaton RK, Clifford DB, Franklin DR Jr., Woods SP, Ake C, Vaida F, et al. HIV-associated neurocognitive disorders persist in the era of potent antiretroviral therapy: CHARTER Study. Neurology. 2010;75(23):2087–96. Epub 2010/12/08. 75/23/2087 [pii] 10.1212/WNL.0b013e318200d727 - DOI - PMC - PubMed
    1. Portilla I, Reus S, Leon R, van-der Hofstadt C, Sanchez J, Lopez N, et al. Neurocognitive Impairment in Well-Controlled HIV-Infected Patients: A Cross-Sectional Study. AIDS research and human retroviruses. 2019. Epub 2019/03/19. 10.1089/aid.2018.0279 . - DOI - PubMed
    1. Sacktor N, Skolasky RL, Seaberg E, Munro C, Becker JT, Martin E, et al. Prevalence of HIV-associated neurocognitive disorders in the Multicenter AIDS Cohort Study. Neurology. 2016;86(4):334–40. Epub 2016/01/01. 10.1212/WNL.0000000000002277 - DOI - PMC - PubMed

Publication types