Review
. 2020 May;157(5):1147-1157.
doi: 10.1016/j.chest.2019.11.039. Epub 2019 Dec 28.

Machine Learning Characterization of COPD Subtypes: Insights From the COPDGene Study

Collaborators, Affiliations
Review

Machine Learning Characterization of COPD Subtypes: Insights From the COPDGene Study

Peter J Castaldi et al. Chest. 2020 May.

Abstract

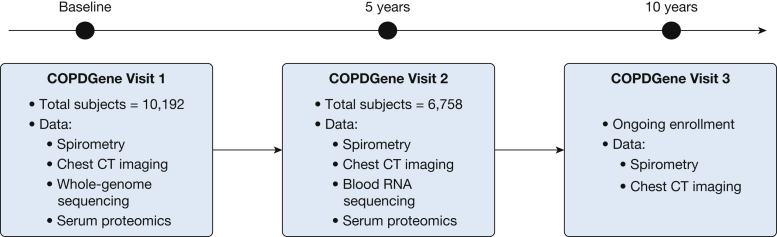
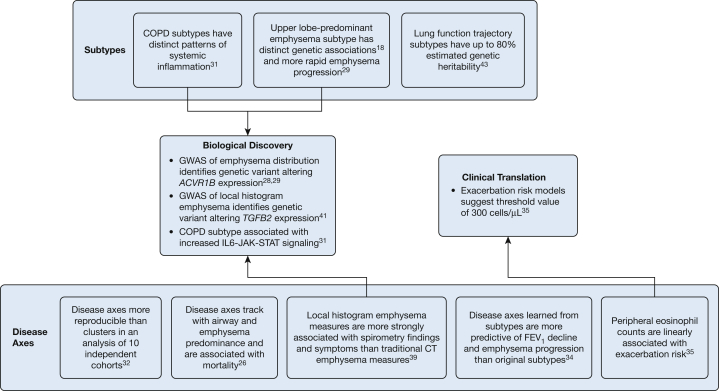
COPD is a heterogeneous syndrome. Many COPD subtypes have been proposed, but there is not yet consensus on how many COPD subtypes there are and how they should be defined. The COPD Genetic Epidemiology Study (COPDGene), which has generated 10-year longitudinal chest imaging, spirometry, and molecular data, is a rich resource for relating COPD phenotypes to underlying genetic and molecular mechanisms. In this article, we place COPDGene clustering studies in context with other highly cited COPD clustering studies, and summarize the main COPD subtype findings from COPDGene. First, most manifestations of COPD occur along a continuum, which explains why continuous aspects of COPD or disease axes may be more accurate and reproducible than subtypes identified through clustering methods. Second, continuous COPD-related measures can be used to create subgroups through the use of predictive models to define cut-points, and we review COPDGene research on blood eosinophil count thresholds as a specific example. Third, COPD phenotypes identified or prioritized through machine learning methods have led to novel biological discoveries, including novel emphysema genetic risk variants and systemic inflammatory subtypes of COPD. Fourth, trajectory-based COPD subtyping captures differences in the longitudinal evolution of COPD, addressing a major limitation of clustering analyses that are confounded by disease severity. Ongoing longitudinal characterization of subjects in COPDGene will provide useful insights about the relationship between lung imaging parameters, molecular markers, and COPD progression that will enable the identification of subtypes based on underlying disease processes and distinct patterns of disease progression, with the potential to improve the clinical relevance and reproducibility of COPD subtypes.

Keywords: COPD; emphysema; machine learning.


Figures

Figure 1
Figure 1
Overview of data gathered at the baseline, 5-year, and 10-year visits of the COPD Genetic Epidemiology Study (COPDGene).
Figure 2
Figure 2
Summary of contributions from COPDGene to machine learning approaches to COPD subtyping. GWAS = genome-wide association study. See Figure 1 legend for expansion of other abbreviation.
Figure 3
Figure 3
Scatterplot matrices show the distribution of clustering-defined subtypes (Castaldi et al18) in principal component space for 500 subjects from COPDGene (A), and the same subjects projected along the dimensions of FEV1 % predicted, CT quantitative emphysema, and CT airway wall thickness with points colored by Global Initiative for Chronic Obstructive Lung Disease spirometric categories (B). AP = airway predominant; AWT, % = airway wall thickness as a percentage of total luminal area for segmental airways; G0-G4 = Global Initiative for Chronic Obstructive Lung Disease spirometric stages 0 to 4; PC = principal component; PRISm = preserved ratio impaired spirometry (ie, FEV1 < 80% of predicted, FEV1/FVC > 0.7); RRS = relatively resistant smokers; SEO = severe emphysema and obstruction; UEP = upper lobe emphysema predominant. See Figure 1 legend for expansion of other abbreviation.
Figure 4
Figure 4
The y-axis represents the predicted probability of all-cause mortality ranging from 4% (shown in dark blue), 5% to 10% (shown in purple), 10% to 15% (shown in blue), 15% to 20% (shown in green), 20% to 25% (shown in orange), 25% to 30% (shown in yellow), 30% to 35% (shown in red), to > 35% (shown in dark red) for each decile of loading score for factors 1 (Emphysema Axis) and 2 (Airway Axis) in a Cox proportional hazards model including age, sex, current smoking, pack years of smoking, BMI, high BP, each of the five factors, the interaction between factors 1 and 2, and a quadratic term for factor 2. The x and z axes represent deciles of each axis, ranging from 1 (representing a small loading score) to 10 (representing a large loading score).
Figure 5
Figure 5
Distribution of chronic bronchitis disease axis values at the COPDGene baseline visit according to presence of chronic bronchitis symptoms at the baseline and 5-year study visit. Subjects with persistent chronic bronchitis symptoms (ie, present at both visits, CB [1,1]) had disease axis values that were higher than subjects without chronic bronchitis (CB [0,0]) and subjects with intermittent symptoms (CB [1,0] for chronic bronchitis at baseline but not at the 5-year visit). P values were calculated by using the Mann-Whitney U test. See Figure 1 legend for expansion of abbreviation.
Figure 6
Figure 6
Four lung function trajectories learned from analyzing 1,060 men followed up for > 20 years in the Normative Aging Study. Trajectory 1 was characterized by both a lower maximal FEV1 attained as well as a more rapid rate of lung function loss in mid-life. The other trajectories differed primarily in maximal FEV1 attained but not in rate of decline. See Figure 1 legend for expansion of abbreviation.

References

    1. Rennard S.I., Vestbo J. The many “small COPDs.”. Chest. 2008;134(3):623. - PubMed
    1. Singh D., Agustí A.G.N., Anzueto A. Global strategy for the diagnosis, management, and prevention of chronic obstructive lung disease: the GOLD science committee report 2019. Eur Respir J. 2019;53(5):1900164. - PubMed
    1. Bhatt S.P., Washko G.R., Hoffman E.A. Imaging advances in chronic obstructive pulmonary disease. Insights from the Genetic Epidemiology of Chronic Obstructive Pulmonary Disease (COPDGene) Study. Am J Respir Crit Care Med. 2019;199(3):286–301. - PMC - PubMed
    1. Stringer W.W., Porsasz J., Bhatt S.P., McCormack M.C., Make B.J., Casaburi R. Physiologic insights from the COPDGene study. Journal of the COPD Foundation. 2019;6(3):256–266. - PMC - PubMed
    1. Maselli D.J., Bhatt S.P., Anzueto A. Clinical epidemiology of COPD: insights from 10 years of the COPDGene study. Chest. 2019;156(2):228–238. - PMC - PubMed

Publication types

MeSH terms