. 2020 Apr:326:113164.
doi: 10.1016/j.expneurol.2019.113164. Epub 2019 Dec 27.

Neuronal ablation of mt-AspRS in mice induces immune pathway activation prior to severe and progressive cortical and behavioral disruption

Affiliations

Neuronal ablation of mt-AspRS in mice induces immune pathway activation prior to severe and progressive cortical and behavioral disruption

Christina L Nemeth et al. Exp Neurol. 2020 Apr.

Abstract

Leukoencephalopathy with brainstem and spinal cord involvement and lactate elevation (LBSL) is a rare, slowly progressive white matter disease caused by mutations in the mitochondrial aspartyl-tRNA synthetase (mt-AspRS, or DARS2). While patients show characteristic MRI T2 signal abnormalities throughout the cerebral white matter, brainstem, and spinal cord, the phenotypic spectrum is broad and a multitude of gene variants have been associated with the disease. Here, Dars2 disruption in CamKIIα-expressing cortical and hippocampal neurons results in slowly progressive increases in behavioral activity at five months, and culminating by nine months as severe brain atrophy, behavioral dysfunction, reduced corpus callosum thickness, and microglial morphology indicative of neuroinflammation. Interestingly, RNAseq based gene expression studies performed prior to the presentation of this severe phenotype reveal the upregulation of several pathways involved in immune activation, cytokine production and signaling, and defense response regulation. RNA transcript analysis demonstrates that activation of immune and cell stress pathways are initiated in advance of a behavioral phenotype and cerebral deficits. An understanding of these pathways and their contribution to significant neuronal loss in CamKII-Dars2 deficient mice may aid in deciphering mechanisms of LBSL pathology.

Keywords: DARS2; LBSL; Leukodystrophy; Leukoencephalopathy; Mitochondria; tRNA synthetase.


Conflict of interest statement

Declaration of Competing Interest AF is a paid drug safety monitoring board member for Bluebird Bio, Stealth Biotherapeutics, and a paid consultant to Calico Labs.

Figures
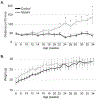
Figure 1:
Figure 1:
(A) Control and CamKII-Dars2 (mutant mice; n = 12 each group) were assessed in a 10-minute open-field every two weeks beginning at PND50. By 22 weeks of age, mutant mice show increased activity over 10 minutes and this pattern continues until testing was ceased at 34 weeks (p < 0.05). (B) Control and mutant body mass was measured every week beginning at 8 weeks of age and CamKII-Dars2 mice show increased body mass compared to control mice for most of life (main effect of genotype, p < 0.05).
Figure 2:
Figure 2:
(A) T2 weighted MRIs were taken of a subset of control and CamKII-Dars2 mice at approximately six and nine months of age (control 6 month n = 5, 9 month, n = 2; mutant mice 6 month n = 3, 9 month n = 5). (B) Quantification of brain area reveals reductions of total area by six months of age which progresses by nine months of age (main effect of genotype, p < 0.05). (C) Photograph images of saline perfused brains are shown.
Figure 3:
Figure 3:
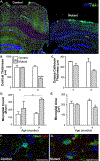
(A) Histological staining of control and CamKII-Dars2 (mutant) mice are shown with microglial cells stained with IBA1 (green) and nuclei with DAPI (blue). (B) Quantification of cortical thickness reveals significant reductions of midline thickness at nine months of age (p < 0.05). (C) Corpus callosum thickness also shows reductions by nine months of age (main effect of genotype; p = 0.08). (D) Count of IBA1+ microglial cells within the cortex shows upregulations at both five and nine months of age (main effect of age, p < 0.05). (E) The average area of individual microglial cells is reduced by nine months of age, signifying reduced processes and an activated state (p < 0.05). (F) Histological staining of control and mutant (G) IBA1+ microglia (green) stained with CD68 (red), a marker of microglial activation. Histology was assessed in 9 month old mice from behavior study (n = 12 for each); 5 month old control (n = 4) and mutant (n = 6 mice) were added for comparison. Scale bar indicates 20 μm.
Figure 4:
Figure 4:
(A) Fluromyelin Red staining of control and mutant corpus callosum shows more dense myelin in mutant samples; quantification in B. Scale bar represents 500 μm. Electron microscopy of control (C,E; n = 4) and CamKII-Dars2 (D,F; mutant, n = 3) mice was done at nine months of age when significant behavioral and morphological changes are evident. Quantification within the corpus callosum shows increased myelin thickness in mutant mice (G; p < 0.05) as well as increased axonal area (H; p < 0.05). Although mitochondrial area was not different (I; p > 0.05), the average number of mitochondria per axon were increased in mutant mice compared to littermate controls (J; p < 0.05).
Figure 5:
Figure 5:
Evaluation of differentially expressed genes show numerous altered pathways in the GO biological process domain GO terms and their associated adjusted p-value are shown.
Figure 6:
Figure 6:
Upregulated genes as measured by RNAseq were confirmed in a separate cohort of 9-month old mice using RT-PCR (n = 4 each group). At this time point, increases were confirmed for Cst7 (A; 9.92-fold increase, p < 0.01), Ctsc (B; 2.92-fold increase, p < 0.01). MhcII (C; 3.46-fold increase, p < 0.05), Iba1 (D; 2.43-fold increase, p < 0.01) and Cd68 (E; 3.94-fold increase, p < 0.01).

References

    1. Agnew T, Goldsworthy M, Aguilar C, Morgan A, Simon M, Hilton H, Esapa C, Wu Y, Cater H, Bentley L, Scudamore C, Poulton J, Morten KJ, Thompson K, He L, Brown SDM, Taylor RW, Bowl MR, Cox RD, 2018. A Wars2 Mutant Mouse Model Displays OXPHOS Deficiencies and Activation of Tissue-Specific Stress Response Pathways. Cell Rep. 25, 3315–3328.e6. 10.1016/j.celrep.2018.11.080 - DOI - PMC - PubMed
    1. Aradjanski M, Dogan SA, Lotter S, Wang S, Hermans S, Wibom R, Rugarli E, Trifunovic A, 2017. DARS2 protects against neuroinflammation and apoptotic neuronal loss, but is dispensable for myelin producing cells. Hum.Mol.Genet. 0, 1–9. 10.1093/hmg/ddx307 - DOI - PubMed
    1. Bader V, Winklhofer KF, 2019. Mitochondria at the interface between neurodegeneration and neuroinflammation. Semin. Cell Dev. Biol. 10.1016/j.semcdb.2019.05.028 - DOI - PubMed
    1. Burgess-Beusse BL, Darlington GJ, 1998. C/EBPa Is Critical for the Neonatal Acute-Phase Response to Inflammation. Mol Cell Biol 18, 7269–7277. 10.1128/MCB.18.12.7269 - DOI - PMC - PubMed
    1. Cassiani-Ingoni R, Coksaygan T, Xue H, Reichert-Scrivner SA, Wiendl H, Rao MS, Magnus T, 2006. Cytoplasmic translocation of Olig2 in adult glial progenitors marks the generation of reactive astrocytes following autoimmune inflammation. Exp. Neurol. 201, 349–358. 10.1016/j.expneurol.2006.04.030 - DOI - PubMed

Publication types

MeSH terms

Substances