. 2020 Jan 24;23(1):100769.
doi: 10.1016/j.isci.2019.100769. Epub 2019 Dec 12.

BacPipe: A Rapid, User-Friendly Whole-Genome Sequencing Pipeline for Clinical Diagnostic Bacteriology

Affiliations

BacPipe: A Rapid, User-Friendly Whole-Genome Sequencing Pipeline for Clinical Diagnostic Bacteriology

Basil B Xavier et al. iScience. .

Abstract

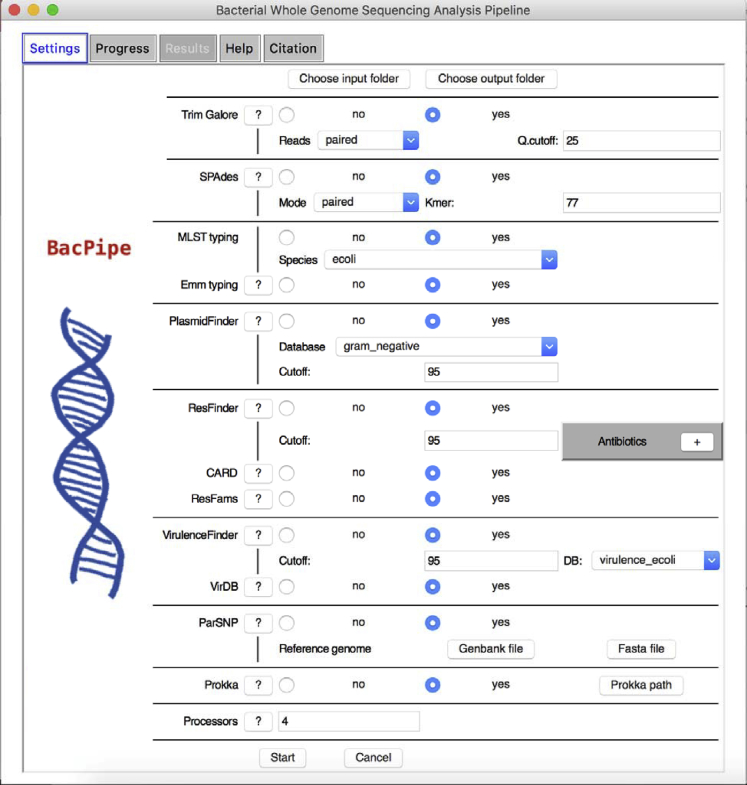
Despite rapid advances in whole genome sequencing (WGS) technologies, their integration into routine microbiological diagnostics has been hampered by the lack of standardized downstream bioinformatics analysis. We developed a comprehensive and computationally low-resource bioinformatics pipeline (BacPipe) enabling direct analyses of bacterial whole-genome sequences (raw reads or contigs) obtained from second- or third-generation sequencing technologies. A graphical user interface was developed to visualize real-time progression of the analysis. The scalability and speed of BacPipe in handling large datasets was demonstrated using 4,139 Illumina paired-end sequence files of publicly available bacterial genomes (2.9-5.4 Mb) from the European Nucleotide Archive. BacPipe is integrated in EBI-SELECTA, a project-specific portal (H2020-COMPARE), and is available as an independent docker image that can be used across Windows- and Unix-based systems. BacPipe offers a fully automated "one-stop" bacterial WGS analysis pipeline to overcome the major hurdle of WGS data analysis in hospitals and public-health and for infection control monitoring.

Keywords: Biological Sciences Research Methodologies; Microbiology; Sequence Analysis.


Conflict of interest statement

Declaration of Interests None declared.

Figures

None
Graphical abstract
Figure 1
Figure 1
The Workflow of BacPipe Complete overview of NGS workflow and analysis performed within BacPipe.
Figure 2
Figure 2
Snapshot of BacPipe BacPipe graphical user interface (GUI). See also Figure S1.
Figure 3
Figure 3
BacPipe Running Time Impact of different genome sizes at equal sequencing coverage (70-fold) on the computational time taken for each analysis step in BacPipe (A). Impact of varying sequencing coverage of an E. coli genome on the computational time taken for each analysis step in BacPipe (B).
Figure 4
Figure 4
Large Scale Validation of BacPipe BacPipe running time (on average 50 min/run) over 4,000 paired-end sequence reads of bacterial genomes. This process was performed on the EBI high-performance computing platform is an EBI shared facility made up of 130 nodes with 130Gb of RAM each and 2 core per node with 40 CPUs (See also Figures S2 and S3 and Table S1).
Figure 5
Figure 5
Comparison of Phylogenetic Analysis Phylogenetic maximum likelihood tree generated from core-genome SNPs generated through BacPipe and visualized by TreeView tool (A) and from Sabat et al. (Sabat et al., 2017) (B). The scale bar indicates the evolutionary distance between the sequences determined by 0.1 substitutions per nucleotide at the variable positions. See also Data S1.
Figure 6
Figure 6
Comparison of Phylogenetic Analysis Phylogenetic maximum likelihood tree generated through BacPipe and visualized by TreeView tool (A). Putative map of K. pneumoniae transmission during outbreak reproduced from Snitkin et al. (Snitkin et al., 2012). Nodes represent patients, and arrows indicate a transmission event directly or indirectly from one patient to another (B). See also Data S1.
Figure 7
Figure 7
Comparison of Phylogenetic Analysis Phylogenetic maximum likelihood tree of C. difficile generated through BacPipe and visualized by TreeView tool (A) and tree reconstructed from multimapping files via Bayesian evolutionary analysis by BEAST from Jia et al. (Jia et al., 2016) (B). See also Data S1.
Figure 8
Figure 8
Comparison of Phylogenetic Analysis Phylogenetic maximum likelihood tree of M. tuberculosis core-genome SNPs generated through BacPipe and visualized by TreeView tool (A) and a minimum spanning tree of concatenated sequences of the 322 SNPs of the same data from Kohl et al (Kohl et al., 2014) (B). See also Data S1.
Figure 9
Figure 9
Comparison of Phylogenetic Analysis Maximum-likelihood tree of S. enteritidis produced by SNP analysis showing outbreak clusters and time frame (month[s] and year) and the State from where each isolate originated. The phylogenetic analysis generated through BacPipe and visualized by TreeView tool (A) and tree reproduced from Taylor et al. (Taylor et al., 2015) (B). See also Data S1.

References

    1. Afgan E., Sloggett C., Goonasekera N., Makunin I., Benson D., Crowe M., Gladman S., Kowsar Y., Pheasant M., Horst R. Genomics virtual laboratory: a practical bioinformatics workbench for the cloud. PLoS One. 2015;10:e0140829. - PMC - PubMed
    1. Akgün M., Bayrak A.O., Ozer B., Sağıroğlu M.Ş. Privacy preserving processing of genomic data: a survey. J. Biomed. Inform. 2015;56:103–111. - PubMed
    1. Arnold C. Outbreak breakthrough: using whole-genome sequencing to control hospital infection. Environ. Health Perspect. 2015;123:A281–A286. - PMC - PubMed
    1. Bertels F., Silander O.K., Pachkov M., Rainey P.B., van Nimwegen E. Automated reconstruction of whole-genome phylogenies from short-sequence reads. Mol. Biol. Evol. 2014;31:1077–1088. - PMC - PubMed
    1. Chen L., Zheng D., Liu B., Yang J., Jin Q. VFDB 2016: hierarchical and refined dataset for big data analysis—10 years on. Nucleic Acids Res. 2016;44:D694–D697. - PMC - PubMed

LinkOut - more resources