. 2020 Jan 24;23(1):100759.
doi: 10.1016/j.isci.2019.100759. Epub 2019 Dec 11.

Human Plasma-like Medium Improves T Lymphocyte Activation

Affiliations

Human Plasma-like Medium Improves T Lymphocyte Activation

Michael A Leney-Greene et al. iScience. .

Abstract

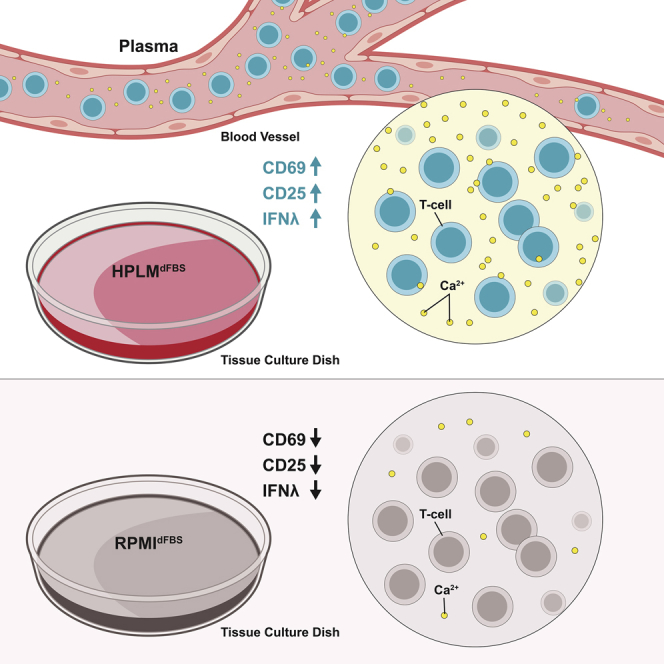
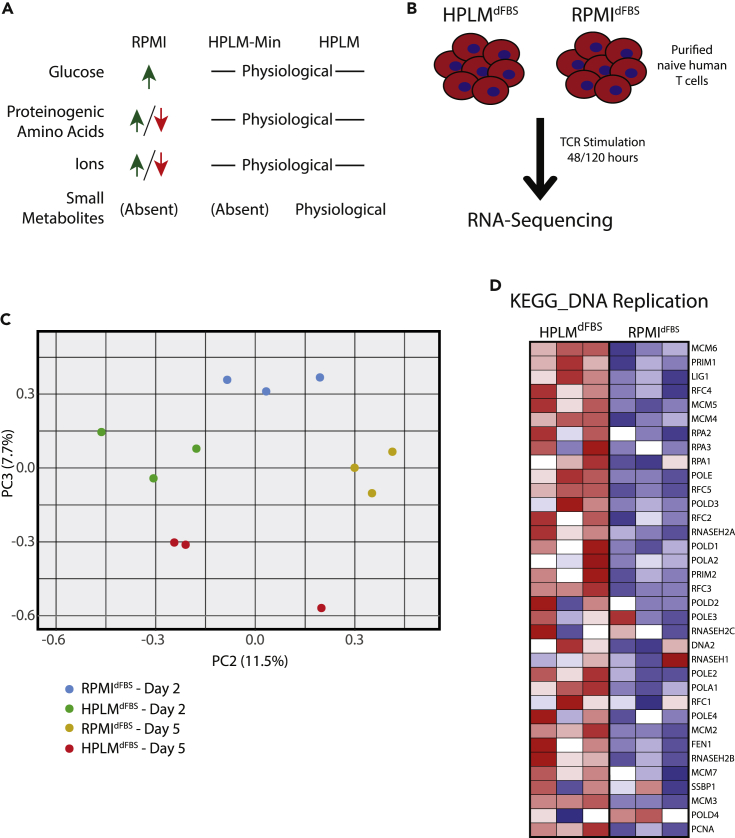
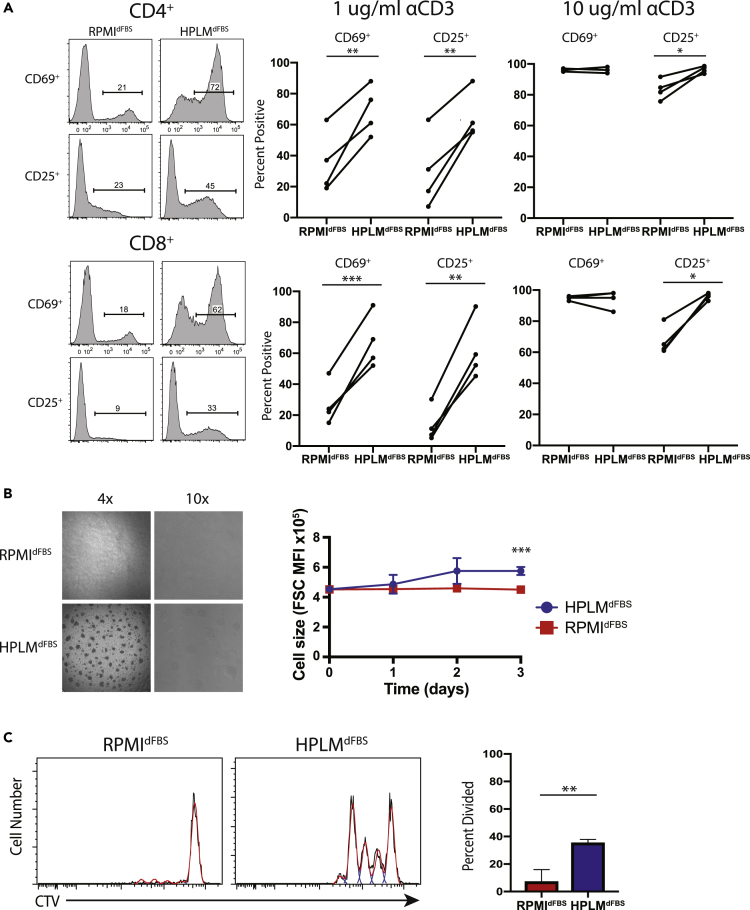
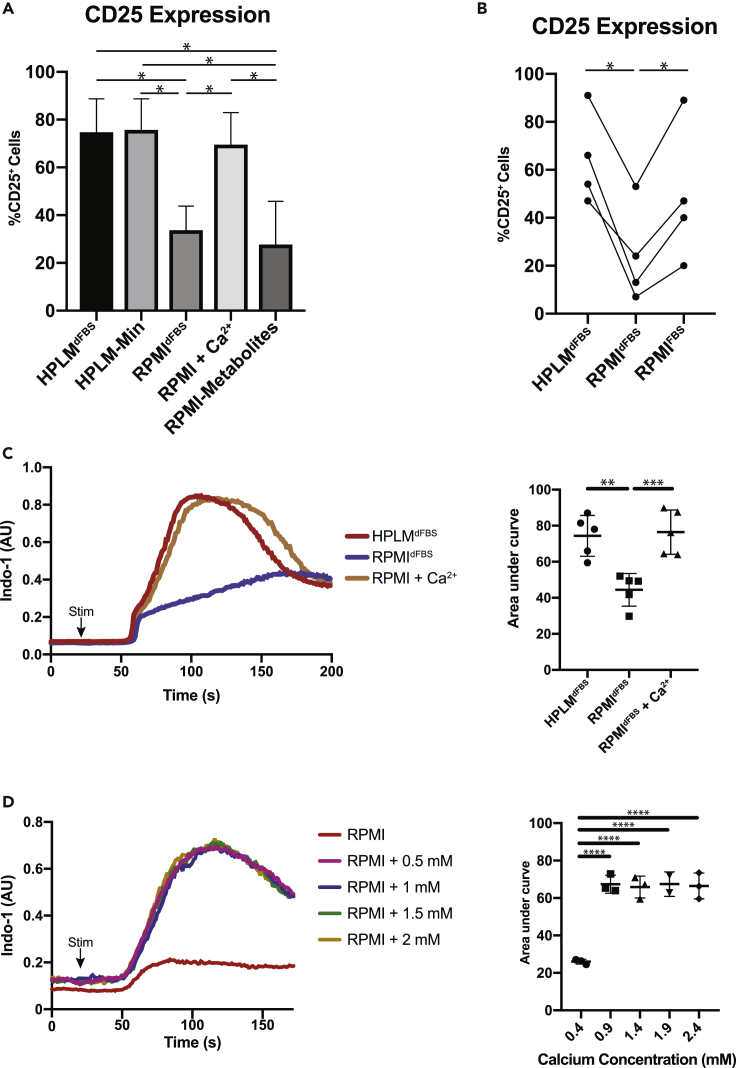
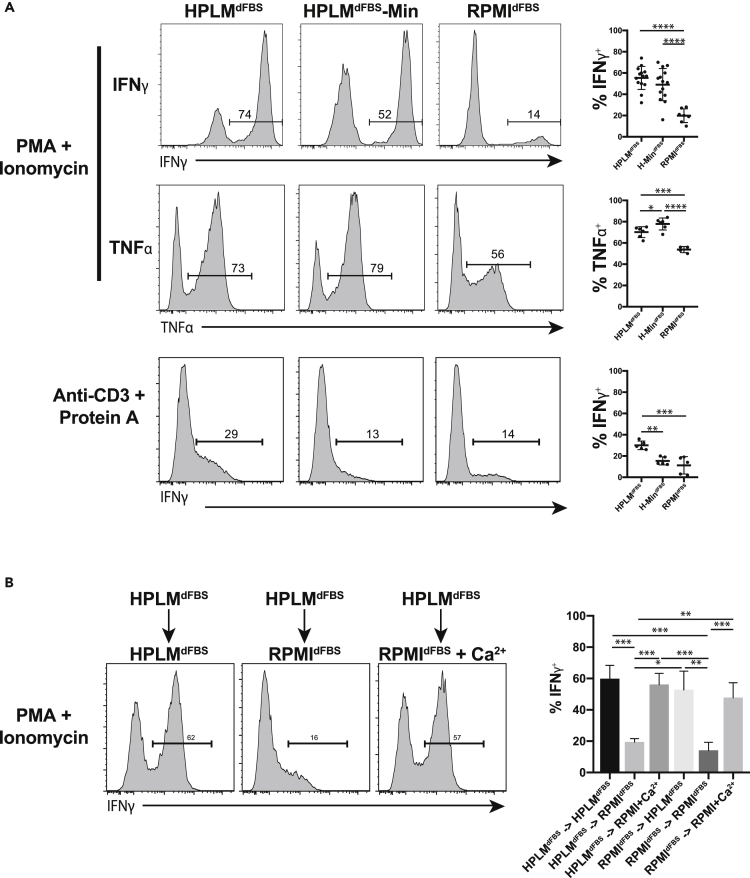
T lymphocytes are critical for effective immunity, and the ability to study their behavior in vitro can facilitate major insights into their development, function, and fate. However, the composition of human plasma differs from conventional media, and we hypothesized that such differences could impact immune cell physiology. Here, we showed that relative to the medium typically used to culture lymphocytes (RPMI), a physiologic medium (human plasma-like medium; HPLM) induced markedly different transcriptional responses in human primary T cells and in addition, improved their activation upon antigen stimulation. We found that this medium-dependent effect on T cell activation is linked to Ca2+, which is six-fold higher in HPLM than in RPMI. Thus, a medium that more closely resembles human plasma has striking effects on T cell biology, further demonstrates that medium composition can profoundly affect experimental results, and broadly suggests that physiologic media may offer a valuable way to study cultured immune cells.

Keywords: Biological Sciences; Immunological Methods; Immunology.


Conflict of interest statement

Declaration of Interests The authors declare no competing interests.

Figures

None
Graphical abstract
Figure 1
Figure 1
Transcriptomic Analysis Reveals Major Differences between Human Lymphocytes Activated in HPLMdFBS Relative to RPMIdFBS (A) Schematic of the comparative compositions of RPMIdFBS, HPLMdFBS, and HPLMdFBS-Min. Detailed composition can be found in Table S1. (B) Experimental outline for T cell activation in either HPLMdFBS or RPMIdFBS and downstream transcriptome analysis. (C) Transcriptional differences between primary naive human mixed CD4+ and CD8+ T cells from three different donors activated in HPLMdFBS or RPMIdFBS as depicted in (B) were measured via RNA-sequencing. These data were used to generate PCA plots showing principal components 2 and 3 at the indicated timepoints. (D) Heatmap showing the Log2(fold change) in transcript abundance for genes involved in the KEGG DNA replication pathway using the RNA-sequencing data generated as described in (B).
Figure 2
Figure 2
Primary Human T Cell Activation Is Superior in HPLMdFBS Compared with RPMIdFBS (A) Flow cytometric measurement of T cell activation markers CD25 and CD69 on purified naive human T cells following stimulation with either 1 or 10 μg of plate-bound anti-CD3 (αCD3)/CD28 in HPLMdFBS or RPMIdFBS for 16 h. Data shown are representative of four different experiments each conducted with cells isolated from a different healthy donor (Student's t test; paired; two-tails; *p < 0.05, **p < 0.01, ***p < 0.001). (B) Bright-field microscopy images of naive T cells stimulated with 1 μg of plate-bound anti-CD3/CD28 in either HPLMdFBS or RPMI for 16 h. (C) Flow cytometry histograms of CellTrace Violet staining of naive T cells stimulated in either HPLMdFBS or RPMIdFBS (left) with quantitation of the fraction of CD4+ T cells that have undergone at least one division (right). Columns represent the mean of three experiments, each done with cells isolated from a different healthy donor (Student's t test; unpaired; two-tails; *p < 0.05). Error bars represent the SEM.
Figure 3
Figure 3
RPMIdFBS Is Severely Hypocalcemic Relative to Human Plasma and HPLMdFBS (A) Measurement of activation marker CD25 on CD4+ T cells comparing RPMIdFBS and HPLMdFBS-min supplemented with various metabolite components unique to HPLMdFBS. Columns represent the mean with error bars showing the standard error (one-way ANOVA comparing other conditions to HPLMdFBS with p values calculated by Dunnett test; *p < 0.05). (B) Measurement of activation marker CD25 on CD4+ T cells activated in HPLMdFBS, RPMIdFBS, or RPMIcFBS. Experiment was repeated four times with each repeat using a different healthy human donor (one-way ANOVA; Tukey's test; *p < 0.05). (C) Flow cytometric plots of calcium flux following primary stimulation of isolated human CD8+ T lymphocytes in either RPMIdFBS or HPLMdFBS (left) as well as quantification of the area under the curve (right). Quantification shows data from five experiments each done with a different individual donor, and error bars show standard error (one-way ANOVA; Tukey's test; **p < 0.01, ***p < 0.001). (D) Flow cytometric plots of calcium flux following primary stimulation of isolated human CD8+ T lymphocytes in RPMIdFBS supplemented with the indicated concentrations of calcium chloride. Quantification shows data from five experiments each done with a different individual donor, and error bars show standard error (one-way ANOVA; Tukey's test; **p < 0.01, ***p < 0.001).
Figure 4
Figure 4
T Cells Activated in HPLMdFBS Produce Higher Levels of Effector Cytokines (A) Levels of cytokines produced in primary human T lymphocytes following restimulation after being expanded in the indicated medium. T lymphocytes from 5 to 14 individuals were tested across two to three experiments, with the error bars representing standard deviation (one-way ANOVA; Tukey's test; *p < 0.05, **p < 0.01, ***p < 0.001, ****p < 0.0001). (B) Quantification of cytokine production in primary human T lymphocytes expanded in the indicated medium, switched to fresh medium of the indicated type, and then restimulated. Columns represent the mean of measurements from three experiments each with two individuals, with the error bars representing the standard error (one-way ANOVA; Tukey's test; *p < 0.05, **p < 0.01, ***p < 0.001).
Figure 5
Figure 5
Lentiviral Transduction Rates Are Equivalent in T Cells Cultured in HPLMdFBS and Conventional Culture Media (A) Quantification of levels of activation markers in CD4+ (left panel) and CD8+ T cells following activation in the indicated medium. Columns represent the mean of measurements from three experiments each conducted with cells from a different individual, with error bars representing the standard error (one-way ANOVA; Tukey's test; *p < 0.05, **p < 0.01). (B) Quantification of transduction efficiency human CD4+ (left panel) and CD8+ T cells (right panel) with CD19-CAR expressing lentiviruses activated in the indicated media. Columns represent the mean of measurements from three experiments each conducted with cells from a different individual, with error bars representing the standard error (one-way ANOVA; Tukey's test).

References

    1. Berod L., Friedrich C., Nandan A., Freitag J., Hagemann S., Harmrolfs K., Sandouk A., Hesse C., Castro C.N., Bähre H. De novo fatty acid synthesis controls the fate between regulatory T and T helper 17 cells. Nat. Med. 2014;20:1327–1333. - PubMed
    1. Bertin S., Aoki-Nonaka Y., de Jong P.R., Nohara L.L., Xu H., Stanwood S.R., Srikanth S., Lee J., To K. The ion channel TRPV1 regulates the activation and proinflammatory properties of CD4+ T cells. Nat. Immunol. 2014;15:1055–1063. - PMC - PubMed
    1. Buck M.D., Sowell R.T., Kaech S.M., Pearce E.L. Metabolic instruction of immunity. Cell. 2017;169:570–586. - PMC - PubMed
    1. Buck M.D., O’Sullivan D., Pearce E.L. T cell metabolism drives immunity. J. Exp. Med. 2015;212:1345–1360. - PMC - PubMed
    1. Cantor J.R., Abu-Remaileh M., Kanarek N., Freinkman E., Gao X., Louissaint A., Jr., Lewis C.A., Sabatini D.M. Physiologic medium rewires cellular metabolism and reveals uric acid as an endogenous inhibitor of UMP synthase. Cell. 2017;169:258–272.e17. - PMC - PubMed