. 2019 Dec 26;21(1):190.
doi: 10.3390/ijms21010190.

Ipragliflozin Ameliorates Endoplasmic Reticulum Stress and Apoptosis through Preventing Ectopic Lipid Deposition in Renal Tubules

Affiliations

Ipragliflozin Ameliorates Endoplasmic Reticulum Stress and Apoptosis through Preventing Ectopic Lipid Deposition in Renal Tubules

Kohshiro Hosokawa et al. Int J Mol Sci. .

Abstract

Background: Chronic kidney disease (CKD) and non-alcoholic steatohepatitis (NASH) are major health burdens closely related to metabolic syndrome. A link between CKD and NASH has been assumed; however, the underlying mechanism is still unknown. Ectopic lipid deposition (ELD) in the hepatocyte results in endoplasmic reticulum (ER) stress, which plays an important role in the development of steatohepatitis. ELD is also assumed to play a role in the development of kidney injury. We aimed to investigate the role of ELD and ER stress in the development of CKD, and evaluate the efficacy of a sodium glucose cotransporter-2 inhibitor, ipragliflozin.

Methods: Male FLS-ob/ob mice that closely imitate the pathophysiology of NASH were treated with vehicle or ipragliflozin. Metabolic characteristics, histology of the kidney, ER stress, and apoptotic signals were evaluated.

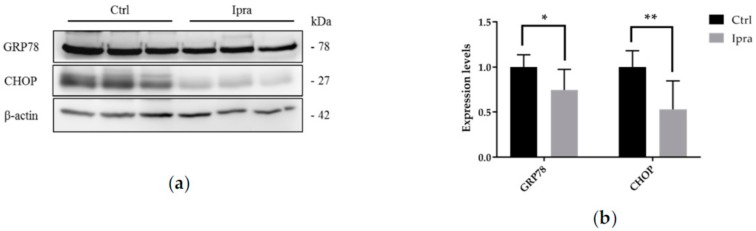
Results: The serum triglyceride was significantly lower in mice treated with ipragliflozin. Ipragliflozin reduced ELD in renal tubules. Ipragliflozin also reduced the expression levels of GRP78 and CHOP, apoptotic cells, and interstitial fibrosis.

Conclusions: ELD induced kidney injury through ER stress. Ipragliflozin improved the pathogenesis of CKD by reducing ELD and ER stress in NASH-model mice. Our results suggest ipragliflozin has therapeutic effect on CKD in NASH.

Keywords: ER stress; NAFLD; NASH; SGLT2 inhibitor; ectopic fat accumulation; lipotoxicity; steatonephropathy.


Conflict of interest statement

The authors declare no conflict of interest.

Figures

Figure 1
Figure 1
Lipid deposition in renal tubule with or without ipragliflozin. Representative images of Periodic acid-Schiff staining on kidneys paraffin-embedded 4-μm-sections from FLS-ob/ob mouse treated with (a) vehicle or (b) ipragliflozin 1 mg/kg. Magnified images from both groups were also shown. Lipid droplets could be observed in renal tubular epithelial cells (arrowheads) from the control mouse kidneys, in contrast with the sparse lipid droplets in the mice treated with ipragliflozin. These results indicated the effect of ipragliflozin on reducing lipid deposition in the renal tubules. (c) Quantification of the amount of lipid droplets. Fractional area of lipid droplets was calculated as the ratio of the total amount of lipid droplets area to the whole tissue area. The quantification is based on randomly captured three fields from six different mice in each group. Bars indicate average ± SEM. * p < 0.05 (unpaired t-test). Ctrl, control group; Ipra, ipragliflozin group.
Figure 2
Figure 2
Effect of ipragliflozin on glomerular size. (a) Representative images of Periodic acid-Schiff staining on FLS-ob/ob mouse kidney paraffin-embedded sections. (b) Quantification of glomerular size. The results were expressed as the Bowman’s capsule area relative to control group. The quantification is based on at least 20 glomeruli from 6 different mice in each group. Bars indicate average ± SEM. * p < 0.05 (unpaired t-test). Ctrl, control group; Ipra, ipragliflozin group.
Figure 3
Figure 3
Effect of ipragliflozin on interstitial fibrosis. (a) Representative images of Masson-trichrome staining on kidney paraffin-embedded sections from FLS-ob/ob mouse in the control group with a high magnification image. (b) Representative image of Masson-trichrome staining on kidney paraffin-embedded sections from FLS-ob/ob mouse in the ipragliflozin group. (c) Quantification of the area of fibrosis. The results were expressed as the percentage of fibrotic area to the whole area. The quantification is based on randomly captured three fields from six different mice in each group. Bars indicate average ± SEM. * p < 0.05 (unpaired t-test). Ctrl, control group; Ipra, ipragliflozin group.
Figure 4
Figure 4
Endoplasmic reticulum stress-associated gene expressions. Relative gene expression levels of Grp78, Perk, Eif2a, Chop, Ire1a, Atf6, and Nfkb1 as quantified by quantitative reverse transcription-polymerase chain reaction (RT-qPCR) in kidney tissues from FLS-ob/ob mouse. Beta-actin was used as an internal control. Levels are expressed relative to control group. Bars indicate average ± SEM. * p < 0.05 (unpaired t-test). Ctrl, control group; Ipra, ipragliflozin group.
Figure 5
Figure 5
Endoplasmic reticulum stress-associated protein expression. (a) Western blot analysis for endoplasmic reticulum-associated proteins on kidney tissues from FLS-ob/ob mouse. Beta-actin is used as a loading control. (b) Quantification of western blot signal intensities, expressed relative to control group. Bars indicate average ± SEM. * p < 0.05; ** p < 0.01 (unpaired t-test). Ctrl, control group; Ipra, ipragliflozin group.
Figure 6
Figure 6
Expressions of lipid-associated protein. (a) Western blot analysis for NFkB, DGAT1, and ATGL on kidney tissues from FLS-ob/ob mouse. Beta-actin is used as a loading control. (b) Quantification of western blot signal intensities, expressed as relative level to control group. Bars indicate average ± SEM. * p < 0.05; ** p < 0.01 (unpaired t-test). Ctrl, control group; Ipra, ipragliflozin group.
Figure 7
Figure 7
Effect of ipragliflozin on renal cellular apoptosis in FLS-ob/ob mice. (a) Representative images of TUNEL staining on FLS-ob/ob mouse kidney paraffin-embedded sections. (b) Quantification of apoptotic cells. The percentage of TUNEL positive cells to DAPI positive cells was expressed as relative level to control group. The quantification is based on randomly captured three fields from six different mice in each group. Bars indicate average ± SEM. * p < 0.05 (unpaired t-test). TUNEL, terminal deoxynucleotidyl transferase dUTP nick end labeling; DAPI, 4′,6-diamidino-2-phenylindole; Ctrl, control group; Ipra, ipragliflozin group.

Similar articles

Cited by

References

    1. Go A.S., Chertow G.M., Fan N., McCulloch C.E., Hsu C.-Y. Chronic Kidney Disease and the Risks of Death, Cardiovascular Events, and Hospitalization. New Engl. J. Med. 2004;351:1296–1305. doi: 10.1056/NEJMoa041031. - DOI - PubMed
    1. Ceranowicz P., Warzecha Z., Dembinski A. Peptidyl hormones of endocrine cells origin in the gut—Their discovery and physiological relevance. J. Physiol. Pharmacol. 2015;66:11–27. - PubMed
    1. Moellmann J., Klinkhammer B.M., Onstein J., Stöhr R., Jankowski V., Jankowski J., Lebherz C., Tacke F., Marx N., Boor P., et al. Glucagon-Like Peptide 1 and Its Cleavage Products Are Renoprotective in Murine Diabetic Nephropathy. Diabetes. 2018;67:2410–2419. doi: 10.2337/db17-1212. - DOI - PubMed
    1. Guebre-Egziabher F., Alix P.M., Koppe L., Pelletier C.C., Kalbacher E., Fouque D., Soulage C.O. Ectopic lipid accumulation: A potential cause for metabolic disturbances and a contributor to the alteration of kidney function. Biochimie. 2013;95:1971–1979. doi: 10.1016/j.biochi.2013.07.017. - DOI - PubMed
    1. Tsuboi N., Okabayashi Y., Shimizu A., Yokoo T. The Renal Pathology of Obesity. Kidney Int. Rep. 2017;2:251–260. doi: 10.1016/j.ekir.2017.01.007. - DOI - PMC - PubMed

MeSH terms