. 2019 Dec 16;8(12):2226.
doi: 10.3390/jcm8122226.

Variants in Miro1 Cause Alterations of ER-Mitochondria Contact Sites in Fibroblasts from Parkinson's Disease Patients

Affiliations

Variants in Miro1 Cause Alterations of ER-Mitochondria Contact Sites in Fibroblasts from Parkinson's Disease Patients

Clara Berenguer-Escuder et al. J Clin Med. .

Abstract

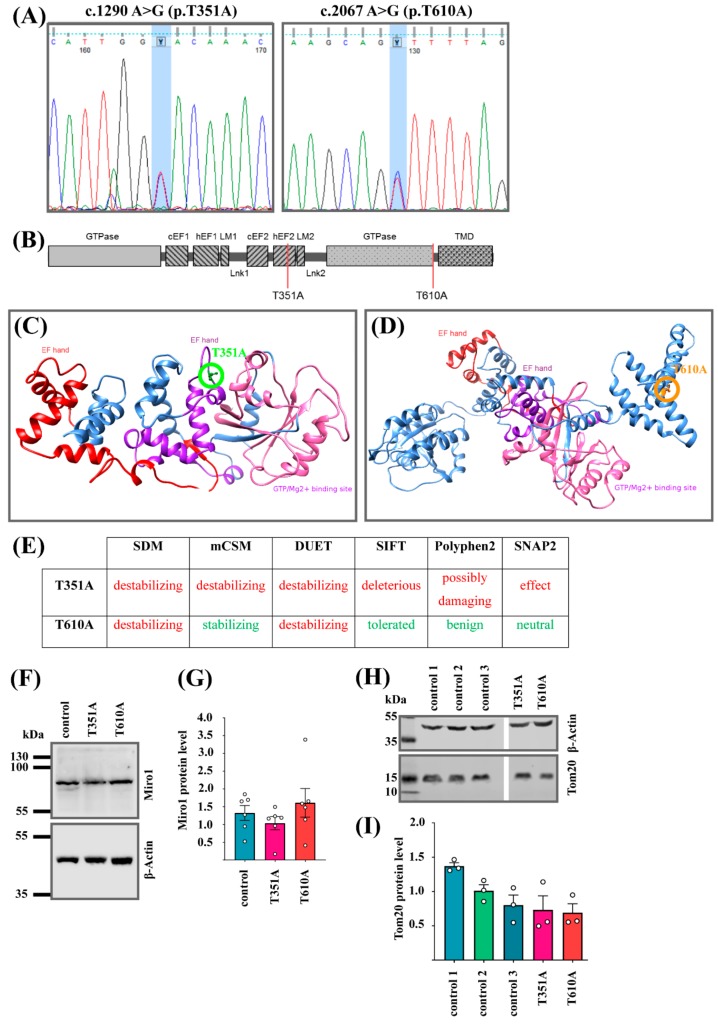
Background: Although most cases of Parkinson´s disease (PD) are idiopathic with unknown cause, an increasing number of genes and genetic risk factors have been discovered that play a role in PD pathogenesis. Many of the PD-associated proteins are involved in mitochondrial quality control, e.g., PINK1, Parkin, and LRRK2, which were recently identified as regulators of mitochondrial-endoplasmic reticulum (ER) contact sites (MERCs) linking mitochondrial homeostasis to intracellular calcium handling. In this context, Miro1 is increasingly recognized to play a role in PD pathology. Recently, we identified the first PD patients carrying mutations in RHOT1, the gene coding for Miro1. Here, we describe two novel RHOT1 mutations identified in two PD patients and the characterization of the cellular phenotypes.

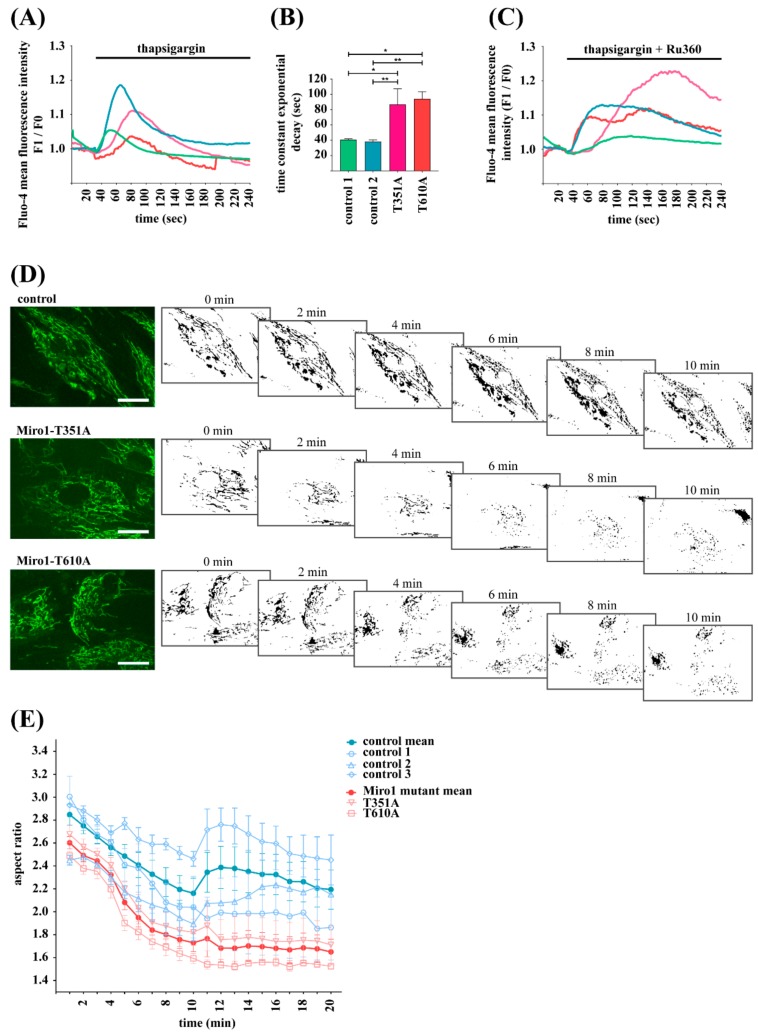
Methods: Using whole exome sequencing we identified two PD patients carrying heterozygous mutations leading to the amino acid exchanges T351A and T610A in Miro1. We analyzed calcium homeostasis and MERCs in detail by live cell imaging and immunocytochemistry in patient-derived fibroblasts.

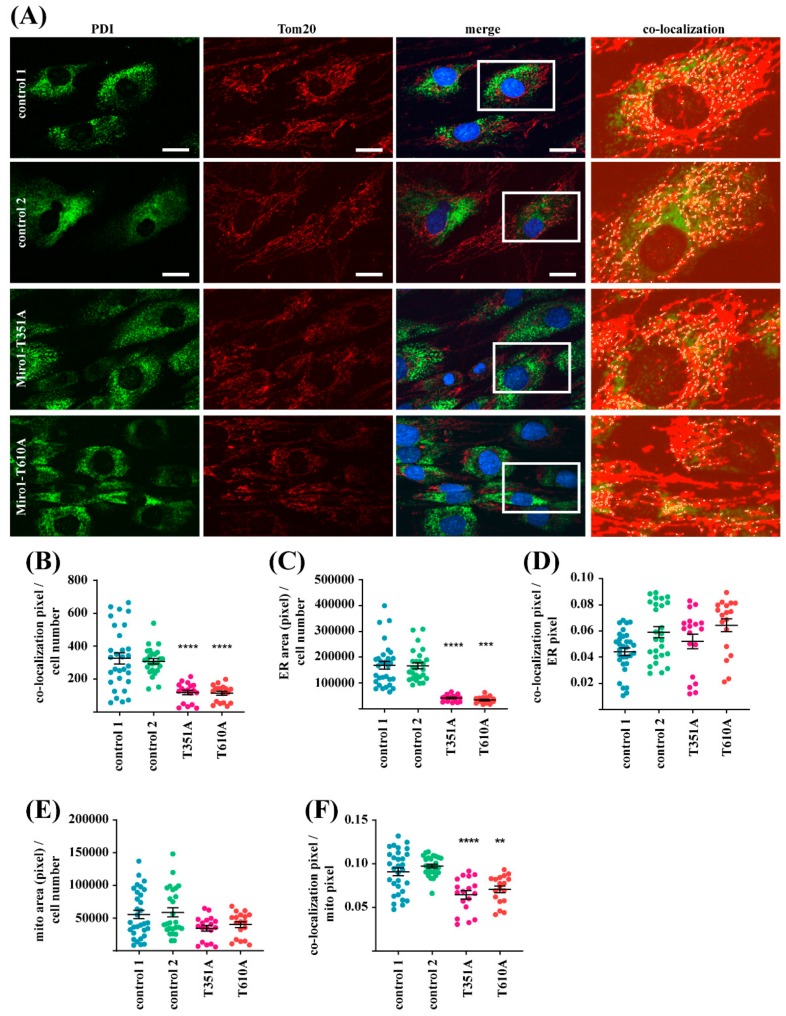
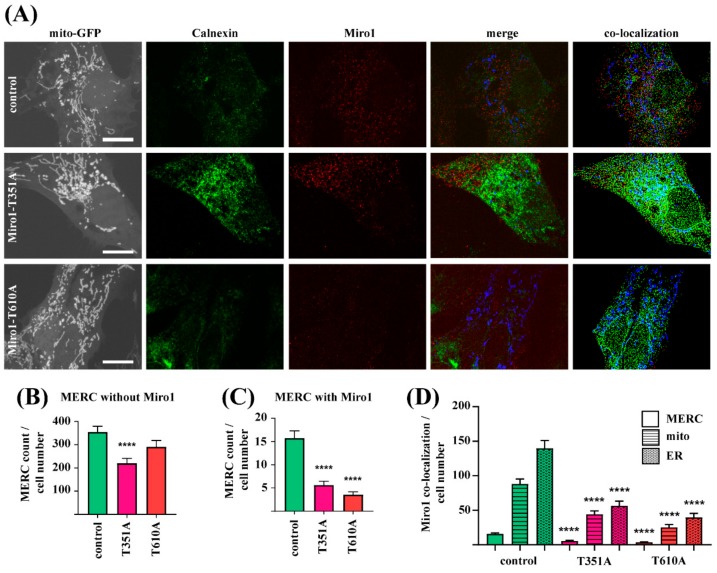
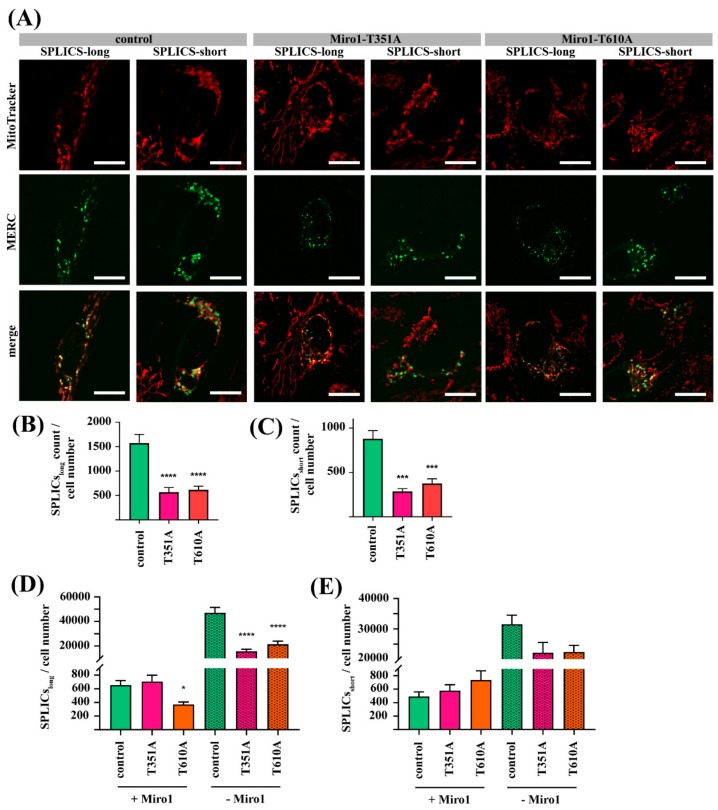
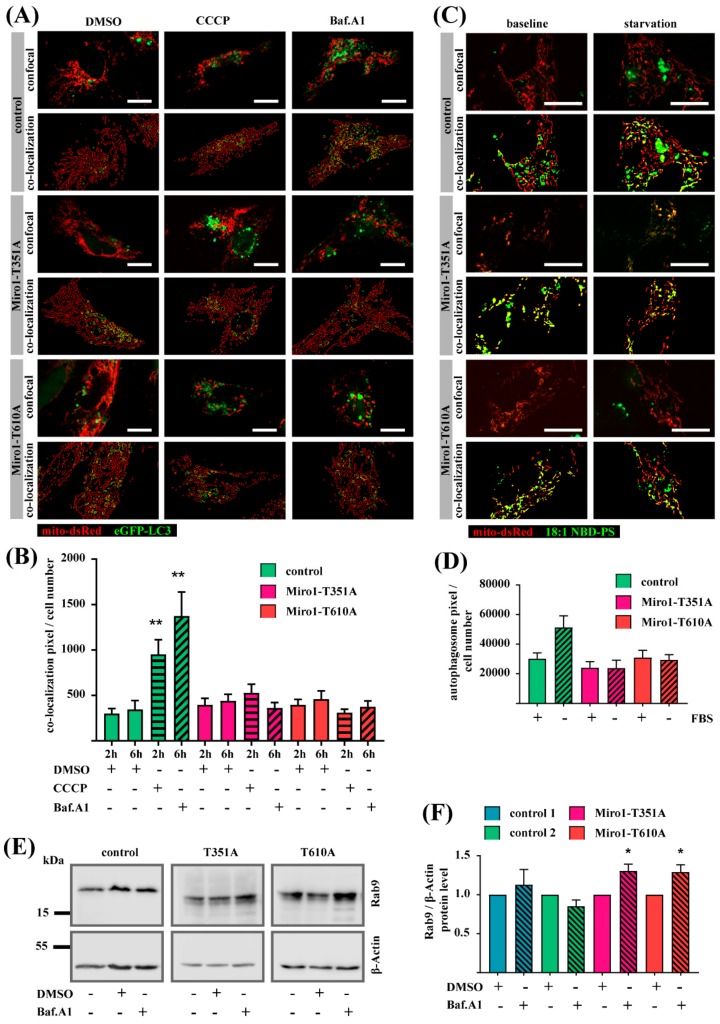
Results: We show that fibroblasts expressing mutant T351A or T610A Miro1 display impaired calcium homeostasis and a reduced amount of MERCs. All fibroblast lines from patients with pathogenic variants in Miro1, revealed alterations of the structure of MERCs.

Conclusion: Our data suggest that Miro1 is important for the regulation of the structure and function of MERCs. Moreover, our study supports the role of MERCs in the pathogenesis of PD and further establishes variants in RHOT1 as rare genetic risk factors for neurodegeneration.

Keywords: Miro1; Parkinson´s disease; mitochondria-ER contact sites.


Conflict of interest statement

The authors declare no conflict of interest.

Figures

Figure 1
Figure 1
(A) Sanger sequencing result for the mutations c.1290A > G and c.2067A > G (NM_001033568), leading to the amino acid exchanges T351A or T610A (NP_001028740), respectively. (B) Schematic overview of Miro1 protein structure, showing the two newly identified mutations in Miro1: T351A is located within the second EF-hand domain and T610A within the C-terminus. (C) Homology model of human Miro1 based on the 3D structure of Drosophila Miro. The 3D structure shows both EF-hand domains, the C-terminal GTPase domain and the C-terminus. The amino acid T351 is highlighted with a green circle, (D) while the amino acid position T610 is highlighted with an orange circle. (E) Overview of the mutation effects on protein stability and functionality as predicted by SDM, mCSB, DUET, SIFT, Polyphen2, and SNAP2. (Red is “destabilizing”, “deleterious” or “possibly damaging”; Green is “stabilizing”, “tolerated” or “benign”. As indicated in the table.) (F) Representative Western blot image of Miro1 protein in immortalized fibroblasts with the mutations Miro1-T351A or Miro1-T610A. (G) Densitometry of Western blot analysis from (F) for Miro1 protein levels normalized to β-Actin. Data indicated as mean ± SEM (n = 6). (H) Representative Western blot image of Tom20 protein in immortalized fibroblasts. (I) Densitometry of Western blot analysis of Tom20 protein levels normalized to β-Actin. Data indicated as mean ± SEM (n = 3).
Figure 2
Figure 2
(A) Immortalized fibroblasts were loaded with the cytosolic calcium indicator Fluo-4 AM for live cell imaging. During imaging, cells were treated with 1 µM thapsigargin in order to inhibit calcium uptake by the SERCA pumps and to deplete endoplasmic reticulum (ER) calcium stores. Imaging was continued for 10 min with a 2 s interval. Images were obtained with a 25× objective. Data indicate the fluorescence signal intensity of Fluo-4 AM expressed as mean fluorescence F1/F0. (B) Time constant of the exponential decay calculated from the calcium response curves from (A). The data indicate the time, which is needed to recover from the thapsigargin-induced cytosolic calcium peak shown in (A). Data indicated as mean ± SEM. Significance calculated by Mann-Whitney test (n = 4). * p < 0.05; **: p < 0.001. (C) Immortalized fibroblasts were loaded with Fluo-4 AM for live cell imaging and treated with 1 µM thapsigargin and 10 µM Ru360 in order to inhibit calcium buffering by the ER and by the mitochondrial calcium uniporter (MCU). Cells were imaged for 10 min with a 2 sec interval using a 25× objective. Data is expressed as mean Fluo-4 AM fluorescence intensity F1/F0 (n = 3). (D) Immortalized fibroblasts were stained with MitoTracker green FM for live cell imaging. Images were obtained once per minute using a 40× objective. During imaging, cells were treated with 20 µM ionomycin and mitochondrial morphology was analyzed using ImageJ. Mitochondrial masks from image analysis are shown for all cell lines at different time points. Scale bars indicate 20 µm. (E) Analysis of mitochondrial fragmentation in different fibroblast lines, expressed as aspect ratio, from images shown in (D); (n = 3–5).
Figure 3
Figure 3
(A) Native fibroblasts were fixed and stained with antibodies against the ER marker protein protein disulfide-isomerase (PDI) and the mitochondrial marker protein Tom20. Images were obtained using a 63× objectives; scale bars indicate 20 µm. The white boxes in the merged images indicate the magnified regions shown in the co-localization panels. Co-localization of PDI and Tom20 signals was analyzed with MatLab. Co-localization events are highlighted as white dots. (B) Quantification of co-localization events of PDI and Tom20 per cell, indicating the amount of mitochondrial-endoplasmic reticulum contact sites (MERCs). (C) Quantification of ER area per cell in pixel from the PDI signal. (D) Quantification of co-localization events of PDI and Tom20 normalized to PDI-positive ER pixel. (E) Quantification of mitochondrial area per cell from the Tom20 signal. (F) Quantification of co-localization events of PDI and Tom20 per mitochondrial area. All data indicated as mean ± SEM. Significance calculated using a Kruskal Wallis test (n = 3; 25 cells analyzed per fibroblast line per experiment). ** p < 0.001; *** p < 0.0001; **** p < 0.00001.
Figure 4
Figure 4
(A) Immortalized fibroblasts were transfected with mito-GFP and fixed 24 h post-transfection for subsequent labeling with antibodies against Miro1 and the ER marker Calnexin. Images were obtained using a 63× objective; scale bars indicate 20 µm. Co-localization events were analyzed using MatLab. (B) Quantification of MERCs without Miro1 and (C) MERCs with Miro1 per cell from images shown in (A). (D) Quantification of co-localization events of Miro1 puncta with MERCs, mitochondria or the ER per cell. All data indicated as mean ± SEM. Significance calculated with Kruskal-Wallis test (n = 3; ~20 cells analyzed per fibroblast line per experiment). **** p < 0.00001.
Figure 5
Figure 5
(A) Immortalized fibroblasts were transfected either with the SPLICS-long, or with the SPLICS-short construct. After 12 h, cells were stained with MitoTracker deep red FM for live cell imaging, using a 63x objective; scale bars indicate 20 µm. (B) Quantification of wide MERCs (from SPLICS-long signal) and (C) narrow MERCs (from SPLICS-short signal) per cell. Fibroblasts transfected with (D) SPLICS-long or (E) SPLICS-short constructs were fixed and stained with an antibody against Miro1. Afterwards, cells were imaged with a 63× objective and SPLICS signals with and without Miro1 were quantified. All data indicated as mean ± SEM. Significance was assessed using a Kruskal-Wallis test (n = 3; ~16 cells analyzed per fibroblast line per experiment). * p < 0.05; *** p < 0.0001; **** p < 0.00001.
Figure 6
Figure 6
(A) Fibroblasts were transfected with mito-DsRed and eGFP-LC3 and treated with 25 µM CCCP for 2 h or with 10 nM BafilomycinA1 for 6 h. Microscopy images were obtained with a 40× objective. In the co-localization panel, the mitochondria are indicated in green and the LC3 puncta are indicated in red. Co-localization events of mitochondria and LC3 puncta are indicated in yellow. Scale bars indicate 20 µm. (B) Quantification of co-localization events of mitochondria and LC3 puncta from (A) normalized to cell number. Significance was calculated using the Mann-Whitney test (n = 3; ~24 cells analyzed per fibroblast line, per condition and per experiment). (C) Fibroblasts were transfected with mito-DsRed and after 24 h loaded with 18:1 NBD-PS. Fibroblasts were then starved without FBS for 2 h before live cell imaging, using a 63× objective. The co-localization panel shows mitochondria in red and 18:1 NBD-PS signal in green. Co-localization of mitochondria and 18:1 NBD-PS is indicated in yellow. Autophagosomes were identified as 18:1 NBD-PS signal, which did not co-localize with the mito-DsRed signal. (D) Quantification of autophagosomes from microscopy images shown in (C). Significance calculated with Mann-Whitney test (n = 3; 10 cells analyzed per line, condition and per experiment). (E) Western blot image of Rab9 and β-Actin in immortalized fibroblasts. (F) Quantification of relative Rab9 protein levels normalized to β-Actin. Significance calculated by Mann-Whitney test (n = 4–6). All data indicated as mean ± SEM. * p < 0.05; ** p < 0.001.

References

    1. Larsen S.B., Hanss Z., Krüger R. The genetic architecture of mitochondrial dysfunction in Parkinson’s disease. Cell Tissue Res. 2018;373:21–37. doi: 10.1007/s00441-017-2768-8. - DOI - PMC - PubMed
    1. Hsieh C.-H., Shaltouki A., Gonzalez A.E., Bettencourt da Cruz A., Burbulla L.F., St Lawrence E., Schüle B., Krainc D., Palmer T.D., Wang X. Functional Impairment in Miro Degradation and Mitophagy Is a Shared Feature in Familial and Sporadic Parkinson’s Disease. Cell Stem Cell. 2016;19:709–724. doi: 10.1016/j.stem.2016.08.002. - DOI - PMC - PubMed
    1. Lynes E.M., Simmen T. Urban planning of the endoplasmic reticulum (ER): how diverse mechanisms segregate the many functions of the ER. Biochim. Biophys. Acta. 2011;1813:1893–1905. doi: 10.1016/j.bbamcr.2011.06.011. - DOI - PMC - PubMed
    1. Rowland A.A., Voeltz G.K. Endoplasmic reticulum-mitochondria contacts: Function of the junction. Nat. Rev. Mol. Cell Biol. 2012;13:607–625. doi: 10.1038/nrm3440. - DOI - PMC - PubMed
    1. Lee K.-S., Huh S., Lee S., Wu Z., Kim A.-K., Kang H.-Y., Lu B. Altered ER-mitochondria contact impacts mitochondria calcium homeostasis and contributes to neurodegeneration in vivo in disease models. Proc. Natl. Acad. Sci. USA. 2018;115:E8844–E8853. doi: 10.1073/pnas.1721136115. - DOI - PMC - PubMed

LinkOut - more resources