. 2019 Dec 30;19(1):602.
doi: 10.1186/s12870-019-2210-3.

Nitric oxide- induced AtAO3 differentially regulates plant defense and drought tolerance in Arabidopsis thaliana

Affiliations

Nitric oxide- induced AtAO3 differentially regulates plant defense and drought tolerance in Arabidopsis thaliana

Murtaza Khan et al. BMC Plant Biol. .

Abstract

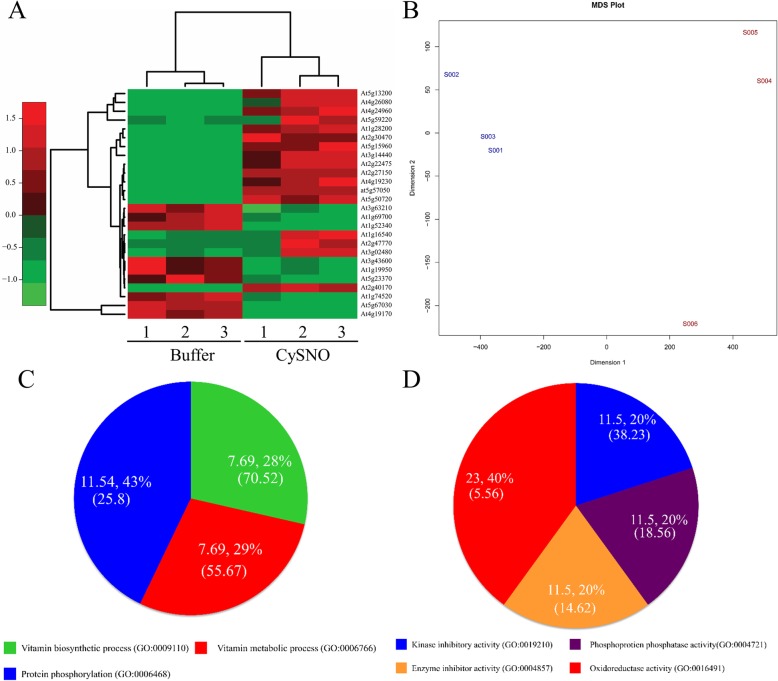
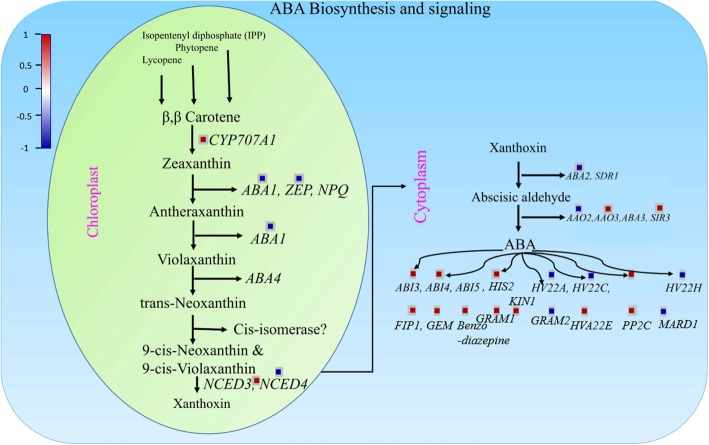
Background: Exposure of plants to different environmental insults instigates significant changes in the cellular redox tone driven in part by promoting the production of reactive nitrogen species. The key player, nitric oxide (NO) is a small gaseous diatomic molecule, well-known for its signaling role during stress. In this study, we focused on abscisic acid (ABA) metabolism-related genes that showed differential expression in response to the NO donor S-nitroso-L-cysteine (CySNO) by conducting RNA-seq-based transcriptomic analysis.

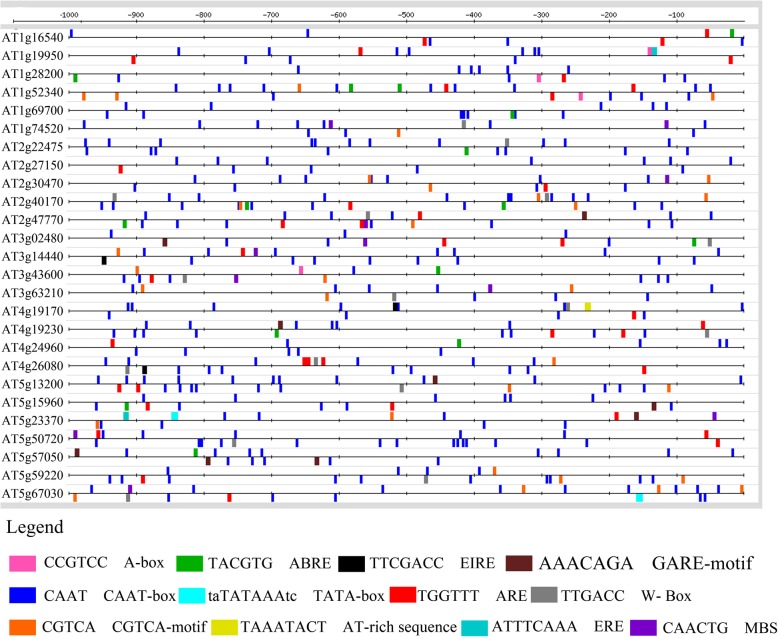
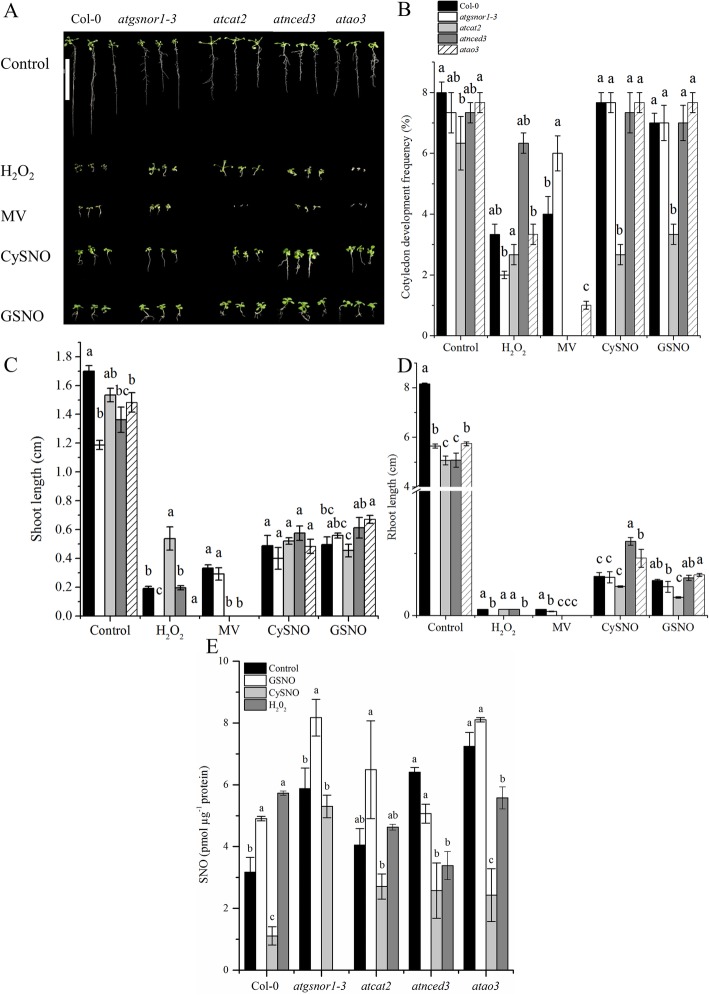
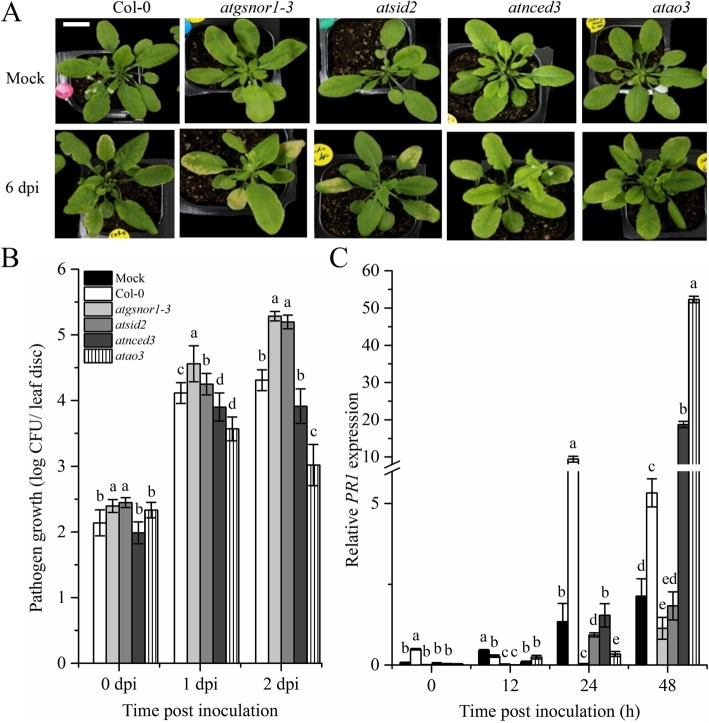
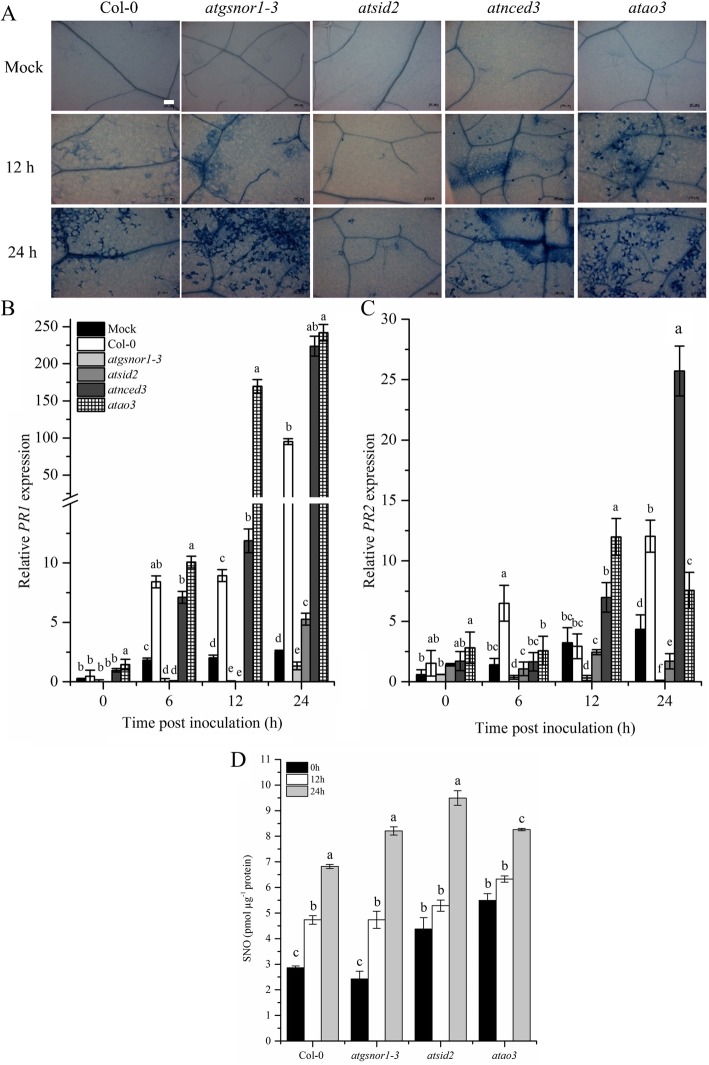
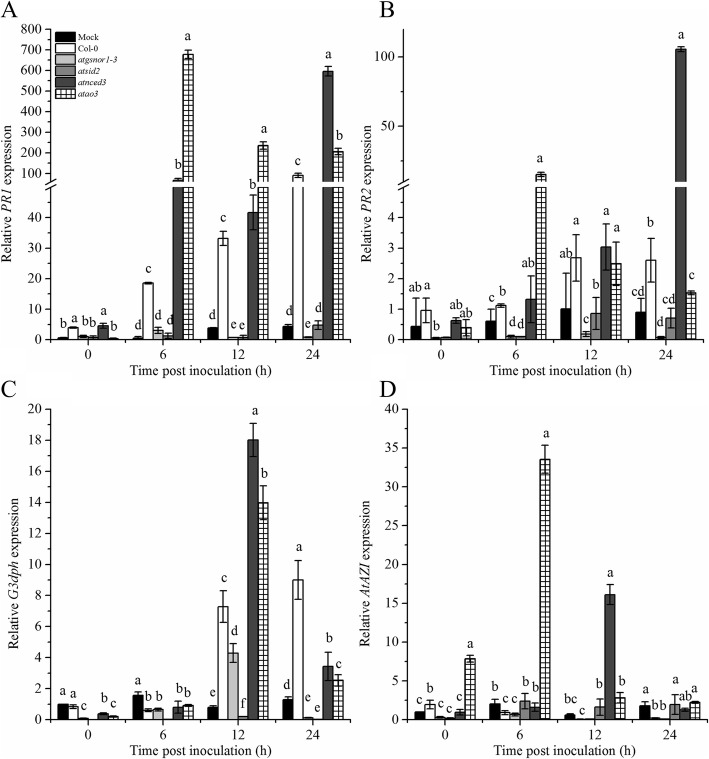
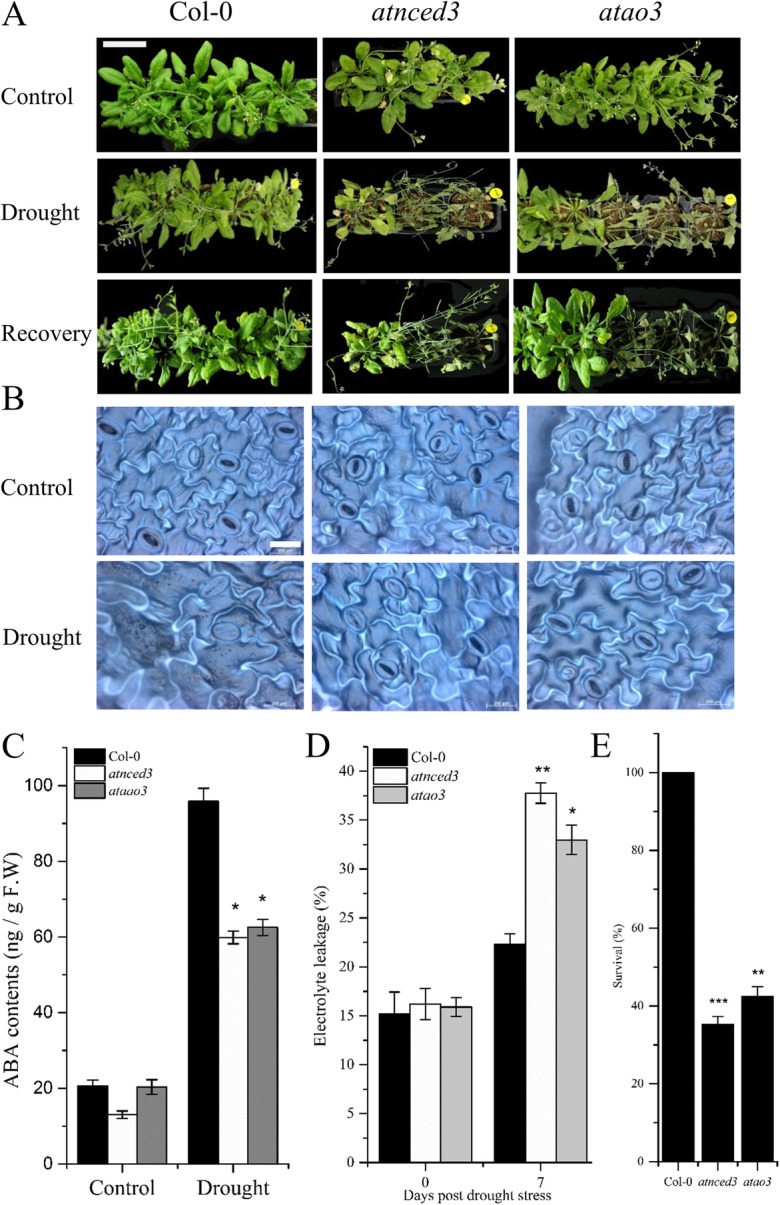
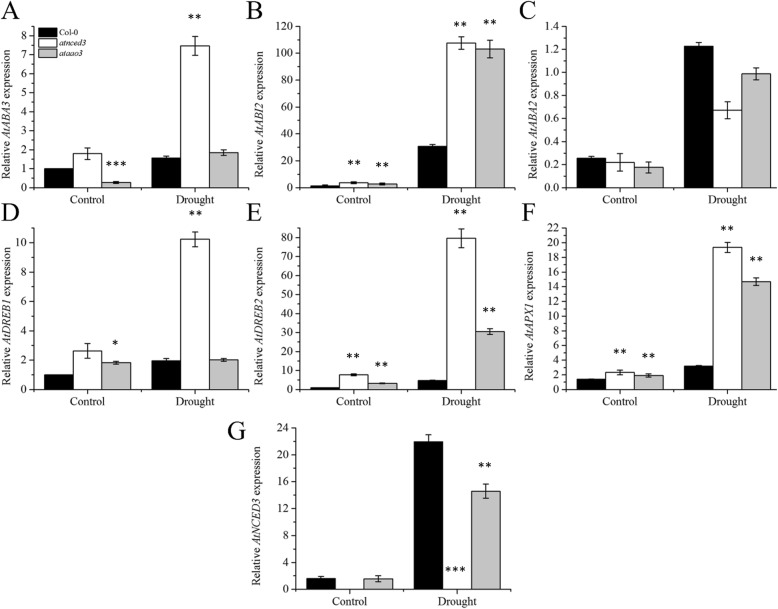
Results: CySNO-induced ABA-related genes were identified and further characterized. Gene ontology terms for biological processes showed most of the genes were associated with protein phosphorylation. Promoter analysis suggested that several cis-regulatory elements were activated under biotic and/or abiotic stress conditions. The ABA biosynthetic gene AtAO3 was selected for validation using functional genomics. The loss of function mutant atao3 was found to differentially regulate oxidative and nitrosative stress. Further investigations for determining the role of AtAO3 in plant defense suggested a negative regulation of plant basal defense and R-gene-mediated resistance. The atao3 plants showed resistance to virulent Pseudomonas syringae pv. tomato strain DC3000 (Pst DC3000) with gradual increase in PR1 gene expression. Similarly, atao3 plants showed increased hypersensitive response (HR) when challenged with Pst DC3000 (avrB). The atgsnor1-3 and atsid2 mutants showed a susceptible phenotype with reduced PR1 transcript accumulation. Drought tolerance assay indicated that atao3 and atnced3 ABA-deficient mutants showed early wilting, followed by plant death. The study of stomatal structure showed that atao3 and atnced3 were unable to close stomata even at 7 days after drought stress. Further, they showed reduced ABA content and increased electrolyte leakage than the wild-type (WT) plants. The quantitative polymerase chain reaction analysis suggested that ABA biosynthesis genes were down-regulated, whereas expression of most of the drought-related genes were up-regulated in atao3 than in WT.

Conclusions: AtAO3 negatively regulates pathogen-induced salicylic acid pathway, although it is required for drought tolerance, despite the fact that ABA production is not totally dependent on AtAO3, and that drought-related genes like DREB2 and ABI2 show response to drought irrespective of ABA content.

Keywords: ABA metabolism genes; Basal defense; Drought stress; Nitrosative stress; R-gene-mediated resistance; RNA-seq analysis; Stomatal regulation.


Conflict of interest statement

The authors declare that they have no competing interests.

Figures

Fig. 1
Fig. 1
CySNO-induced ABA metabolism-related genes. Heatmap showing hierarchical clustering and expression values of differentially expressed ABA metabolism-related genes in RNA-seq-based transcriptome in response to 1 mM CySNO. (B) Multi-dimensional scatter (MDS) plot representing the dispersion in data. (C) GO terms for biological processes. (D) GO terms for molecular processes. The values in percentage represent percentage of genes found in the reference genome, whereas the ones in parentheses represent fold enrichment. The numbers in panel A represents three different replicates for buffer and CySNO treated samples. Similarly in panel B S001 to S003 are control samples whereas S004 to S006 are CySNO treated samples.
Fig. 2
Fig. 2
Promoter analysis of CySNO-induced ABA metabolism-related genes. Promoter sequences of NO-induced ABA-related genes 1 Kb upstream of the transcription initiation site were retrieved from TAIR (https://www.arabidopsis.org/) and analyzed using CARE to identify cis-regulatory elements present in the respective promoters. Selected cis-regulatory elements were then mapped using RSAT (http://rsat.eead.csic.es/plants/index.php).
Fig. 3
Fig. 3
AtAO3 showed differential regulation of shoot and root length under oxidative and nitrosative stress conditions. a Phenotypes of the indicated genotypes. b Cotyledon development frequency after one week under control, H2O2, and MV-mediated oxidative and CysNO- and GSNO-mediated nitrosative stress condition. c Shoot length and d root length of indicated genotypes under control, oxidative, and nitrosative stress conditions. All data points are the means of three replicates with each replicate pooled with 5 plants at least. The background in A was changed for more clarity. The Y-axis in D was interrupted for the better presentation of small values. The white scale bar in A is equal to 4 cm. Significant differences are represented by different letters suggesting differences between means at p ≤ 0.05 (DMRT). The experiment was repeated two times with similar results.
Fig. 4
Fig. 4
AtAO3 negatively regulates basal defense. a Symptom development at 6 dpi. b Pathogen growth from infiltrated leaves. c Relative PR1 expression after attempted virulent Pst DC3000 at 5 × 105 colony forming units (CFU) mL− 1. The data points in panel (b) are the mean of five replicates, whereas those in panel (c) are the mean of three replicates. Background in panel (a) was modified for more clarity and white bar represents scale bar equal to 1 cm. The Y-axis of panel (c) was interrupted to clarify the small values. The experiments were repeated at least three times. Error bars represent ±SE. Different letters represents significant differences between means at p ≤ 0.05 (DMRT).
Fig. 5
Fig. 5
AtAO3 negatively regulates R-gene-mediated resistance. a ataao3 showed induced HR after Pst DC3000 (avrB) inoculation. b and c Relative transcript accumulation of PR1 and PR2 genes analyzed using quantitative real time PCR (qPCR) and (d) SNO measurement after Pst DC3000 (avrB) inoculation. The white small bar in WT mock plant in panel (a) represents scale bar and is equal ot 100 μM. The Y-axis of panel (b) was interrupted to clarify the small values. The expression was normalized against constitutively expressed Actin. Error bars represent ±SE. Different letters represents significant differences between means at p ≤ 0.05 (DMRT).
Fig. 6
Fig. 6
AtAO3 negatively regulates systemic acquired resistance (SAR). Relative transcript accumulation of (a) PR1 gene, (b) PR2 gene, (c) G3DPH, and (d) AZI genes analyzed using quantitative real-time PCR (qPCR) in systemic leaves after Pst DC3000 (avrB) inoculation. The Y-axis of panels (a) and (b) was interrupted to clarify the small values. The expression was normalized against constitutively expressed Actin. Error bars represent ±SE (n = 3). Significant differences are represented by different letters (p ≤ 0.05) calculated by DMRT.
Fig. 7
Fig. 7
AtAO3 is required for drought tolerance. a Phenotypes of the indicated genotypes under control, drought, and recovery stage. b Stomatal structure in the indicated genotypes under control and drought stress. c ABA contents (from fresh samples) in response to drought stress and control conditions. d Electrolyte leakage (%) under control and drought conditions (e) Survival percentage after re-watering the plants for 24 h. The white bar in panel A represents scale bar and is equal to 4 cm while in B is equal ot 200 μM. Error bars represents ±SE. Significant differences are represented by asterisks (Student t-test). * represents p < 0.05, ** represents p < 0.01 and *** represents p ≤ 0.001.
Fig. 8
Fig. 8
Expression of ABA biosynthesis and drought signaling-related genes in the indicated genotypes. Relative expression of a AtABA3, b AtABI2, c AtABA2, d AtDREB1, e AtDREB2, f AtAPX1, and g AtNCED3. The experiments were repeated at least three times. Error bars represent ±SE. Significance differences are represented by asterisks (Student t-test). * represents p < 0.05, ** represents p < 0.01 and *** represents p ≤ 0.001.
Fig. 9
Fig. 9
MapMan analysis showing up- and down-regulated ABA-related genes. Schematic presentation of ABA biosynthesis and signaling during drought conditions. The color key represents a scale of fold change from − 0.5 to 1. Red color represents up-regulated, whereas blue color represents down-regulated ABA-related genes in response to CySNO.

References

    1. Culotta E, Koshland DE. No news is good-news. Sci. 1992;258(5090):1862–1865. doi: 10.1126/science.1361684. - DOI - PubMed
    1. Durner J, Klessig DF. Nitric oxide as a signal in plants. Curr Opin Plant Biol. 1999;2(5):369–374. doi: 10.1016/S1369-5266(99)00007-2. - DOI - PubMed
    1. Bright J, Desikan R, Hancock JT, Weir IS, Neill SJ. ABA-induced NO generation and stomatal closure in Arabidopsis are dependent on H2O2 synthesis. Plant J. 2006;45(1):113–122. doi: 10.1111/j.1365-313X.2005.02615.x. - DOI - PubMed
    1. Nathan C. Specificity of a third kind: reactive oxygen and nitrogen intermediates in cell signaling. J Clin Investig. 2003;111(6):769–778. doi: 10.1172/JCI200318174. - DOI - PMC - PubMed
    1. Uehara T, Nakamura T, Yao DD, Shi ZQ, Gu ZZ, Ma YL, et al. S-Nitrosylated protein-disulphide isomerase links protein misfolding to neurodegeneration. Nat. 2006;441(7092):513–517. doi: 10.1038/nature04782. - DOI - PubMed

MeSH terms

LinkOut - more resources