. 2021 Feb;27(1):24-33.
doi: 10.1136/injuryprev-2019-043544. Epub 2019 Dec 30.

Average medical cost of fatal and non-fatal injuries by type in the USA

Affiliations

Average medical cost of fatal and non-fatal injuries by type in the USA

Cora Peterson et al. Inj Prev. 2021 Feb.

Erratum in

Abstract

Objective: To estimate the average medical care cost of fatal and non-fatal injuries in the USA comprehensively by injury type.

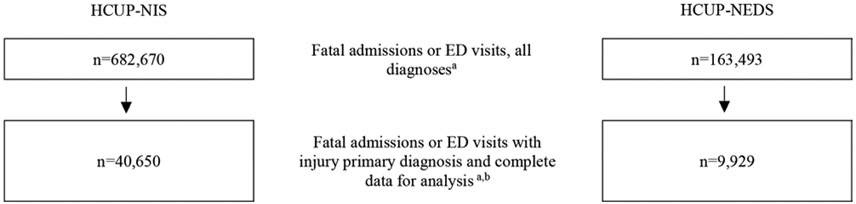
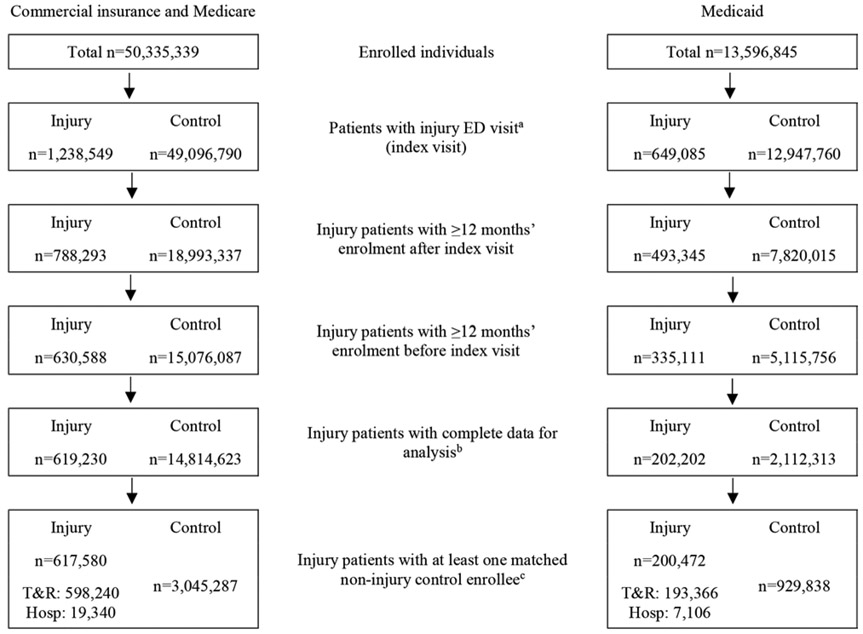
Methods: The attributable cost of injuries was estimated by mechanism (eg, fall), intent (eg, unintentional), body region (eg, head and neck) and nature of injury (eg, fracture) among patients injured from 1 October 2014 to 30 September 2015. The cost of fatal injuries was the multivariable regression-adjusted average among patients who died in hospital emergency departments (EDs) or inpatient settings as reported in the Healthcare Cost and Utilization Project Nationwide Emergency Department Sample and National Inpatient Sample, controlling for demographic (eg, age), clinical (eg, comorbidities) and health insurance (eg, Medicaid) factors. The 1-year attributable cost of non-fatal injuries was assessed among patients with ED-treated injuries using MarketScan medical claims data. Multivariable regression models compared total medical payments (inpatient, outpatient, drugs) among non-fatal injury patients versus matched controls during the year following injury patients' ED visit, controlling for demographic, clinical and insurance factors. All costs are 2015 US dollars.

Results: The average medical cost of all fatal injuries was approximately $6880 and $41 570 per ED-based and hospital-based patient, respectively (range by injury type: $4764-$10 289 and $31 912-$95 295). The average attributable 1-year cost of all non-fatal injuries per person initially treated in an ED was approximately $6620 (range by injury type: $1698-$80 172).

Conclusions and relevance: Injuries are costly and preventable. Accurate estimates of attributable medical care costs are important to monitor the economic burden of injuries and help to prioritise cost-effective public health prevention activities.

Keywords: barell matrix; costs; mechanism.


Conflict of interest statement

Competing interests: None declared.

Figures

Figure 1
Figure 1
Sample selection of emergency department visits and admissions for fatal injuries in the Healthcare Cost and Utilization Project National Inpatient Sample and Nationwide Emergency Department Sample, from 1 October 2014 to 30 September 2015. aSurvey-weighted number of admissions or ED visits. bInjury diagnosis for the emergency department visit (HCUP-NEDS) or inpatient admission (HCUP-NIS) defined by an injury code (ICD-9-CM) in the primary diagnosis field. Complete data for analysis included admission or ED visit charges, sex (male, female), age, race/ethnicity (white, black, Hispanic, Asian or Pacific Islander, Native American, other, unknown; HCUP-NIS records only, not reported in HCUP-NEDS), and primary payer for admission or ED visit (Medicare, Medicaid, private insurance, self-pay, other (e.g., worker’s compensation, other government programmes), no charge, unknown). Data sets were reweighted following exclusion of records with missing data (eg, charges) to maintain data set representativeness. HCUP-NEDS, Healthcare Cost and Utilization Project Nationwide Emergency Department Sample; HCUP-NIS, Healthcare Cost and Utilization Project National Inpatient Sample; ICD-9-CM, International Classification of Diseases, Ninth Revision, Clinical Modification.
Figure 2
Figure 2
Sample selection of patients with non-fatal ED-treated injuries in MarketScan, from 1 October 2014 to 30 September 2015. aDefined as ICD-9-CM injury diagnosis in the primary diagnosis field from 1 October 2014 to 30 September 2015 during ED visit (variable: SVCSCAT=xxx20) plus facility payment (variable: FACPROF) attributed to the injury diagnosis as identified in MarketScan Outpatient Services (ie, primarily treat-and-release patients) and Inpatient Services (ie, patients with hospitalisation following ED visits) databases (https://www.ibm.com/us-en/marketplace/marketscanresearch-databases). bComplete data for analysis included medical cost in the 12 months following ED injury visit (including index injury date) >$0 (patients with injury only), sex (male, female), age (years), race/ethnicity (white, black, Hispanic, Asian or Pacific Islander, Native American, other, unknown; Medicaid enrollees only), region of residence (based on metropolitan statistical area; records with ‘unknown’ but not missing value included; commercial insurance and Medicare supplemental enrollees only), type of health plan (eg, health management organisation) and basis for Medicaid eligibility (eg, foster care; Medicaid enrollees only). cTo ensure controls had the appropriate observation timeline—24 months surrounding injury patients’ index visit month—all potential control enrollees (non-injury) in the 2015 MarketScan Enrolment Detail table were first randomly assigned an index month (ie, values 1–12) and excluded if lacking 24 months of insurance enrolment surrounding that index month. Next, 1:5 injury patient to control enrollee match (SAS V.9.4 gmatch) was requested based on index month (ie, month of index injury ED visit for patients with injury and randomly assigned monthly for control enrollees), insurance type (commercial, Medicare or Medicaid), enrollee age (as reported in the data source for commercial insurance and Medicare supplemental patients, and for Medicaid enrollees based on reported year of birth), sex (male/female), race/ethnicity (reported in the data source for Medicaid enrollees only), region of residence (reported in the data source for commercial insurance and Medicare supplemental enrollees only), type of health plan, mental health and substance abuse treatment coverage (commercial insurance enrollees only), drug coverage, Medicare dual eligibility (Medicaid enrollees only), comorbidity count (0, 1, 2+ diagnosed in the 12 months prior to the index injury date (based on Elixhauser Comorbidity Software V.3.7) in any clinical location reported in MarketScan), and basis for Medicaid eligibility (Medicaid enrollees only). ED, emergency department; Hosp, hospitalised (inpatient); ICD-9-CM, International Classification of Diseases, Ninth Revision, Clinical Modification; T&R, treated and released.

References

    1. Murphy SL, Xu J, Kochanek KD, et al. Mortality in the United States, 2017. NCHS Data Brief 2018:1–8. - PubMed
    1. National Center for Injury Prevention and Control. Web-Based injury statistics query and reporting system (WISQARS). Atlanta, GA: Centers for Disease Control and Prevention, 2019. https://www.cdc.gov/injury/wisqars/nonfatal.html
    1. US Bureau of Economic Analysis. Health care satellite account: blended account, 2000–2016 Suidland, MD, 2018. Available: https://www.bea.gov/data/special-topics/health-care
    1. Lawrence B, Miller T. Medical and work loss cost estimation methods for the WISQARS cost of injury module. Calverton, MD: Pacific Institute for Research & Evaluation, 2010.
    1. Florence C, Haegerich T, Simon T, et al. Estimated Lifetime Medical and Work-Loss Costs of Emergency Department-Treated Nonfatal Injuries--United States, 2013. MMWR Morb Mortal Wkly Rep 2015;64:1078–82. - PubMed