. 2020 Jan 29;40(5):1162-1173.
doi: 10.1523/JNEUROSCI.1359-19.2019. Epub 2019 Dec 30.

Short-Chain Fatty Acids Improve Poststroke Recovery via Immunological Mechanisms

Affiliations

Short-Chain Fatty Acids Improve Poststroke Recovery via Immunological Mechanisms

Rebecca Sadler et al. J Neurosci. .

Abstract

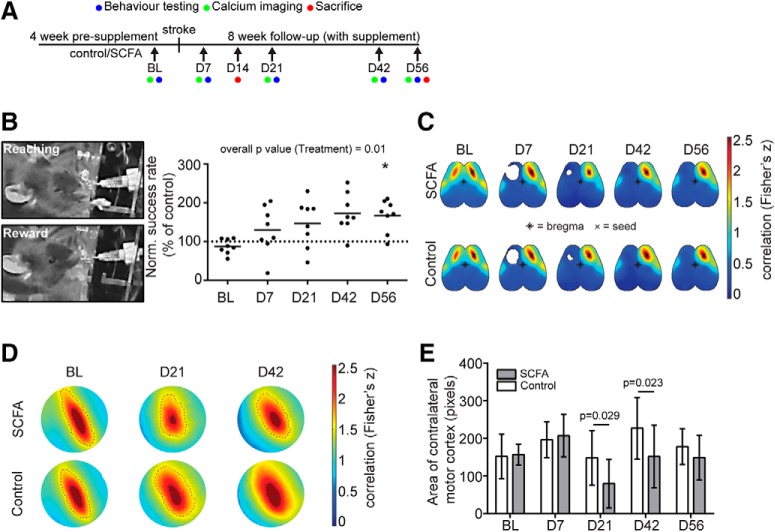
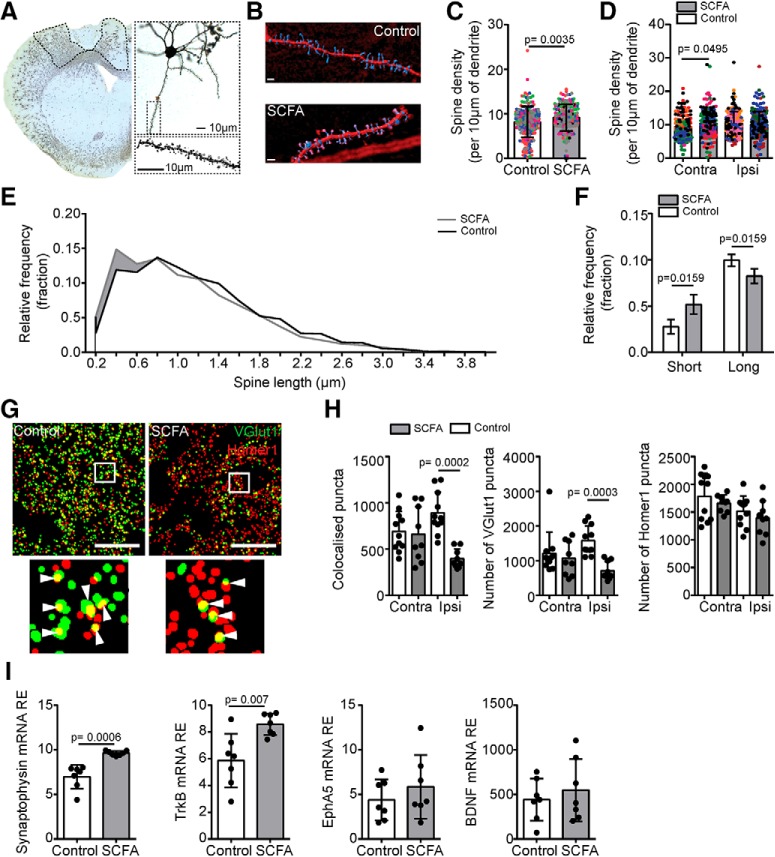
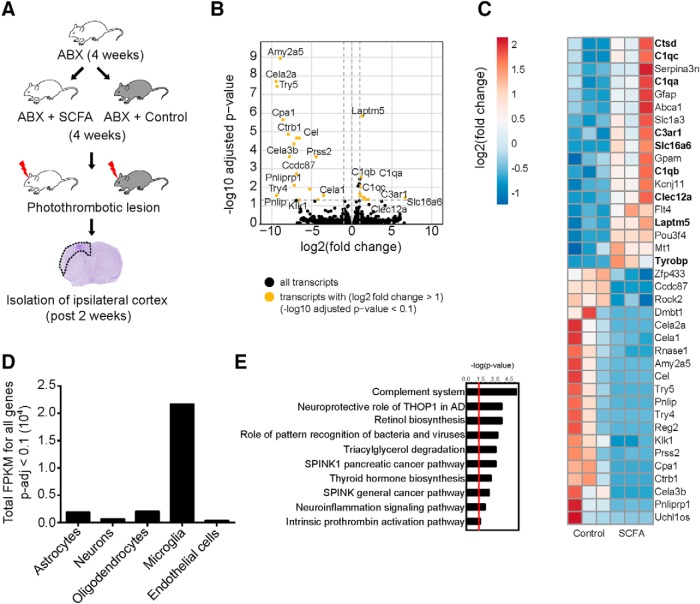
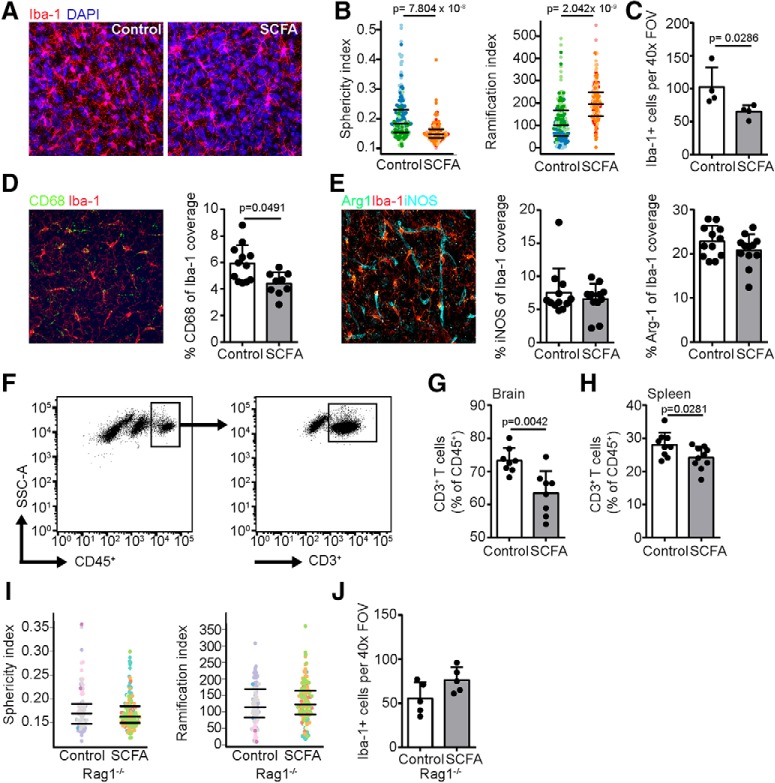
Recovery after stroke is a multicellular process encompassing neurons, resident immune cells, and brain-invading cells. Stroke alters the gut microbiome, which in turn has considerable impact on stroke outcome. However, the mechanisms underlying gut-brain interaction and implications for long-term recovery are largely elusive. Here, we tested the hypothesis that short-chain fatty acids (SCFAs), key bioactive microbial metabolites, are the missing link along the gut-brain axis and might be able to modulate recovery after experimental stroke. SCFA supplementation in the drinking water of male mice significantly improved recovery of affected limb motor function. Using in vivo wide-field calcium imaging, we observed that SCFAs induced altered contralesional cortex connectivity. This was associated with SCFA-dependent changes in spine and synapse densities. RNA sequencing of the forebrain cortex indicated a potential involvement of microglial cells in contributing to the structural and functional remodeling. Further analyses confirmed a substantial impact of SCFAs on microglial activation, which depended on the recruitment of T cells to the infarcted brain. Our findings identified that microbiota-derived SCFAs modulate poststroke recovery via effects on systemic and brain resident immune cells.SIGNIFICANCE STATEMENT Previous studies have shown a bidirectional communication along the gut-brain axis after stroke. Stroke alters the gut microbiota composition, and in turn, microbiota dysbiosis has a substantial impact on stroke outcome by modulating the immune response. However, until now, the mediators derived from the gut microbiome affecting the gut-immune-brain axis and the molecular mechanisms involved in this process were unknown. Here, we demonstrate that short-chain fatty acids, fermentation products of the gut microbiome, are potent and proregenerative modulators of poststroke neuronal plasticity at various structural levels. We identified that this effect was mediated via circulating lymphocytes on microglial activation. These results identify short-chain fatty acids as a missing link along the gut-brain axis and as a potential therapeutic to improve recovery after stroke.

Keywords: microbiome; neuroinflammation; plasticity; stroke models.


Figures

Figure 1.
Figure 1.
SCFA supplementation improves recovery after stroke. A, Schematic diagram illustrating the timeline of SCFA supplementation and analysis time points. BL, Baseline; D, day (after stroke). See Figure 1-1). B, Representative images obtained during the lever pull test of trained mouse successfully reaching for the lever (left, above) and obtaining the peanut oil reward (left, below). Right, Normalized success rate for lever pulls by the affected (contralesional) forelimb. Relative values are shown per time point normalized to the mean of the control group. N = 8 per group. Horizontal line indicates mean. Two-way repeated measure ANOVA with Holm–Sidak's post hoc test. C, Topographic depiction of seed-based functional connectivity of both hemispheres at indicated time points of SCFAs and control-treated mice. Seed is placed in the homotypic contralesional region to the ipsilesional lesion area (i.e., the contralesional motor cortex). Color code represents Fisher's z correlation between the seed and every other pixel in the cortex. D, Enlarged images of the contralesional motor cortex (region homotypic to the infarct lesion). Area highlighted with dotted line represents the highly connected functional motor cortex area (pixels with Fisher's z values > 2.25). E, Quantification of highly correlated (Fisher's z > 2.25) area of the contralesional motor cortex in control (open bars) and SCFA-treated mice (gray bars). N = 15 per group. Multiple t tests per time point with Holm–Sidak's correction for multiple testing.
Figure 2.
Figure 2.
Poststroke neuronal plasticity is altered by SCFA treatment. A, Representative images of Golgi-Cox stained brain sections 14 d after PT stroke (Figure 2-1A–E). Dotted area in overview image represents perilesional cortical area used for spine analysis. Magnifications show representative pyramidal neuron and high-magnification image as used for spine analysis. Top right, Cortical pyramidal neuron. Bottom right, Example of spines identified on dendrite. Scale bar, 10 μm. B, 3D reconstruction for a dendrite section with spines as used for further quantification of spine densities and lengths. Scale bar, 2 μm. C, Quantification of pyramidal spine density per 10 μm of dendrite in the cortex of control and SCFA-treated naive mice (no stroke induction). Each color represents a different mouse, and each dot indicates a different dendrite. Five neurons per hemisphere analyzed in total for 4 or 5 mice per group (Mann–Whitney U test). D, Quantification of spine density per 10 μm of dendrite in the perilesional and contralesional cortex at 14 d after stroke (Kruskal–Wallis test with Dunn's correction for multiple comparisons). E, Histogram of the relative frequency (fraction) of spines found at different lengths 14 d after PT lesion in the perilesional cortex. Bin width is 0.2 μm (Figure 2-1F,G). F, Quantification of short (0.2 μm) and long (1.4 μm) spines in control (open bars) and SCFA (gray bars) treated mice. N = 4 or 5 per group. Mann–Whitney U test. G, Representative particle images of presynaptic terminals by VGlut1 (green), postsynaptic densities by Homer1 (red), and nuclei with DAPI (blue) of the cortex from control and SCFA-treated mice, as used for quantification of colocalized presynaptic and postsynaptic particles (puncta). Scale bar, 20 μm. Arrowheads indicate colocalized (yellow) puncta. H, Synapse counts were quantified as colocalized VGlut1 and Homer1 puncta (Figure 2-1H). Quantification for colocalization (left) and for single markers (middle and right) revealed significantly changed synapse counts as a result of the reduced number of VGlut1+ terminals in the perilesional cortex. contra, Contralesional hemisphere; ipsi, ipsilesional hemisphere. N = 3 or 4 mice (3 sections per mouse). Statistical analysis was performed with Kruskal–Wallis test with Dunn's multiple comparison correction. I, Relative expression (RE) of mRNA for key molecules involved in synaptic plasticity (left), synaptophysin (left middle), TrkB (right middle), and EphA5 (right) BDNF from the perilesional cortex in control (open bars) and SCFA (gray bars) treated mice. N = 7 per group. Mann–Whitney U test.
Figure 3.
Figure 3.
SCFA supplementation affects microglial gene signature after stroke. A, Schematic diagram illustrating antibiotic (ABX) treatment regimen and followed by supplementation with SCFAs or control saline in drinking water (Figure 3-1). Delineated area on histological image represents perilesional cortex isolated for mRNA sequencing. B, Volcano plot of regulated transcripts (SCFAs/control) in the perilesional cortex 14 d after PT stroke; n = 3 per group. Black represents gene transcripts. Orange represents gene transcripts with fold change (log2) > 1 and −log10-adjusted p < 0.1. C, Heatmap of fold change (log2) for significantly regulated genes with an adjusted p < 0.1. Each column represents 1 individual mouse. D, FPKN abundance and association per cerebral cell type of all significantly regulated genes (C) were performed as detailed in Materials and Methods, revealing the strongest association of the significantly regulated genes with microglial cells. E, Ingenuity pathway analysis showing the top networks regulated by SCFA supplementation compared with control treatment.
Figure 4.
Figure 4.
Modulation of poststroke neuroinflammation by SCFA depends on peripheral lymphocytes. A, Representative maximum intensity projections of microglial staining using Iba-1 (red) and DAPI (blue) in the ipsilesional hemisphere 14 d after PT stroke with either control (left) or SCFA (right) supplementation. B, Microglial morphology was analyzed in 3D using an automated analysis algorithm in the ipsilesional cortex of mice 14 d after stroke, which revealed significantly reduced sphericity (left) and increased number of branch nodes (right) as markers of reduced microglial activation by SCFA compared with control treatment. Each symbol represents one microglia. Different colors group together microglia from the same mouse. C, Number of microglia found per 1 high-power (40×) FOV in the perilesional cortex. D, Coexpression coverage analysis in the ipsilateral hemispheric cortex for CD68 and Iba-1 expressed as percentage of Iba-1 from a maximum intensity projection. Representative immunofluorescence image (red represents microglia; green represents CD68) (left) and quantification (right). E, Coexpression coverage analysis in the ipsilateral hemispheric cortex for iNOS and Arginase1 (Arg1) with Iba-1 expressed as percentage of Iba-1 coverage area from a maximum intensity projection. Representative immunofluorescence image (red represents microglia; green represents Arg1; cyan represents iNOS) (left) and quantification (right). N = 3 mice per group and 3 images per hemisphere. In contrast to the effects of SCFA on microglia function, endothelial cells were unaffected by the SCFA treatment (Figure 4-1). F, Representative gating strategy for flow cytometric analysis of T cells (CD45+CD3+). SCFA supplementation significantly decreased the frequency of T cells in (G) brains and (H) spleens 14 d after stroke. N = 9 per group. Quantification of (I) sphericity (left) and ramification index (right) and (J) absolute cell counts of microglia 14 d after stroke in the perilesional cortex of Rag1−/− mice. In contrast to WT mice (compare with B,C), SCFA treatment did not affect microglia activation in lymphocyte-deficient Rag1−/− mice. All statistical analyses in this figure were performed using the Mann–Whitney U test.

Comment in

References

    1. Arpaia N, Campbell C, Fan X, Dikiy S, van der Veeken J, deRoos P, Liu H, Cross JR, Pfeffer K, Coffer PJ, Rudensky AY (2013) Metabolites produced by commensal bacteria promote peripheral regulatory T-cell generation. Nature 504:451–455. 10.1038/nature12726 - DOI - PMC - PubMed
    1. Asarat M, Apostolopoulos V, Vasiljevic T, Donkor O (2016) Short-chain fatty acids regulate cytokines and Th17/Treg cells in human peripheral blood mononuclear cells in vitro. Immunol Invest 45:205–222. 10.3109/08820139.2015.1122613 - DOI - PubMed
    1. Austin V, Ku JM, Miller AA, Vlahos R (2019) Ischaemic stroke in mice induces lung inflammation but not acute lung injury. Sci Rep 9:3622. 10.1038/s41598-019-40392-1 - DOI - PMC - PubMed
    1. Becker AM, Meyers E, Sloan A, Rennaker R, Kilgard M, Goldberg MP (2016) An automated task for the training and assessment of distal forelimb function in a mouse model of ischemic stroke. J Neurosci Methods 258:16–23. 10.1016/j.jneumeth.2015.10.004 - DOI - PMC - PubMed
    1. Benakis C, Brea D, Caballero S, Faraco G, Moore J, Murphy M, Sita G, Racchumi G, Ling L, Pamer EG, Iadecola C, Anrather J (2016) Commensal microbiota affects ischemic stroke outcome by regulating intestinal gamma delta T cells. Nat Med 22:516–523. 10.1038/nm.4068 - DOI - PMC - PubMed

Publication types

Substances