

A combined strategy of feature selection and machine learning to identify predictors of prediabetes
- PMID: 31889178
- PMCID: PMC7647289
- DOI: 10.1093/jamia/ocz204
A combined strategy of feature selection and machine learning to identify predictors of prediabetes
Abstract
Objective: To identify predictors of prediabetes using feature selection and machine learning on a nationally representative sample of the US population.
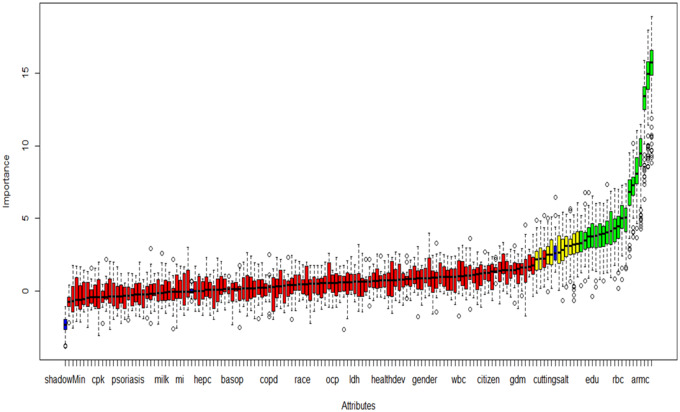
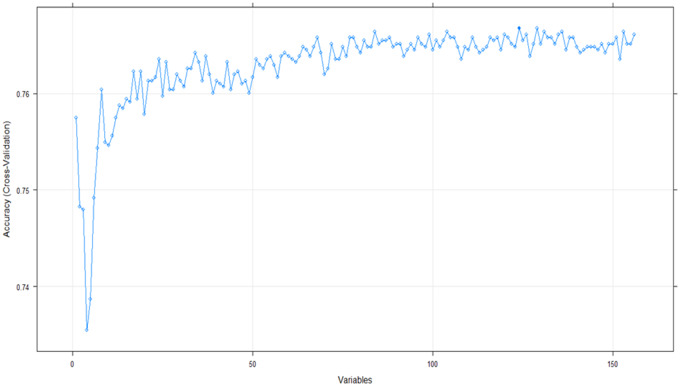
Materials and methods: We analyzed n = 6346 men and women enrolled in the National Health and Nutrition Examination Survey 2013-2014. Prediabetes was defined using American Diabetes Association guidelines. The sample was randomly partitioned to training (n = 3174) and internal validation (n = 3172) sets. Feature selection algorithms were run on training data containing 156 preselected exposure variables. Four machine learning algorithms were applied on 46 exposure variables in original and resampled training datasets built using 4 resampling methods. Predictive models were tested on internal validation data (n = 3172) and external validation data (n = 3000) prepared from National Health and Nutrition Examination Survey 2011-2012. Model performance was evaluated using area under the receiver operating characteristic curve (AUROC). Predictors were assessed by odds ratios in logistic models and variable importance in others. The Centers for Disease Control (CDC) prediabetes screening tool was the benchmark to compare model performance.
Results: Prediabetes prevalence was 23.43%. The CDC prediabetes screening tool produced 64.40% AUROC. Seven optimal (≥ 70% AUROC) models identified 25 predictors including 4 potentially novel associations; 20 by both logistic and other nonlinear/ensemble models and 5 solely by the latter. All optimal models outperformed the CDC prediabetes screening tool (P < 0.05).
Discussion: Combined use of feature selection and machine learning increased predictive performance outperforming the recommended screening tool. A range of predictors of prediabetes was identified.
Conclusion: This work demonstrated the value of combining feature selection with machine learning to identify a wide range of predictors that could enhance prediabetes prediction and clinical decision-making.
Keywords: NHANES; feature selection; machine learning; prediabetes; predictors.
© The Author(s) 2019. Published by Oxford University Press on behalf of the American Medical Informatics Association. All rights reserved. For permissions, please email: journals.permissions@oup.com.
Figures
Similar articles
-
Development and validation of a prediction model based on machine learning algorithms for predicting the risk of heart failure in middle-aged and older US people with prediabetes or diabetes.Clin Cardiol. 2023 Oct;46(10):1234-1243. doi: 10.1002/clc.24104. Epub 2023 Jul 31. Clin Cardiol. 2023. PMID: 37519220 Free PMC article. Clinical Trial.
-
Development of a 5-Year Risk Prediction Model for Transition From Prediabetes to Diabetes Using Machine Learning: Retrospective Cohort Study.J Med Internet Res. 2025 May 9;27:e73190. doi: 10.2196/73190. J Med Internet Res. 2025. PMID: 40344663 Free PMC article.
-
Nutritional markers of undiagnosed type 2 diabetes in adults: Findings of a machine learning analysis with external validation and benchmarking.PLoS One. 2021 May 5;16(5):e0250832. doi: 10.1371/journal.pone.0250832. eCollection 2021. PLoS One. 2021. PMID: 33951067 Free PMC article.
-
Predictive models for hospital readmission risk: A systematic review of methods.Comput Methods Programs Biomed. 2018 Oct;164:49-64. doi: 10.1016/j.cmpb.2018.06.006. Epub 2018 Jun 28. Comput Methods Programs Biomed. 2018. PMID: 30195431
-
Systematic review of studies examining contribution of oral health variables to risk prediction models for undiagnosed Type 2 diabetes and prediabetes.Clin Exp Dent Res. 2022 Feb;8(1):96-107. doi: 10.1002/cre2.515. Epub 2021 Nov 30. Clin Exp Dent Res. 2022. PMID: 34850592 Free PMC article.
Cited by
-
Hyperglycemia screening based on survey data: an international instrument based on WHO STEPs dataset.BMC Endocr Disord. 2022 Dec 14;22(1):316. doi: 10.1186/s12902-022-01222-0. BMC Endocr Disord. 2022. PMID: 36514025 Free PMC article.
-
Machine learning for diabetes clinical decision support: a review.Adv Comput Intell. 2022;2(2):22. doi: 10.1007/s43674-022-00034-y. Epub 2022 Apr 13. Adv Comput Intell. 2022. PMID: 35434723 Free PMC article. Review.
-
Machine Learning-Based Prediction of Binge Drinking among Adults in the United State: Analysis of the 2022 Health Information National Trends Survey.Proc 2024 9th Int Conf Math Artif Intell (2024). 2024 May;2024:1-10. doi: 10.1145/3670085.3670090. Epub 2024 Aug 22. Proc 2024 9th Int Conf Math Artif Intell (2024). 2024. PMID: 39834720 Free PMC article.
-
Environmental exposures in machine learning and data mining approaches to diabetes etiology: A scoping review.Artif Intell Med. 2023 Jan;135:102461. doi: 10.1016/j.artmed.2022.102461. Epub 2022 Nov 30. Artif Intell Med. 2023. PMID: 36628796 Free PMC article.
-
Machine Learning Applications in Endocrinology and Metabolism Research: An Overview.Endocrinol Metab (Seoul). 2020 Mar;35(1):71-84. doi: 10.3803/EnM.2020.35.1.71. Endocrinol Metab (Seoul). 2020. PMID: 32207266 Free PMC article. Review.
References
Publication types
MeSH terms
LinkOut - more resources
Full Text Sources
Medical
