

Molecular subgrouping of atypical teratoid/rhabdoid tumors-a reinvestigation and current consensus
- PMID: 31889194
- PMCID: PMC7229260
- DOI: 10.1093/neuonc/noz235
Molecular subgrouping of atypical teratoid/rhabdoid tumors-a reinvestigation and current consensus
Erratum in
-
Corrigendum to: Molecular subgrouping of atypical teratoid/rhabdoid tumors-a reinvestigation and current consensus.Neuro Oncol. 2022 Jul 1;24(7):1213. doi: 10.1093/neuonc/noaa210. Neuro Oncol. 2022. PMID: 33283872 Free PMC article. No abstract available.
Abstract
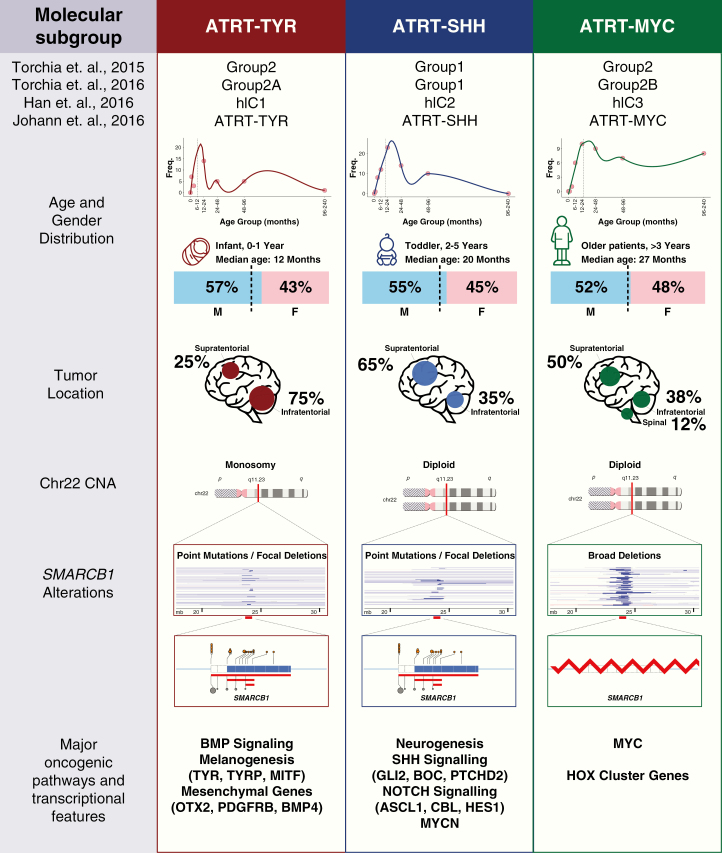
Background: Atypical teratoid/rhabdoid tumors (ATRTs) are known to exhibit molecular and clinical heterogeneity even though SMARCB1 inactivation is the sole recurrent genetic event present in nearly all cases. Indeed, recent studies demonstrated 3 molecular subgroups of ATRTs that are genetically, epigenetically, and clinically distinct. As these studies included different numbers of tumors, various subgrouping techniques, and naming, an international working group sought to align previous findings and to reach a consensus on nomenclature and clinicopathological significance of ATRT subgroups.
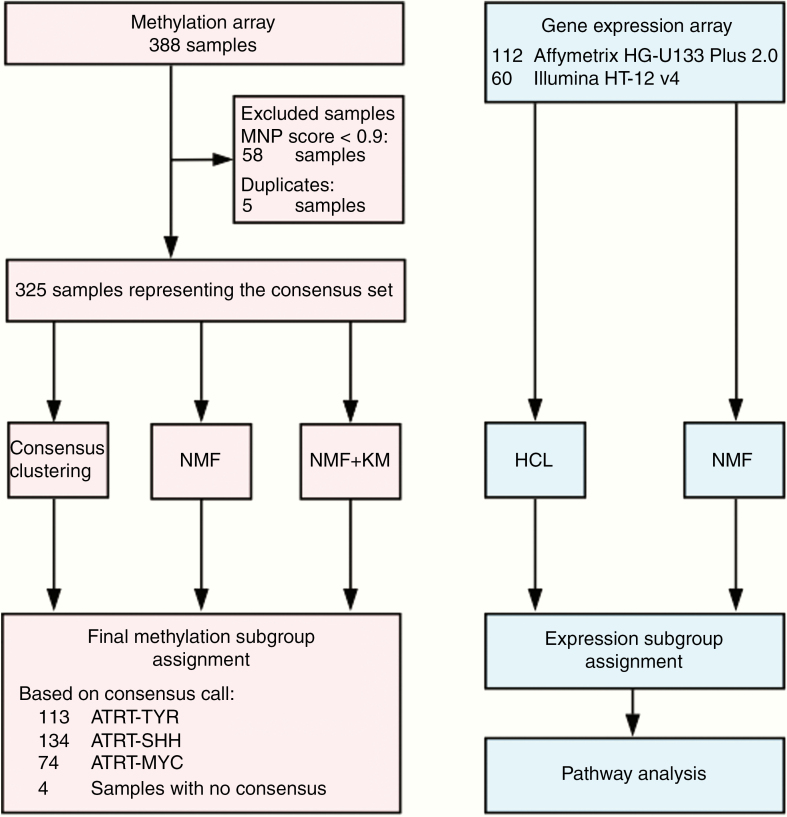
Methods: We integrated various methods to perform a meta-analysis on published and unpublished DNA methylation and gene expression datasets of ATRTs and associated clinicopathological data.
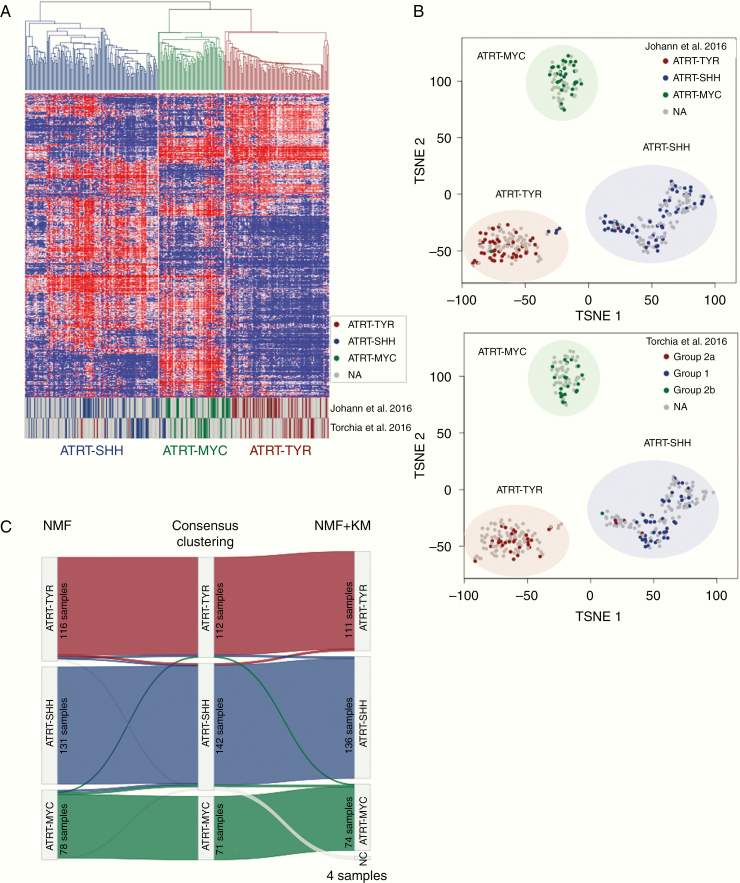
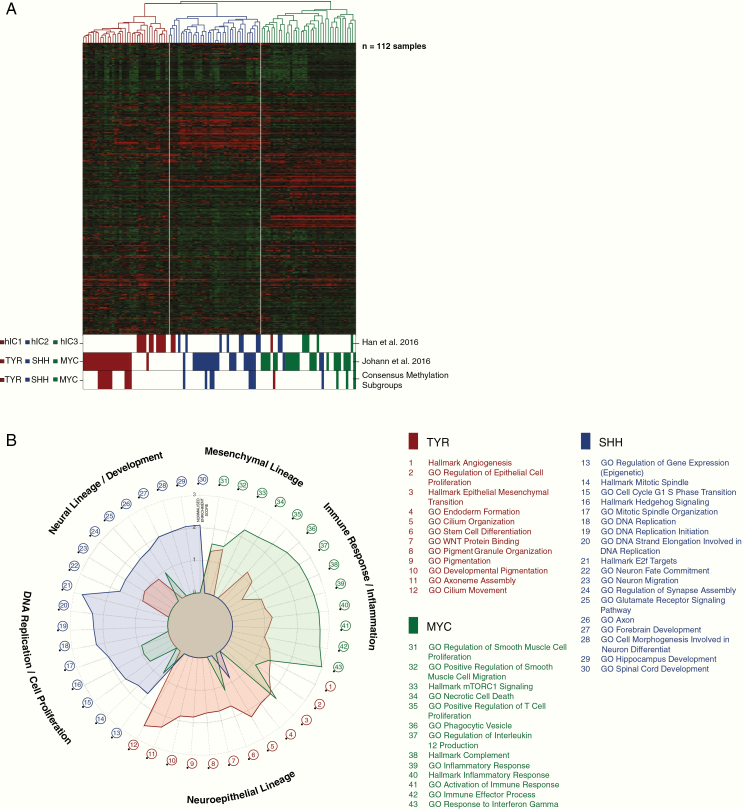
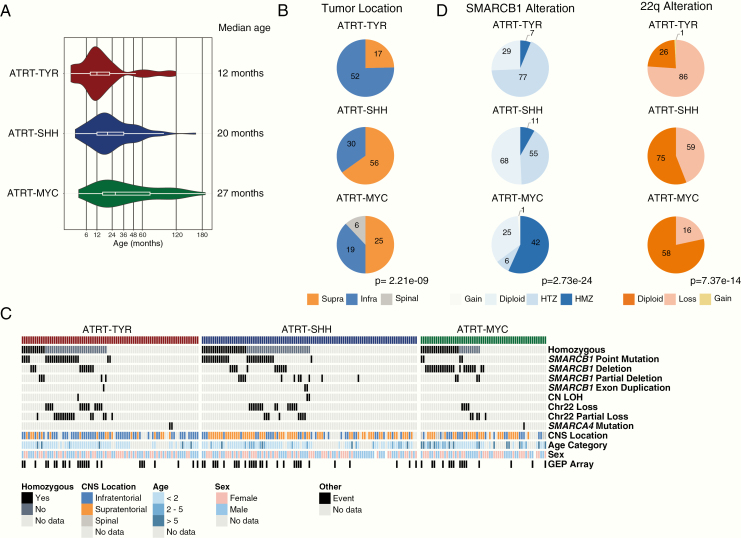
Results: In concordance with previous studies, the analyses identified 3 main molecular subgroups of ATRTs, for which a consensus was reached to name them ATRT-TYR, ATRT-SHH, and ATRT-MYC. The ATRT-SHH subgroup exhibited further heterogeneity, segregating further into 2 subtypes associated with a predominant supratentorial (ATRT-SHH-1) or infratentorial (ATRT-SHH-2) location. For each ATRT subgroup we provide an overview of its main molecular and clinical characteristics, including SMARCB1 alterations and pathway activation.
Conclusions: The introduction of a common classification, characterization, and nomenclature of ATRT subgroups will facilitate future research and serve as a common ground for subgrouping patient samples and ATRT models, which will aid in refining subgroup-based therapies for ATRT patients.
Keywords: ATRT; consensus; meta-analysis; molecular subgroups.
© The Author(s) 2019. Published by Oxford University Press on behalf of the Society for Neuro-Oncology.
Figures
References
-
- Hasselblatt M, Nagel I, Oyen F, et al. . SMARCA4-mutated atypical teratoid/rhabdoid tumors are associated with inherited germline alterations and poor prognosis. Acta Neuropathol. 2014;128(3):453–456. - PubMed
Publication types
MeSH terms
Grants and funding
LinkOut - more resources
Full Text Sources
Molecular Biology Databases
Research Materials
