. 2019 Dec 30;6(1):32.
doi: 10.1186/s40658-019-0262-y.

Evaluation of a Bayesian penalized likelihood reconstruction algorithm for low-count clinical 18F-FDG PET/CT

Affiliations

Evaluation of a Bayesian penalized likelihood reconstruction algorithm for low-count clinical 18F-FDG PET/CT

Joost Te Riet et al. EJNMMI Phys. .

Abstract

Background: Recently, a Bayesian penalized likelihood (BPL) reconstruction algorithm was introduced for a commercial PET/CT with the potential to improve image quality. We compared the performance of this BPL algorithm with conventional reconstruction algorithms under realistic clinical conditions such as daily practiced at many European sites, i.e. low 18F-FDG dose and short acquisition times.

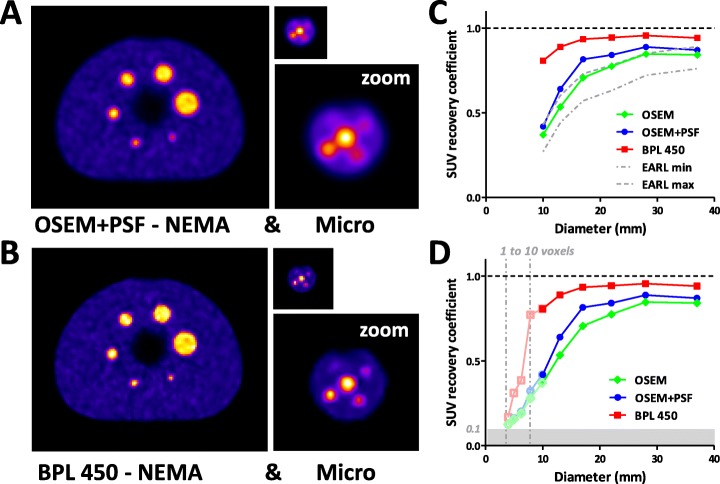
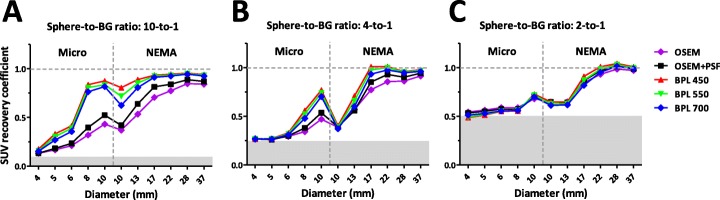
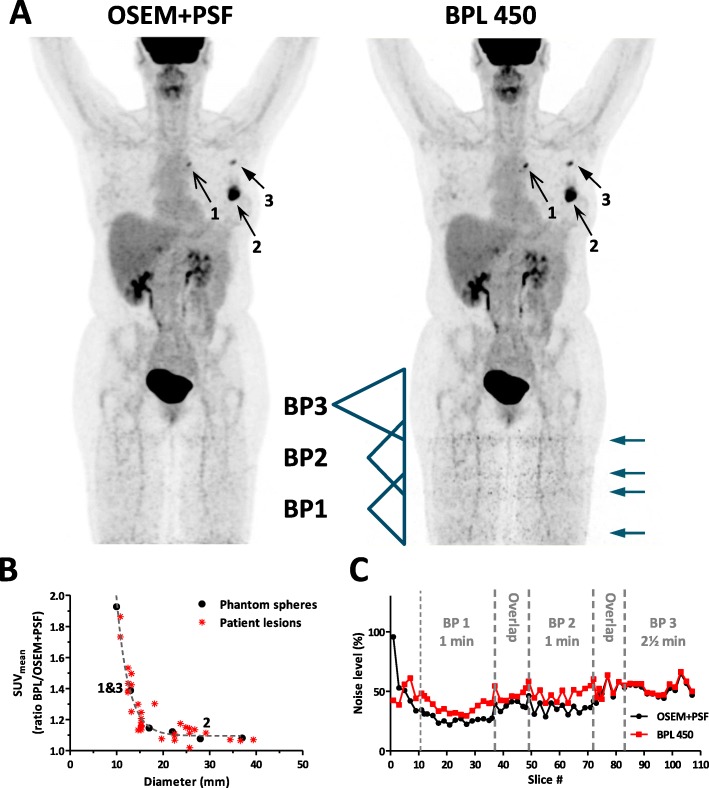
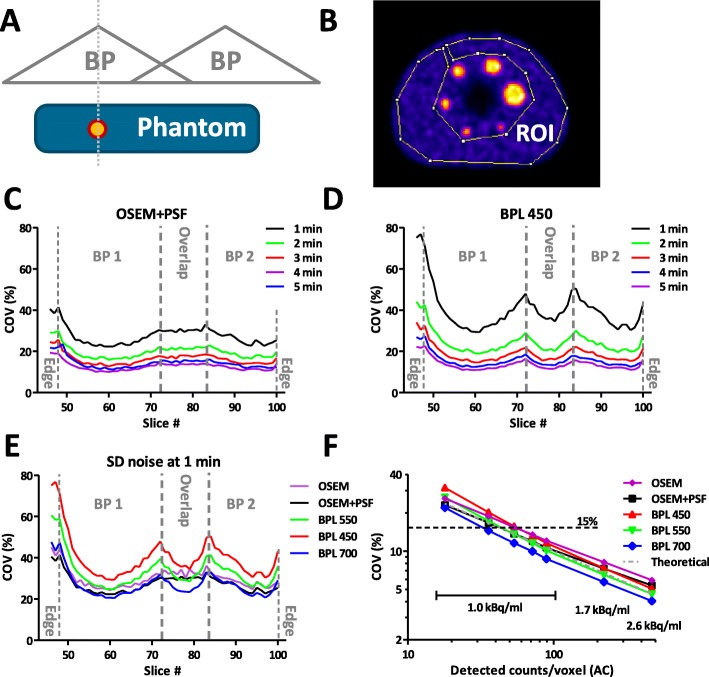
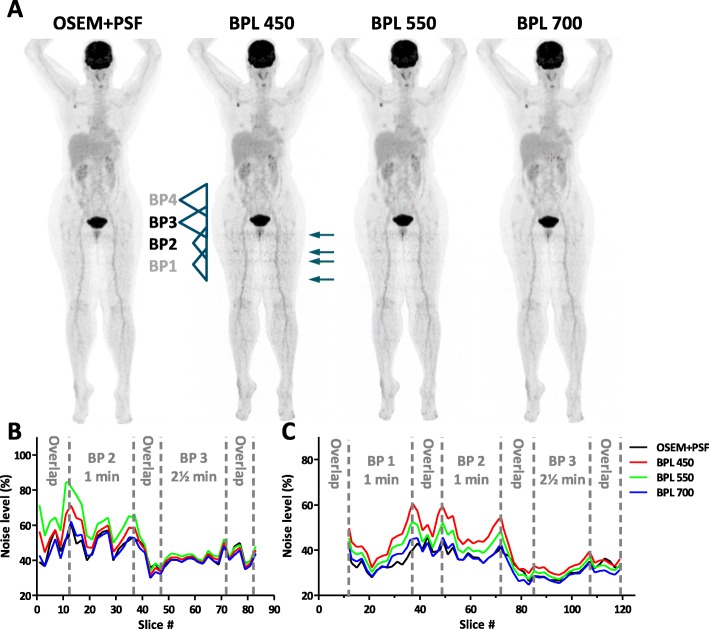
Results: To study the performance of the BPL algorithm, regular clinical 18F-FDG whole body PET scans were made. In addition, two types of phantoms were scanned with 4-37 mm sized spheres filled with 18F-FDG at sphere-to-background ratios of 10-to-1, 4-to-1, and 2-to-1. Images were reconstructed using standard ordered-subset expectation maximization (OSEM), OSEM with point spread function (PSF), and the BPL algorithm using β-values of 450, 550 and 700. To quantify the image quality, the lesion detectability, activity recovery, and the coefficient of variation (COV) within a single bed position (BP) were determined. We found that when applying the BPL algorithm both smaller lesions in clinical studies as well as spheres in phantom studies can be detected more easily due to a higher SUV recovery, especially for higher contrast ratios. Under standard clinical scanning conditions, i.e. low number of counts, the COV is higher for the BPL (β=450) than the OSEM+PSF algorithm. Increase of the β-value to 550 or 700 results in a COV comparable to OSEM+PSF, however, at the cost of contrast, though still better than OSEM+PSF. At the edges of the axial field of view (FOV) where BPs overlap, COV can increase to levels at which bands become visible in clinical images, related to the lower local axial sensitivity of the PET/CT, which is due to the limited bed overlap of 23% such as advised by the manufacturer.

Conclusions: The BPL algorithm performs better than the standard OSEM+PSF algorithm on small lesion detectability, SUV recovery, and noise suppression. Increase of the percentage of bed overlap, time per BP, administered activity, or the β-value, all have a direct positive impact on image quality, though the latter with some loss of small lesion detectability. Thus, BPL algorithms are very interesting for improving image quality, especially in small lesion detectability.

Keywords: Bayesian penalized likelihood; Micro Hollow Sphere phantom; NEMA image quality phantom; Q.Clear; image quality; image reconstruction; optimization; positron emission tomography.


Conflict of interest statement

The authors declare that they have no competing interests.

Figures

Fig. 1
Fig. 1
Results of phantom studies with a sphere-to-background ratio of 10-to-1. 18F-FDG PET/CT imaging of the standard NEMA image quality phantom and micro hollow sphere phantom (real size and zoom) having different sized spheres ranging in size from 4-37 mm (0.03-27 ml). Images were reconstructed with a.) OSEM+PSF, or b.) BPL algorithm with β=450. c.) The SUVmean recovery coefficients of OSEM, OSEM+PSF and BPL 450 reconstructions of the NEMA phantom, compared to the EARL standard. d.) SUVmean recovery coefficients of OSEM, OSEM+PSF and BPL 450 reconstructions extended by analysis of the micro phantom. Micro phantom data were extrapolated based on 10 mm sphere results present in both phantoms as a way to correct for attenuation (uncorrected data in Table 1 and Figure 2). “0.1” represents the level at which SUV recovery is the same as background (gray area). For the smallest spheres the volume equivalent in voxels is indicated (dash-dotted lines)
Fig. 2
Fig. 2
Results of phantom study with different sphere-to-background ratios. SUVmean recovery coefficients of all micro and NEMA spheres reconstructed with different algorithms; OSEM, OSEM+PSF and BPL with β = 450, 550 and 700. Results are shown for all three different sphere-to-background ratios: a.) 10-to-1, b.) 4-to-1, and c.) 2-to-1. Gray areas indicate levels at which SUV recovery is the same as background
Fig. 3
Fig. 3
Lesion detectability and noise levels per slice in patient studies. a.) Representative 18F-FDG PET/CT patient study reconstructed by OSEM+PSF and BPL 450. Indicated are three lesions of different sizes (numbered arrows) and the position of three BPs, sensitivity (indicated by the triangle), and their overlap region. The acquisition times are different: BP1 & BP2 (1 min/bed) and BP3 (2½ min/bed). ‘Noise bands’ in the legs are indicated by arrows. b.) Ratio of the SUVmean of N = 33 lesions from N = 8 patients measured in reconstructions from BPL 450 and OSEM+PSF. In addition, the ratios are given for the 6 spheres of the NEMA as measured in Fig. 1c. The three lesions of A.) are indicated in the graph. A single exponential decay was fitted to both data sets showing an agreement of R2 = 0.917. c.) Noise levels per slice, defined as the SD/mean of a ROI drawn in muscle tissue, are given for the 3 BPs of the patient scan indicated in A.). Acquisition times per BP as well as overlap regions of 11 slices between two BPs are indicated
Fig. 4
Fig. 4
COV variation within the BPs. a.) Positioning of the NEMA phantom and the spheres within 2 BPs. Spheres are oriented such that they are the maximum of the sensitivity of a BP. b.) Region of interest (ROI) drawn in the NEMA phantom excluding the spheres used for background measurements of mean and SD values to calculate COV. c-d.) COV for different slices within 2 BPs and its overlap region with different acquisition times varying between 1 and 5 min/bed of the phantom filled at a 10-to-1 ratio (BG activity: 1.0 kBq/ml). Shown are the results of c.) OSEM+PSF reconstructions and d.) BPL 450 reconstructions. e.) Comparison of the COV for different slices at 1 min/bed and using an OSEM+PSF or BPL 450, 550 and 700 reconstructions. f.) Relation between the observed noise and the amount of counts detected per voxel based on PET sensitivity of the 11 central slices of a BP and known activity of the background. The first 5 points on the x-axis correspond to 1 to 5 min/bed. Two extra points were extracted from background measurements based on the 4-to-1 and 2-to-1 phantom measurements; BG activity: 1.7 kBq/ml and 2.6 kBq/ml, respectively
Fig. 5
Fig. 5
Comparison of noise levels in patient studies. a.) Representative 18F-FDG PET/CT patient study reconstructed by OSEM+PSF and BPL with a β of 450, 550 and 700. The two BPs are indicated at which acquisition time changes from 1 min/bed (BP2) to 2½ min/bed (BP3). b.) Noise levels per slice at the BPs of the study shown in A.). Indicated are the BPs and overlap regions. c.) Averaged noise levels of multiple patient studies (N = 8) at the transition of BPs taken at 1 min/bed (BP1 & BP2) to 2½ min/bed (BP3)

References

    1. Boellaard R, O'Doherty MJ, Weber WA, Mottaghy FM, Lonsdale MN, Stroobants SG, et al. FDG PET and PET/CT: EANM procedure guidelines for tumour PET imaging: version 1.0. Eur J Nucl Med Mol Imaging. 2010;37:181–200. doi: 10.1007/s00259-009-1297-4. - DOI - PMC - PubMed
    1. Kinahan PE, Fletcher JW. Positron emission tomography-computed tomography standardized uptake values in clinical practice and assessing response to therapy. Semin Ultrasound CT MR. 2010;31:496–505. doi: 10.1053/j.sult.2010.10.001. - DOI - PMC - PubMed
    1. Aide N, Lasnon C, Veit-Haibach P, Sera T, Sattler B, Boellaard R. EANM/EARL harmonization strategies in PET quantification: from daily practice to multicentre oncological studies. Eur J Nucl Med Mol Imaging. 2017;44:17–31. doi: 10.1007/s00259-017-3740-2. - DOI - PMC - PubMed
    1. Boellaard R, Kobe C, Zijlstra JM, Mikhaeel NG, Johnson PWM, Muller S, et al. Does PET Reconstruction Method Affect Deauville Scoring in Lymphoma Patients? J Nucl Med. 2018;59:1167–1169. doi: 10.2967/jnumed.118.211607. - DOI - PubMed
    1. Kwee TC, Cheng G, Lam MG, Basu S, Alavi A. SUVmax of 2.5 should not be embraced as a magic threshold for separating benign from malignant lesions. Eur J Nucl Med Mol Imaging. 2013;40:1475–1477. doi: 10.1007/s00259-013-2484-x. - DOI - PubMed

LinkOut - more resources