. 2019 Aug:395:1-6.
doi: 10.1016/j.physd.2019.02.001. Epub 2019 Feb 18.

Moran Model of Spatial Alignment in Microbial Colonies

Affiliations

Moran Model of Spatial Alignment in Microbial Colonies

B R Karamched et al. Physica D. 2019 Aug.

Abstract

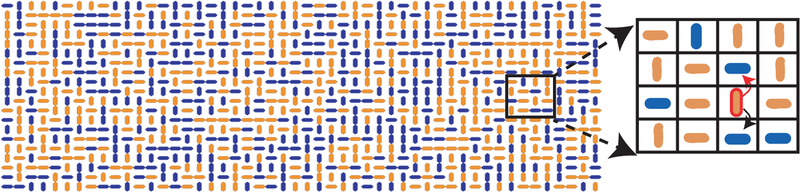
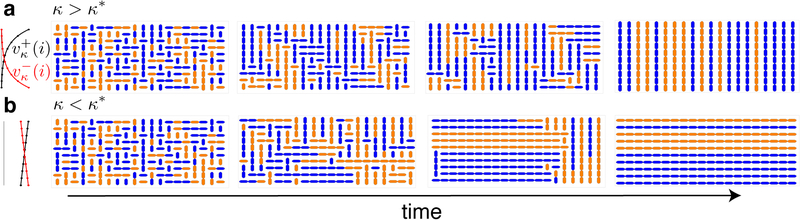
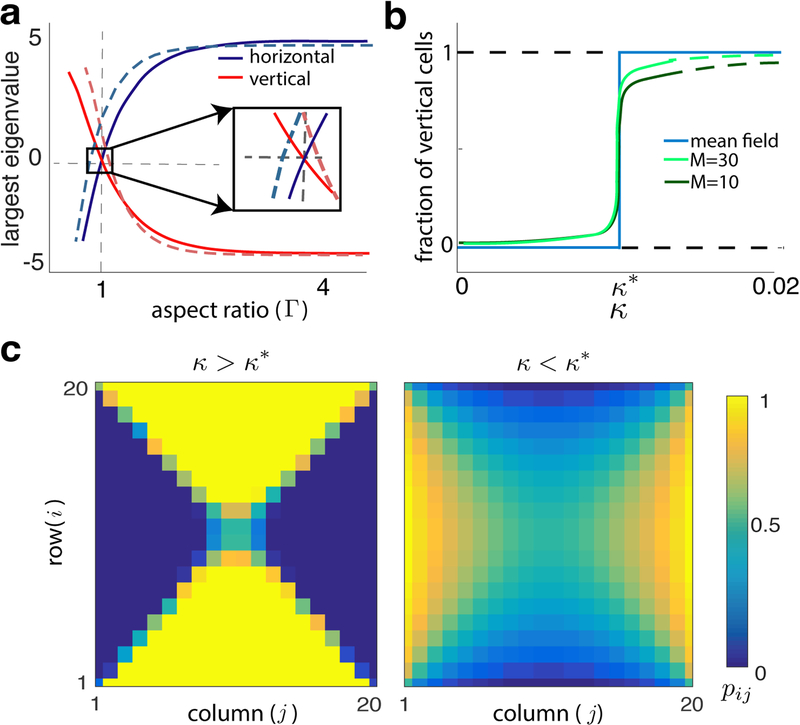
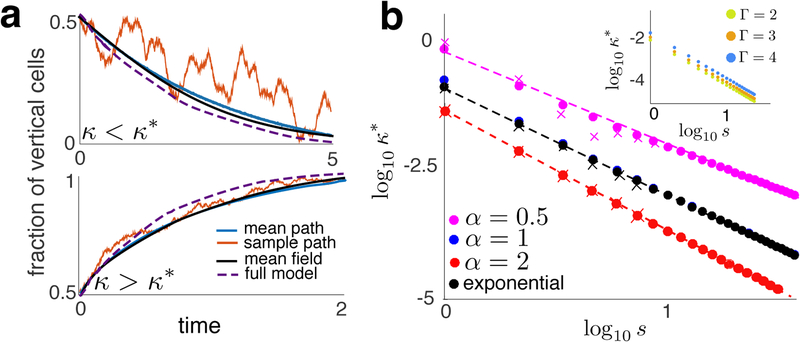
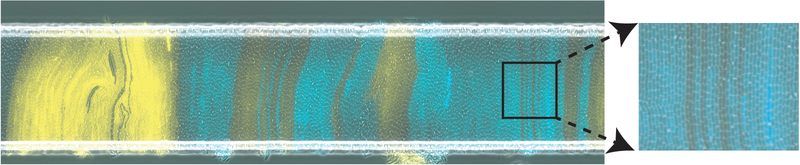
We describe a spatial Moran model that captures mechanical interactions and directional growth in spatially extended populations. The model is analytically tractable and completely solvable under a mean-field approximation and can elucidate the mechanisms that drive the formation of population-level patterns. As an example we model a population of E. coli growing in a rectangular microfluidic trap. We show that spatial patterns can arise as a result of a tug-of-war between boundary effects and growth rate modulations due to cell-cell interactions: Cells align parallel to the long side of the trap when boundary effects dominate. However, when cell-cell interactions exceed a critical value, cells align orthogonally to the trap's long side. This modeling approach and analysis can be extended to directionally-growing cells in a variety of domains to provide insight into how local and global interactions shape collective behavior.

Keywords: Moran model; cell alignment; mean field; phase transition.


Figures

FIG. 1.
FIG. 1.
In the SMM cell growth is directional and location-dependent: The vertical cell outlined in red can grow only upward or downward at a location-dependent rate. The red arrow indicates growth direction, so the cell above will be replaced by a descendant of the outlined cell. The population consists of two biochemically noninteracting strains for visualization: The initial color assignment is random, and daughter cells share the color of their mothers.
FIG. 2.
FIG. 2.
Cells growing on a lattice according to a SMM. (a) Snapshots of the transient states and the all-vertical equilibrium for for κ > κ*. On the left, we show growth rates of vertically-oriented cells toward the upper and lower boundaries; (b) Same as (a) but for κ < κ*. See SI for movies.
FIG. 3.
FIG. 3.
(a) Largest eigenvalue at all-vertical and all-horizontal equilibria (system sizes are M = 10, dashed, M = 100, solid). The two states lose stability at different points when M = 10, so that for a range of Г neither is stable. When M = 100 the equilibria lose stability nearly simultaneously at Г= 1. Here, κ = 0.1. (b) The fraction of vertical cells at equilibrium exhibits a sharp transition near κ* for fixed Г > 1 (Eq. (3), blue, and closed ME, Eq. (2), green). A secondary bifurcation in the all-vertical state occurs at κ > κ* (solid to dashed green line transition) (c) Steady states of the closed ME when Г = 1 for κ > κ* and κ < κ*.
FIG. 4.
FIG. 4.
(a) Comparison of MF solutions with averages over realizations of the SMM (N = 20, M = 10). Also shown (dashed line) are averages over realizations of the long-range interaction model (see SI) to show that time scales between the models are comparable. (b) κ* as a function of s for different interaction kernels. Dots represent κ* values from Eq. (3). X’s were obtained numerically from simulations of the SMM using bisection. Dashed line were obtained using Eq. (4). Inset: κ* as a function of s for different aspect ratios, Г.
FIG. 5.
FIG. 5.
A monolayer of E. Coli in an open microfluidic trap with cells aligned orthogonally to the trap’s long side. Colors represent distinct strains. Image is previously unpublished and taken from experiment run by RNA. Further experimental results can be seen in [11, 12, 16, 26].

References

    1. Parrish JK, Viscido SV, and Grünbaum D, “Self-organized fish schools: An examination of emergent properties,” Biol. Bull 202 (2002). - PubMed
    1. Chaté H, Ginelli F, Grégoire G, Peruani F, and Reynaud F, “Modeling collective motion: variations on the vicsek model,” Euro. Phys. J. B 64, 451–456 (2008).
    1. Peruani F, Starruß J, Jakovljevic V, Søgaard-Andersen L, Deutsch A, and Bär M, “Collective motion and nonequilibrium cluster formation in colonies of gliding bacteria,” Phys. Rev. Lett 108 (12). - PubMed
    1. Murray JD, “A pre-pattern formation mechanism for animal coat markings,” J. Theor. Biol 99, 161–199 (1981).
    1. Murray JD, “How the leopard got its stripes,” Scientific American 258, 80–87 (1988).

LinkOut - more resources