. 2019 Oct;6(4):045015.
doi: 10.1117/1.NPh.6.4.045015. Epub 2019 Dec 24.

Intraoperative quantitative functional brain mapping using an RGB camera

Affiliations

Intraoperative quantitative functional brain mapping using an RGB camera

Charly Caredda et al. Neurophotonics. 2019 Oct.

Abstract

Intraoperative optical imaging is a localization technique for the functional areas of the human brain cortex during neurosurgical procedures. However, it still lacks robustness to be used as a clinical standard. In particular, new biomarkers of brain functionality with improved sensitivity and specificity are needed. We present a method for the computation of hemodynamics-based functional brain maps using an RGB camera and a white light source. We measure the quantitative oxy and deoxyhemoglobin concentration changes in the human brain cortex with the modified Beer-Lambert law and Monte Carlo simulations. A functional model has been implemented to evaluate the functional brain areas following neuronal activation by physiological stimuli. The results show a good correlation between the computed quantitative functional maps and the brain areas localized by electrical brain stimulation (EBS). We demonstrate that an RGB camera combined with a quantitative modeling of brain hemodynamics biomarkers can evaluate in a robust way the functional areas during neurosurgery and serve as a tool of choice to complement EBS.

Keywords: Monte-Carlo simulations; RGB camera; functional brain mapping; hemodynamic response; intraoperative imaging; optical imaging.


Figures

Fig. 1
Fig. 1
Overview of the method.
Fig. 2
Fig. 2
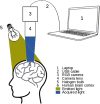
Schematic of the imaging system.
Fig. 3
Fig. 3
(a) HIRF. (b) The green curve represents the experimental paradigm P and the black curve the expected hemodynamic response which is obtained by convolving HIRF with P. (c) The black curve represents the expected heamodynamic response spectrum and the red curve, the transfer function of a Blackman window (cut off frequency: 0.05 Hz) in the Fourier domain.
Fig. 4
Fig. 4
Representation of modeled cortical tissues. Volumes are made up of 50×50×50 voxels with a 1-mm3 resolution. Red voxels represent large blood vessels and gray voxels cortical tissues. A black arrow symbolizes a Monte-Carlo simulation for an emission of 106 packets of photons at a given position. Model 1 represents a 2-mm diameter blood vessel on the surface of the cortical tissue, model 2 a 2-mm diameter blood vessel buried under 1 mm of gray matter, and model 3 a cortical tissue without a large blood vessel.
Fig. 5
Fig. 5
The red, blue, and gray curves represent the computed wavelength dependent mean optical path length of models 1, 2, and 3, respectively (see Fig. 4).
Fig. 6
Fig. 6
Validation of the motion compensation. The blue area corresponds to the acceptable NCC variation range. The red area corresponds to the NCC dispersion range of the five unregistered videos and the green area corresponds to the NCC dispersion range of the five registered videos.
Fig. 7
Fig. 7
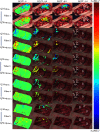
Hb and HbO2 functional maps computed for the five videos. For videos 1, 2, 3, and 5, the stimulation of the cortex was achieved through a repetitive and alternative hand opening and closing at 1  Hz (movement performed by the patient: videos 1, 2, and 5; movement induced by an external person: video 3). For video 4, the stimulation of the cortex was achieved through a repetitive fingers and palm caresses at 1Hz (the caresses were performed by an external person). The Hb and HbO2 functional maps are computed for different PCCT values. The colorbar represents the scale of variation of the QMapHb and QMapHbO2 values in μmol  L1 [see Eq. (5)]. Mij designates the motor area i of the patient j identified by EBS. Sij designates the sensory areas i of the patient j identified by EBS. Cj designates a nonactivated area of the cortex of the patient j. A 5×5 median filter is applied to the functional maps.
Fig. 8
Fig. 8
(a) Localization of points of interest. (b) Hb and HbO2 concentration changes time courses of the points of interest defined in (a).
Fig. 9
Fig. 9
Distribution of the Hb values of the areas defined in Fig. 7. The black diamonds represent the mean values of the distributions (Hb¯) and the half length of the blue lines the standard deviation values. Each video is studied separately. The notation i* indicates a T-test’s statistical significance for the comparison of the means of the distribution i and Cj (j represents the patient id).
Fig. 10
Fig. 10
Distribution of the HbO2 values of the areas defined in Fig. 7. The black diamonds represent the mean values of the distributions (HbO2) and the half length of the blue lines the standard deviation values. Each video is studied separately. The notation i* indicates a T-test’s statistical significance for the comparison of the means of the distribution i and Cj (j represents the patient id).
Fig. 11
Fig. 11
Distribution of the rHb values of the areas defined in Fig. 7. The black diamonds represent the mean values of the distributions (rHb) and the half length of the blue lines the standard deviation values. Each video is studied separately. The notation i* indicates a T-test’s statistical significance for the comparison of the means of the distribution i and Cj (j represents the patient id).
Fig. 12
Fig. 12
Distribution of the rHbO2 values of the areas defined in Fig. 7. The black diamonds represent the mean values of the distributions (rHbO2) and the half length of the blue lines the standard deviation values. Each video is studied separately. The notation i* indicates a T-test’s statistical significance for the comparison of the means of the distribution i and Cj (j represents the patient id).

References

    1. Ogawa S., et al. , “Brain magnetic resonance imaging with contrast dependent on blood oxygenation,” Proc. Natl. Acad. Sci. U. S. A. 87, 9868–9872 (1990).10.1073/pnas.87.24.9868 - DOI - PMC - PubMed
    1. Gerard I. J., et al. , “Brain shift in neuronavigation of brain tumors: a review,” Med. Image Anal. 35, 403–420 (2017).10.1016/j.media.2016.08.007 - DOI - PubMed
    1. Penfield W., Boldrey E., “Somatic motor and sensory representation in the cerebral cortex of man as studied by electrical stimulation,” Brain 60(4), 389–443 (1937).BRAIAK10.1093/brain/60.4.389 - DOI
    1. Roux F.-E., et al. , “Language functional magnetic resonance imaging in preoperative assessment of language areas: correlation with direct cortical stimulation,” Neurosurgery 52, 1335–1347 (2003).NEQUEB10.1227/01.NEU.0000064803.05077.40 - DOI - PubMed
    1. Jöbsis F. F., “Noninvasive, infrared monitoring of cerebral and myocardial oxygen sufficiency and circulatory parameters,” Science 198(4323), 1264–1267 (1977).10.1126/science.929199 - DOI - PubMed