. 2019 Nov 11;4(6):645-652.
doi: 10.1002/lio2.324. eCollection 2019 Dec.

Three-dimensional imaging of upper esophageal sphincter resting pressure

Affiliations

Three-dimensional imaging of upper esophageal sphincter resting pressure

Shun-Ichi Chitose et al. Laryngoscope Investig Otolaryngol. .

Abstract

Objective: High-resolution manometry (HRM) is used to analyze upper esophageal sphincter (UES) physiology. Conventional HRM can yield imprecise measurements of UES resting pressure given its unidirectional sensors and averaging of circumferential pressure. In contrast, three-dimensional (3D) measurements can yield precise UES resting pressure data over the entire length of the UES. This study conducted a detailed analysis of UES resting pressure as evaluated by 3D-HRM.

Methods: Seventeen young, healthy adult participants (7 females and 10 males) were recruited. The 3D-HRM system used includes a pressure sensor catheter (outer diameter, 4 mm) and eight-channel transducers arranged circumferentially to acquire pressure data at 45° intervals. The catheter was inserted transnasally into the esophagus and automatically retracted at a speed of 1 mm/s. Participants performed the following tasks: maintain resting breathing, perform breath holding, and perform the Valsalva maneuver. Data were obtained and compared per millimeter over the longitudinal UES length.

Results: Clear 3D waveforms were identified, with greater mean UES pressures in anterior-posterior directions than in lateral directions (P < .05). The anterior distribution was located superior to the posterior portion. Significant differences were observed in mean UES pressures and UES resting integrals between resting breathing and the Valsalva maneuver (P < 0.05). No differences in functional UES length were observed.

Conclusions: The normal UES resting pressure was not directionally uniform in the luminal structure. 3D-HRM imaging of UES resting pressure can help deepen our understanding of UES physiology.

Level of evidence: 4.

Keywords: high‐resolution manometry; pharynx; resting pressure; swallowing pressure; upper esophageal sphincter.


Conflict of interest statement

The authors declare no potential conflicts of interest with respect to this study, authorship, and/or publication of this article.

Figures

Figure 1
Figure 1
A three‐dimensional (3D) high‐resolution manometry system. A pressure sensor catheter was prepared measuring 4 mm in outer diameter, with eight‐channel transducers (arrow) arranged circumferentially to acquire pressure data at 45° intervals (A,B). A recording and analysis software (Eight Star, Star Medical Inc.) on a personal computer and an automatic drawing device were used with the 3D‐high‐resolution manometry system (C)
Figure 2
Figure 2
Schematic views of measurement and definition of the high‐pressure zone. The catheter was retracted using an automatic drawing device (A). An eight‐channel transducer acquired circumferential pressure data. Sensors were grouped by averaging pairs of channels into four directions (B), as follows: posterior (channels 1‐2), left (channels 3‐4), anterior (channels 5‐6), and right (channels 7‐8). The high‐pressure zone was defined as the range within the pressure curve between the intersections of the pressure curve and the 85% line from the peak to the base line (C). CC, cricoid cartilage; CP, cricopharyngeal muscle
Figure 3
Figure 3
Monitor view during measurement. Forty pressure data points per second for each of the eight channels were acquired. The pressure waveforms were converted into three‐dimensional (3D) images and displayed. 3D waveforms of the upper esophageal sphincter showed a bimodal distribution of the high‐pressure zone in the anterior (arrow) and posterior (arrow head) portions (right upper: 3D cylindrical waveform; right lower: 3D development waveform)
Figure 4
Figure 4
Pressure curves from raw data and average trend line in four directions. The mean distance from the midline of the bilateral arytenoids to the highest trend line point (asterisk) was 2.4 cm. The anterior distribution was located superior to the posterior and bilateral distributions
Figure 5
Figure 5
Comparison of data in four directions (anterior, posterior, left, and right). The functional UES length was significantly shorter in the anterior direction than in other directions (A). Mean UES pressures were significantly higher in the anterior and posterior directions than in bilateral directions (B). UES resting integrals were significantly higher in the anterior and posterior directions than in bilateral directions (C). *P < .05. UES, upper esophageal sphincter
Figure 6
Figure 6
Comparisons of data during three tasks (resting breathing, breath holding, and Valsalva maneuver). No significant differences in functional UES length were noted between the three tasks (A). Mean UES pressure was significantly higher during resting breathing than during the Valsalva maneuver (B). The UES resting integral was significantly higher during resting breathing than during breath holding or the Valsalva maneuver (C). *P < .05. NS, not significant; UES, upper esophageal sphincter
Figure 7
Figure 7
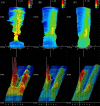
UES three‐dimensional (3D) waveform case example. A bimodal distribution of the HPZ in the anterior and posterior portions was clearly visualized during resting breathing (A). The HPZ during breath holding (B) and the Valsalva maneuver (C) was smaller than that during resting breathing (upper: 3D cylindrical waveform; lower: 3D development waveform). HPZ, high‐pressure zone; UES, upper esophageal sphincter

References

    1. Sivarao DV, Goyal RK. Functional anatomy and physiology of the upper esophageal sphincter. Am J Med. 2000;108(Suppl 4a):27S‐37S. - PubMed
    1. Palmer JB, Tanaka E, Ensrud E, et al. Motion of the posterior pharyngeal wall in human swallowing: a quantitative videofluorographic study. Arch Phys Med Rehabil. 2000;81:1520‐1526. - PubMed
    1. Clouse RE, Staiano A. Topography of the esophageal peristaltic pressure wave. Am J Physiol. 1991;261(4 Pt 1):G677‐G684. - PubMed
    1. Pandolfino JE, Roman S. High‐resolution manometry: an atlas of esophageal motility disorders and findings of GERD using esophageal pressure topography. Thorac Surg Clin. 2011;21:465‐475. - PMC - PubMed
    1. Takasaki K, Umeki H, Enatsu K, et al. Investigation of pharyngeal swallowing function using high‐resolution manometry. Laryngoscope. 2008;118:1729‐1732. - PubMed

LinkOut - more resources