Body Composition During Pregnancy Differs by Obesity Class
- PMID: 31891231
- PMCID: PMC6981013
- DOI: 10.1002/oby.22699
Body Composition During Pregnancy Differs by Obesity Class
Abstract
Objective: The aim of this study is to characterize changes in body composition during pregnancy in women with obesity.
Methods: Fifty-four healthy women with obesity (class 1, 30-34.9 kg/m2 : n = 25; class 2, 35-39.9 kg/m2 : n = 21; class 3, ≥ 40.0 kg/m2 : n = 8) expecting a singleton pregnancy were studied. Body composition was measured in early pregnancy (13-16 weeks), midpregnancy (24-27 weeks), and late pregnancy (35-37 weeks) using air displacement plethysmography, stable isotopes, and skinfold thickness measurements. Fasting glucose, insulin, and leptin were measured.
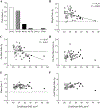
Results: The gain in fat-free mass was lower in the second trimester compared with the third (2.7 ± 0.2 to 5.3 ± 0.2 kg; P < 0.001), whereas fat mass accumulation declined over time (0.6 ± 0.3 to -0.7 ± 0.4 kg; P = 0.005). Women with class 1 and 2 obesity gained 1.1 ± 0.7 kg of fat mass during pregnancy, while women with class 3 obesity lost 4.1 ± 0.6 kg (both P < 0.001). The difference in fat accumulation between obesity classes was observed only in the second trimester (P = 0.02). Gestational weight gain was associated positively with changes in plasma concentrations of insulin, leptin, and insulin resistance (all P < 0.01).
Conclusions: Gestational weight gain in pregnancy differs by obesity class and trimester. Women with class 3 obesity gain less body weight and fat mass. Fat mass gain is most likely preventable in the second trimester.
© 2019 The Obesity Society.
Conflict of interest statement
Figures


Similar articles
-
Dietary quality influences body composition in overweight and obese pregnant women.Clin Nutr. 2019 Aug;38(4):1613-1619. doi: 10.1016/j.clnu.2018.08.029. Epub 2018 Aug 31. Clin Nutr. 2019. PMID: 30224302
-
Maternal fat, but not lean, mass is increased among overweight/obese women with excess gestational weight gain.Am J Obstet Gynecol. 2016 Jun;214(6):745.e1-5. doi: 10.1016/j.ajog.2015.12.026. Epub 2015 Dec 21. Am J Obstet Gynecol. 2016. PMID: 26719212 Free PMC article.
-
A randomized longitudinal dietary intervention study during pregnancy: effects on fish intake, phospholipids, and body composition.Nutr J. 2015 Jan 2;14:1. doi: 10.1186/1475-2891-14-1. Nutr J. 2015. PMID: 25554072 Free PMC article. Clinical Trial.
-
Offspring body size and metabolic profile - effects of lifestyle intervention in obese pregnant women.Dan Med J. 2014 Jul;61(7):B4893. Dan Med J. 2014. PMID: 25123127 Review.
-
Effect of maternal metabolism on fetal growth and body composition.Diabetes Care. 1998 Aug;21 Suppl 2:B85-90. Diabetes Care. 1998. PMID: 9704233 Review.
Cited by
-
Disease Course and Long-term Outcomes in Pregnant Women With Idiopathic Intracranial Hypertension: The IIH Prospective Maternal Health Study.Neurology. 2023 Apr 11;100(15):e1598-e1610. doi: 10.1212/WNL.0000000000206854. Epub 2023 Feb 7. Neurology. 2023. PMID: 36750388 Free PMC article.
-
Position statement of Italian Society of Obesity (SIO): Gestational Obesity.Eat Weight Disord. 2024 Sep 27;29(1):61. doi: 10.1007/s40519-024-01688-y. Eat Weight Disord. 2024. PMID: 39331227 Free PMC article. Review.
-
Nutrition and Metabolic Adaptations in Physiological and Complicated Pregnancy: Focus on Obesity and Gestational Diabetes.Front Endocrinol (Lausanne). 2020 Nov 30;11:611929. doi: 10.3389/fendo.2020.611929. eCollection 2020. Front Endocrinol (Lausanne). 2020. PMID: 33424775 Free PMC article. Review.
-
Analysis and Reliability of Anthropometric Measurements during Pregnancy: A Prospective Cohort Study in 208 Pregnant Women.J Clin Med. 2021 Aug 31;10(17):3933. doi: 10.3390/jcm10173933. J Clin Med. 2021. PMID: 34501380 Free PMC article.
-
Maternal anthropometric measurements and correlation to maternal and fetal outcomes in late pregnancy.Womens Health (Lond). 2022 Jan-Dec;18:17455065221076737. doi: 10.1177/17455065221076737. Womens Health (Lond). 2022. PMID: 35107042 Free PMC article.
References
-
- Institute of Medicine (US) and National Research Council (US) Committee to Reexamine IOM Pregnancy Weight Guidelines. Determining Optimal Weight Gain In: Rasmussen KM, Yaktine AL (eds). Weight Gain During Pregnancy: Reexamining the Guidelines: Washington (DC), 2009. - PubMed
-
- Laitinen J, Jaaskelainen A, Hartikainen AL, Sovio U, Vaarasmaki M, Pouta A, et al. Maternal weight gain during the first half of pregnancy and offspring obesity at 16 years: a prospective cohort study. BJOG 2012;119: 716–723. - PubMed
Publication types
MeSH terms
Grants and funding
LinkOut - more resources
Full Text Sources
Medical

