

Trends in Diagnostic Imaging Utilization among Medicare and Commercially Insured Adults from 2003 through 2016
- PMID: 31891320
- PMCID: PMC6996668
- DOI: 10.1148/radiol.2019191116
Trends in Diagnostic Imaging Utilization among Medicare and Commercially Insured Adults from 2003 through 2016
Abstract
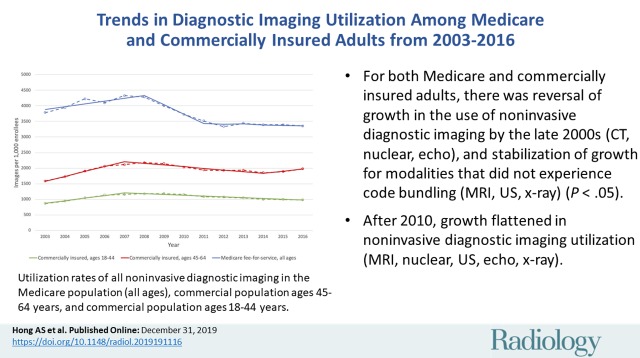
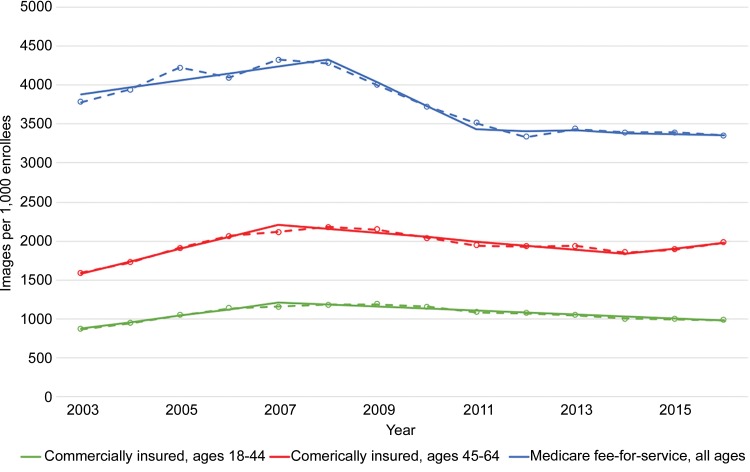
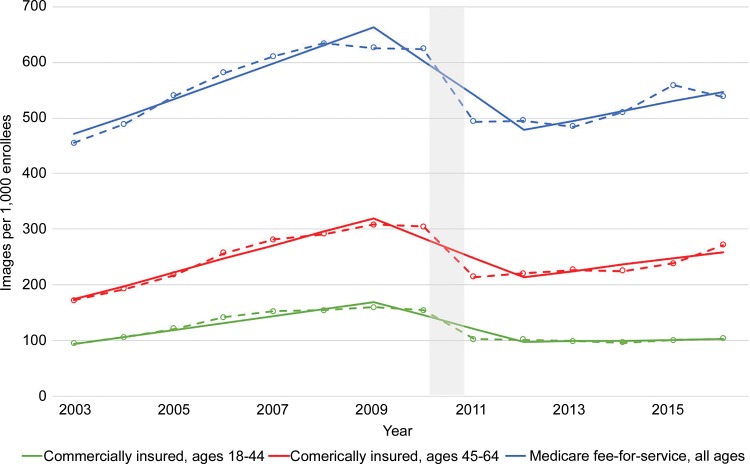
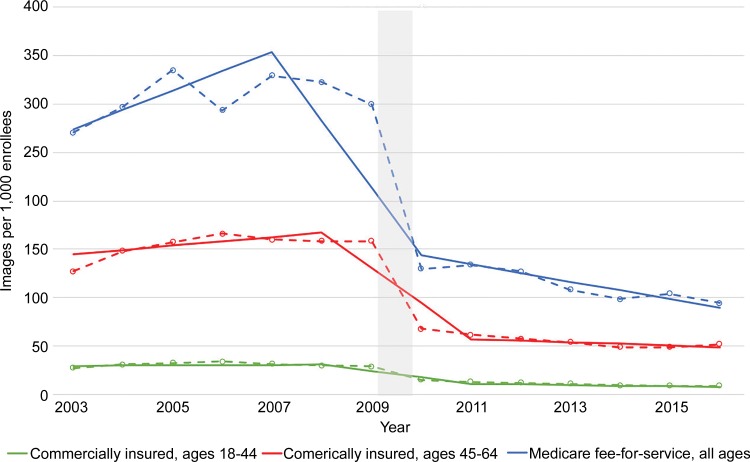
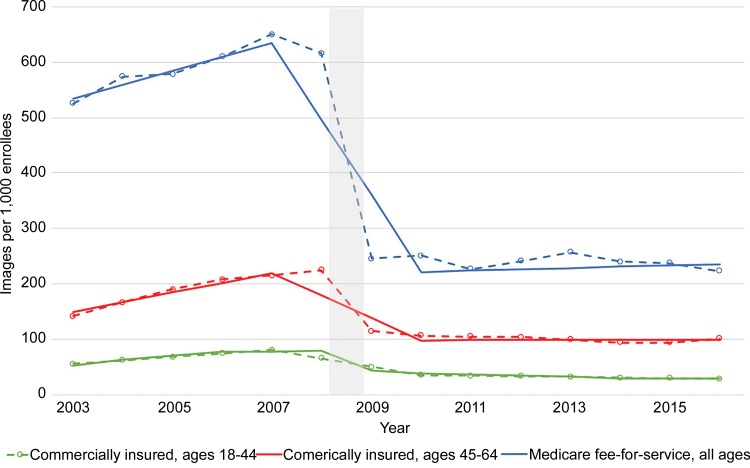
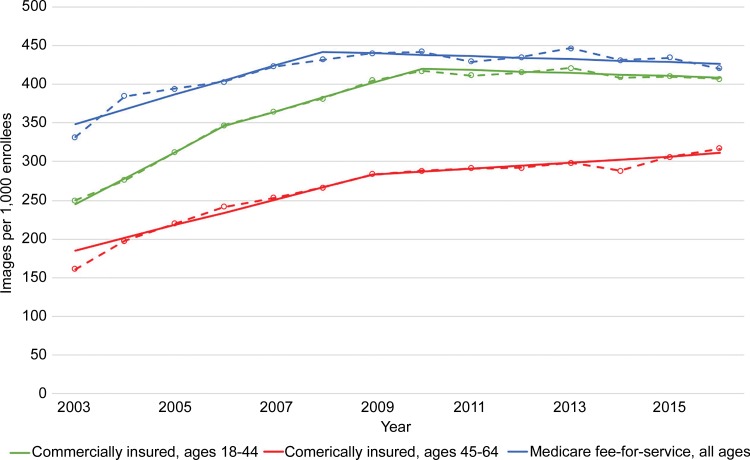
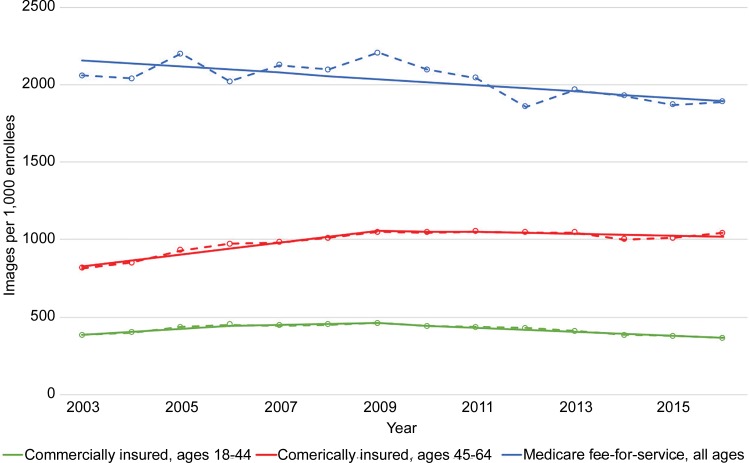
Background Trends in noninvasive diagnostic imaging (NDI) utilization rates have predominantly been reported in Medicare enrollees. To the authors' knowledge, there has been no prior direct comparison of utilization rates between Medicare and commercially insured patients. Purpose To analyze trends in NDI utilization rates by modality, comparing Medicare fee-for-service and commercially insured enrollees. Materials and Methods This study was a retrospective trend analysis of NDI performed between 2003 and 2016 as reported in claims databases for all adults enrolled in fee-for-service Medicare and for roughly 9 million commercially insured patients per year. The commercially insured patients were divided into two populations: those aged 18-44 years and those aged 45-64 years. The same procedure code definitions for NDI were applied to both Medicare and commercial claims, rates were calculated per 1000 enrollees, and trends were reported over time in aggregate followed by modality (CT, MRI, nuclear imaging, echocardiography, US, radiography). Join-point regression was used to model annual rates and to identify statistically significant (P < .05) changes in trends. Results In almost all instances, Medicare enrollees had the highest utilization rate for each modality, followed by commercially insured patients aged 45-64 years, then aged 18-44 years. All three populations showed utilization growth through the mid to late 2000s (images per 1000 enrollees per year for Medicare: 91 [95% confidence interval {CI}: 34, 148]; commercially insured patients aged 45-64 years: 158 [95% CI: 130, 186]; aged 18-44 years: 83 [95% CI: 69, 97]), followed by significant declining trends from the late 2000s through early 2010s (images per 1000 enrollees per year for Medicare: -301 [95% CI: -510, -92]; commercially insured patients aged 45-64 years: -54 [95% CI: -69, -39]; aged 18-44 years: -26 [95% CI: -31, -21]) coinciding with code-bundling events instituted by Medicare (CT, nuclear imaging, echocardiography). There were significant trend changes in modalities without code bundling (MRI, radiography, US), although flat trends mostly were exhibited. After the early 2010s, there were significant trend changes largely showing flat utilization growth. The notable exception was a significant trend change to renewed growth of CT imaging among commercially insured patients aged 45-64 years and Medicare enrollees after 2012, although at half the prior rate (images per 1000 enrollees per year for Medicare: 17 [95% CI: 6, 28]; commercially insured patients aged 45-64 years: 11 [95% CI: 2, 20]). Conclusion Noninvasive diagnostic imaging utilization trends among commercially insured individuals are similar to those in Medicare enrollees, although at lower rates. Earlier rapid growth has ceased and, except for CT, utilization has stabilized since the early 2010s. © RSNA, 2019 See also the editorial by Hentel and Wolk in this issue.
Figures
Comment in
-
Comparing Utilization of Diagnostic Imaging between Medicare and Commercially Insured Populations: Why Does It Matter?Radiology. 2020 Feb;294(2):351-352. doi: 10.1148/radiol.2020192584. Epub 2019 Dec 31. Radiology. 2020. PMID: 31895007 No abstract available.
References
-
- Burkhardt JH, Sunshine JH. . Utilization of radiologic services in different payment systems and patient populations . Radiology 1996. ; 200 ( 1 ): 201 – 207 . - PubMed
-
- Bhargavan M, Sunshine JH. . Utilization of radiology services in the United States: levels and trends in modalities, regions, and populations . Radiology 2005. ; 234 ( 3 ): 824 – 832 . - PubMed
-
- Levin DC, Rao VM, Parker L, Frangos AJ, Sunshine JH. . Bending the curve: the recent marked slowdown in growth of noninvasive diagnostic imaging . AJR Am J Roentgenol 2011. ; 196 ( 1 ): W25 – W29 . - PubMed
-
- Levin DC, Rao VM, Parker L, Frangos AJ. . The sharp reductions in Medicare payments for noninvasive diagnostic imaging in recent years: will they satisfy the federal policymakers? J Am Coll Radiol 2012. ; 9 ( 9 ): 643 – 647 . - PubMed
Publication types
MeSH terms
Grants and funding
LinkOut - more resources
Full Text Sources
Medical
