Review
. 2020 May 1;143(5):1315-1331.
doi: 10.1093/brain/awz384.

A multiomics approach to heterogeneity in Alzheimer's disease: focused review and roadmap

Affiliations
Review

A multiomics approach to heterogeneity in Alzheimer's disease: focused review and roadmap

AmanPreet Badhwar et al. Brain. .

Abstract

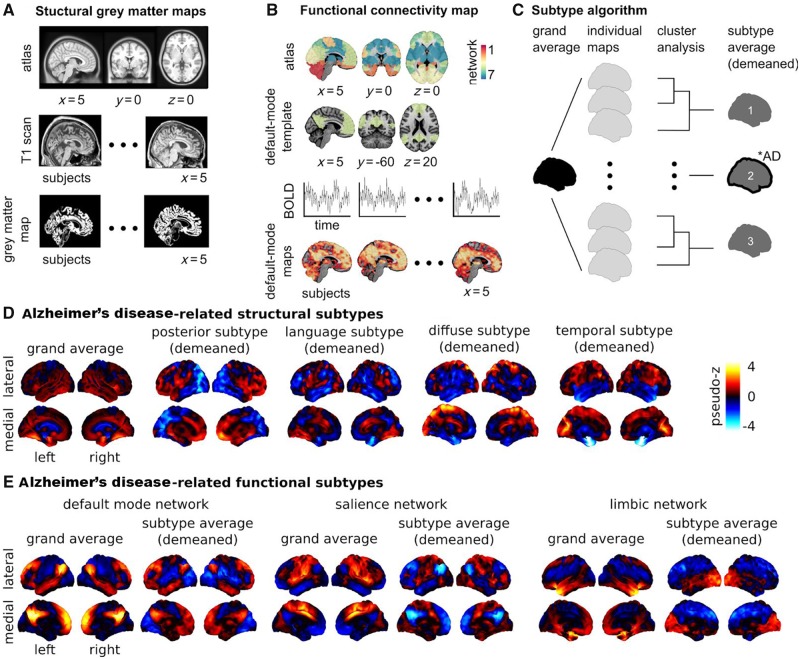
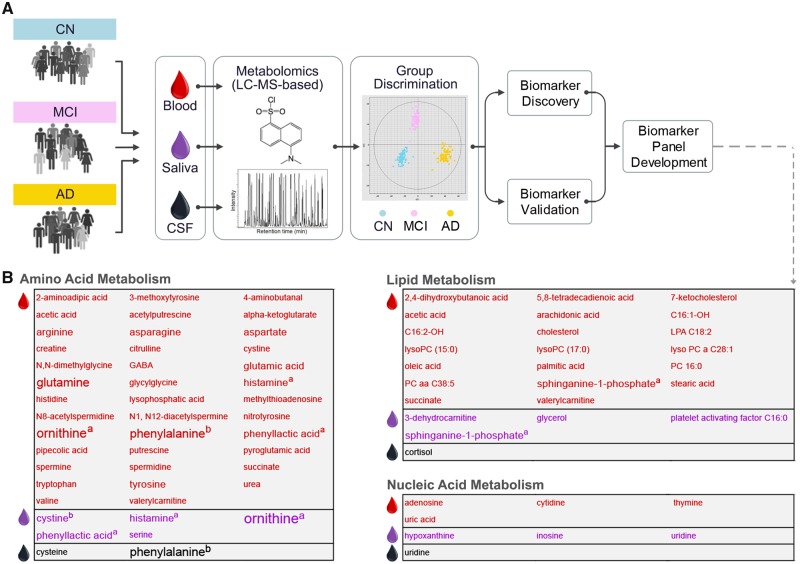
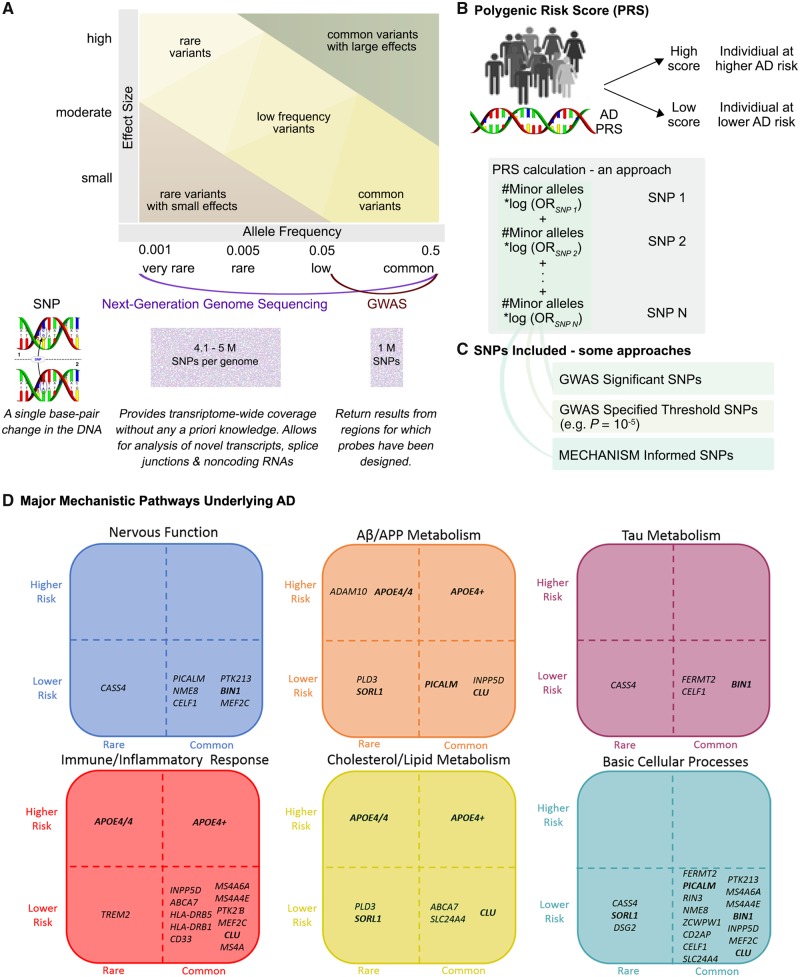
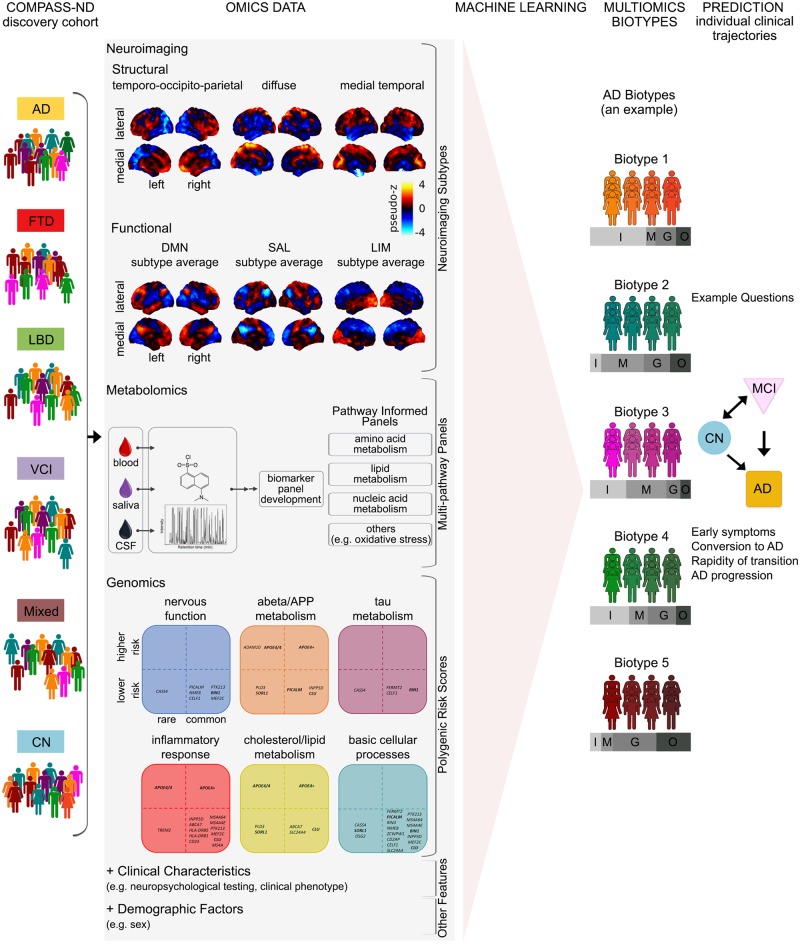
Aetiological and clinical heterogeneity is increasingly recognized as a common characteristic of Alzheimer's disease and related dementias. This heterogeneity complicates diagnosis, treatment, and the design and testing of new drugs. An important line of research is discovery of multimodal biomarkers that will facilitate the targeting of subpopulations with homogeneous pathophysiological signatures. High-throughput 'omics' are unbiased data-driven techniques that probe the complex aetiology of Alzheimer's disease from multiple levels (e.g. network, cellular, and molecular) and thereby account for pathophysiological heterogeneity in clinical populations. This review focuses on data reduction analyses that identify complementary disease-relevant perturbations for three omics techniques: neuroimaging-based subtypes, metabolomics-derived metabolite panels, and genomics-related polygenic risk scores. Neuroimaging can track accrued neurodegeneration and other sources of network impairments, metabolomics provides a global small-molecule snapshot that is sensitive to ongoing pathological processes, and genomics characterizes relatively invariant genetic risk factors representing key pathways associated with Alzheimer's disease. Following this focused review, we present a roadmap for assembling these multiomics measurements into a diagnostic tool highly predictive of individual clinical trajectories, to further the goal of personalized medicine in Alzheimer's disease.

Keywords: Alzheimer’s disease; metabolite panel; multiomics biomarkers; neuroimaging subtype; polygenic risk score.


Figures

Figure 1
Figure 1
Brain morphology and connectomics Alzheimer’s disease-related subtypes. Neuroimaging provides insight into the effect of neurodegeneration on brain health. There exist different tools that can capture distinct, yet complementary, aspects of brain structure and function. The most established neuroimaging marker of neurodegeneration is grey matter atrophy, measured by structural MRI. Structural MRI is a non-invasive technique widely used in both research and clinical practice. To generate structural maps, individual structural MRI scans are first spatially aligned to a reference template or atlas (A). Then for each individual and each voxel (smallest volume element in MRI data), a metric characterizing the local structure of the grey matter is generated, such as (A) grey matter volume, cortical thickness or surface area. Using these approaches, it is possible to monitor the thinning of grey matter, which likely reflects the death of neuronal cell bodies at advanced stages of neurodegeneration. Synaptic disruption is an early event in Alzheimer’s disease (Sperling et al., 2011), and functional networks may have the ability to compensate the impact of neurodegeneration on cognitive symptoms (Franzmeier et al., 2017). For these reasons, intrinsic functional connectivity from resting state functional MRI is an emerging Alzheimer’s disease biomarker that holds promise for early diagnosis (Sperling et al., 2011; Badhwar et al., 2017). To analyse resting state functional MRI, select regions in canonical brain networks previously established in the literature are generally considered (B). An individual resting state functional MRI connectivity map can be generated for different networks, with the default mode, limbic, and salience networks being the key components affected by Alzheimer’s disease (Badhwar et al., 2017) (B). Structural and functional brain maps can enter a subtyping procedure, which identifies groups of individuals with homogeneous brain maps (C).The number of subtypes are defined a priori or through various metrics for model selection (Seghier, 2018), for example n = 3 in C. A subtype map is generated by averaging the maps within each subgroup and subtracting the grand average (i.e. demeaned) to emphasize the features of the subtype. Chi square statistics are applied to identify groups that include a greater number of Alzheimer’s disease patients than expected by chance (illustrated by a ‘*AD’ annotation for subtype 2 in C). (D) The subtyping procedure was applied on maps of grey matter density from cognitively normal and Alzheimer’s disease dementia individuals in the ADNI database (n = 377). Four of seven subtypes were identified as Alzheimer’s disease dementia-related (results adapted from Tam et al., 2019). Three subtypes were consistent with previous reports: posterior (or temporo-occipito-parietal-predominant), diffuse, and temporal (or medial temporal-predominant) atrophy subtypes. A novel language atrophy subtype was also identified. (E) The subtype procedure was applied to resting state functional MRI data collected on cognitively normal, MCI, and Alzheimer’s disease dementia individuals in a dataset pooling ADNI2 with several independent samples (n = 130). Three subtypes were extracted for three resting state networks known to be impacted by Alzheimer’s disease: default mode, salience, and limbic (Badhwar et al., 2017). One Alzheimer’s disease dementia/MCI-related subtype was found for each network. The salience and default mode followed similar patterns: increased within-network connectivity, and a lower (negative) connectivity between networks. The limbic subtypes showed lower connectivity with frontal regions, and increased connectivity with occipital regions. Results adapted from Orban et al. (2017b). The section on ‘Brain subtypes’ compares results from the abovementioned and other studies with similar approaches and objectives. Supplementary Table 1 provides detailed characteristics of the 12 neuroimaging subtyping studies (structural MRI and resting state functional MRI) that met our search criteria. BOLD = blood oxygenation level-dependent signal.
Figure 2
Figure 2
A typical Alzheimer’s disease metabolomics biomarker discovery pipeline. Metabolomics is a relatively recent addition to the systems biology toolkit for the study of NDDs of ageing (Wilkins and Trushina, 2017). It encompasses the global study of small molecules (50–1500 Da in mass) that are substrates and products of metabolism. Together, these metabolites (e.g. amino acids, antioxidants, vitamins) represent the overall physiological status of the organism. An individual’s metabolic activity is influenced by an individual’s genotype and environment (Kaddurah-Daouk et al., 2011). Analysis of the metabolome, therefore, provides an opportunity to study the dynamic molecular phenotype of an individual. Untargeted metabolomics approaches are increasingly used to compare two or more groups (e.g. Alzheimer’s disease dementia and cognitively normal participants) and identify metabolite profiles associated with a disease. These profiles provide insight into underlying disease mechanisms, as well as constitute candidates for biomarker discovery and drug development. In the field of Alzheimer’s disease research, metabolomics studies (targeted and untargeted) over the past decade have examined several biofluids and tissues, including serum, plasma, CSF, saliva, urine, and brain tissue (Wilkins and Trushina, 2017). Technologies include NMR (nuclear magnetic resonance) spectroscopy and mass spectrometry. (A) A typical Alzheimer’s disease metabolomics biomarker discovery pipeline using mass spectrometry (MS)-liquid chromatography (LC) is depicted. Subsequent to metabolite extraction, identification, and quantification, most studies apply multivariate statistical methods to the metabolome data to identify the top discriminant metabolites. These can be further combined into metabolite panels to increase discriminative power (i.e. sensitivity and specificity) in Alzheimer’s disease prediction and progression (Liang et al., 2015, 2016; Huan et al., 2018). Significant discriminative power is commonly tested with the receiver operating characteristic curve analysis (AUC values). Discriminant metabolite panels are then validated in independent samples. Following discriminant metabolite(s) discovery, researchers conduct pathway and network analyses, which provide crucial mechanistic insights into the sequences of processes leading to the heterogeneous phenotypes of neurodegeneration. Pathway analysies focus on identifying sequences of processes that lead to the presence of a discriminant metabolite. Network analyses examine how discriminant metabolites are connected to each other within Alzheimer’s disease and related dementias. (B) The three main metabolism pathways (namely, amino acid, lipid and nucleic acid) that 90 Alzheimer’s disease-associated metabolites in our review (n = 11 publications, Supplementary Table 2) were found to belong. The text colour indicates the biofluid metabolome each metabolite was identified in: red = serum or plasma, purple = saliva, black = CSF. A larger font size indicates that the metabolite was identified in more than one study (Supplementary Table 3) The maximum number of studies a metabolite was detected in our review was four. aPresence in plasma or serum and saliva. bPresence in plasma or serum and CSF. AD = Alzheimer’s disease; CN = cognitively normal.
Figure 3
Figure 3
Polygenic risk scores. High-throughput genotyping technologies have revolutionized studies in diseases with complex genetics by enabling detection of common genetic variants with low effect sizes, and rarer variants with relatively higher effect sizes (A). In Alzheimer’s disease, the prevalent late-onset variant is genetically complex and demonstrates high heritability (up to 80%) (Gatz et al., 2006), whereas the early-onset familial variant is deterministically driven by single gene mutation(s) in PSEN1 (presenilin 1), PSEN2 (presenilin 2) or APP (amyloid precursor protein) (Guerreiro et al., 2013). The genetics of late-onset Alzheimer’s disease has been predominantly investigated using GWAS. Designed to rapidly scan for statistical links between a set of known SNPs and a phenotype of interest, GWAS can identify common variants with minor allele frequency >5% (Torkamani et al., 2018) (A). Up to 24 key Alzheimer’s disease-risk genes have been identified using GWAS (Supplementary Table 4). The major limitation (and strength) of GWAS is the data-driven, hypothesis-free approach in which multiple genes are identified, though the majority of significant SNPs are (i) located in non-coding or gene-rich areas of the genome making it difficult to identify which gene is being modified by the SNP; and (ii) in high linkage disequilibrium with many SNPs making it difficult to identify which functional variant is responsible for modifying Alzheimer’s disease risk (Karch et al., 2016). Identification of rarer Alzheimer’s disease-associated SNPs (minor allele frequency >0.5% and <5%), that often escape detection with GWAS, is being enabled by next-generation genome sequencing (NGS) technologies, such as whole-exome sequencing and targeted resequencing of disease-associated genes (Bras et al., 2012; Masellis et al., 2013) (Supplementary Table 4). NGS technologies provide transcriptome-wide coverage without requiring any a priori knowledge of SNPs (A). To date, Alzheimer’s disease prediction using individual, high-throughput genotyping technologies identified, risk genes have been predominantly non-significant, with the exception of APOE, which accounts for up to 30% of the genetic risk (Daw et al., 2000). Therefore, the search for risk genes beyond APOE now include PRS (also referred to as genetic risk scores, risk indexes or scales) approaches (B). A PRS is a calculation (e.g. weighted sum) based on the number of risk alleles carried by an individual, where the risk alleles and their weights are defined by GWAS-detected loci and their measured effects (Torkamani et al., 2018). In the most common scenario, only SNPs reaching conventional GWAS significance (P < 5 × 10⁻⁸) are included (C). A threshold lower than the genome-wide statistical significance (e.g. P = 10−5) can also be used to improve or estimate total predictability (Torkamani et al., 2018) (C). SNPs representing multiple hits among Alzheimer’s disease risk genes from one or more major mechanistic pathways can also be included into a PRS (C). Displayed are six main mechanistic clusters, each populated by genetic variants thought to represent the cluster (D). Genetic variants have been placed within the cluster according to population frequency (horizontal axis) and level of estimated risk (vertical axis). For example, an amyloid-β/APP metabolism cluster is made up of rare ADAM10 (a disintegrin and metalloproteinase domain-containing protein 10) and common APOE4+ higher risk genes, and rare PLD3 (phospholipase D family member 3) and common PICALM (phosphatidylinositol binding clathrin assembly protein) lower risk genes. Some genes are involved with multiple mechanisms as can be seen for PICALM’s involvement in nervous function, basic cellular processes, and amyloid-β/APP metabolism. As implied in the figure, when creating PRS, it may be very useful to select genes within mechanistic groups, and select groups depending on the purpose of the research. In sum, PRS reflects a large number of SNPs and a complex set of biological mechanisms related to Alzheimer’s disease pathogenesis, and can improve the precision of early Alzheimer’s disease risk or diagnosis (Desikan et al., 2017; Escott-Price et al., 2017b; Morgan et al., 2017).
Figure 4
Figure 4
Proposed roadmap to discovering multiomics Alzheimer’s disease biomarkers. COMPASS-ND: The COMPASS-ND cohort is composed of individuals with various types of dementia or cognitive complaints, as well as healthy, cognitively normal individuals. Omics data: Performing dimension reduction for omics data. Featured as examples are some of the results of our review of the Alzheimer’s disease literature as presented in the paper. Machine learning, Multiomics biotypes and Prediction: These panels demonstrate how signatures of neurodegeneration derived from the integration of multiomics data using machine learning techniques will better identify individuals on an Alzheimer’s disease spectrum trajectory. While our proposed roadmap addresses multiomics biomarkers for Alzheimer’s disease, a similar approach can be used for other neurodegenerative diseases of ageing. AD = Alzheimer's disease; CN = cognitively normal; DMN = default mode network; FTD = frontotemporal dementia; G = genomics features; I = imaging features; LBD = Lewy body disease; LIM = limbic network; M = metabolic features; Mixed = mixed aetiology dementia; O = demographic features; SAL = salience network; SCI = subjective cognitive impairment; VCI = vascular cognitive impairment.

References

    1. Abraham A, Milham MP, Di Martino A, Craddock RC, Samaras D, Thirion B, et al.Deriving reproducible biomarkers from multi-site resting-state data: An Autism-based example. Neuroimage 2017; 147: 736–45. - PubMed
    1. Adams HHH, de Bruijn RFAG, Hofman A, Uitterlinden AG, van Duijn CM, Vernooij MW, et al.Genetic risk of neurodegenerative diseases is associated with mild cognitive impairment and conversion to dementia. Alzheimers Dement 2015; 11: 1277–85. - PubMed
    1. Anstey KJ, Eramudugolla R, Hosking DE, Lautenschlager NT, Dixon RA. Bridging the translation gap: from Dementia risk assessment to advice on risk reduction. J Prev Alzheimers Dis 2015; 2: 189–98. - PMC - PubMed
    1. Badhwar A, Tam A, Dansereau C, Orban P, Hoffstaedter F, Bellec P. Resting-state network dysfunction in Alzheimer’s disease: a systematic review and meta-analysis. Alzheimers Dement 2017; 8: 73–85. - PMC - PubMed
    1. Beach TG, Monsell SE, Phillips LE, Kukull W. Accuracy of the clinical diagnosis of Alzheimer disease at National Institute on Aging Alzheimer Disease Centers, 2005-2010. J Neuropathol Exp Neurol 2012; 71: 266–73. - PMC - PubMed

Publication types