. 2020 Jul;52(2):2915-2930.
doi: 10.1111/ejn.14665. Epub 2020 Feb 24.

Electrical stimulation of the ventral tegmental area evokes sleep-like state transitions under urethane anaesthesia in the rat medial prefrontal cortex via dopamine D1 -like receptors

Affiliations

Electrical stimulation of the ventral tegmental area evokes sleep-like state transitions under urethane anaesthesia in the rat medial prefrontal cortex via dopamine D1 -like receptors

Sabine Gretenkord et al. Eur J Neurosci. 2020 Jul.

Abstract

The role of dopamine in regulating sleep-state transitions during, both natural sleep and under anaesthesia, is still unclear. Recording in vivo in the rat mPFC under urethane anaesthesia, we observed predominantly slow wave activity (SWA) of <1 Hz in the local field potential interrupted by occasional spontaneous transitions to a low-amplitude-fast (LAF) pattern of activity. During periods of SWA, transitions to LAF activity could be rapidly and consistently evoked by electrical stimulation of the ventral tegmental area (VTA). Spontaneous LAF activity, and that evoked by stimulation of the VTA, consisted of fast oscillations similar to those seen in the rapid eye movement (REM)-like sleep state. Spontaneous and VTA stimulation-evoked LAF activity occurred simultaneously along the dorsoventral extent of all mPFC subregions. Evoked LAF activity depended on VTA stimulation current and could be elicited using either regular (25-50 Hz) or burst stimulation patterns and was reproducible upon repeated stimulation. Simultaneous extracellular single-unit recordings showed that during SWA, presumed pyramidal cells fired phasically and almost exclusively on the Up state, while during both spontaneous and VTA-evoked LAF activity, they fired tonically. The transition to LAF activity evoked by VTA stimulation depended on dopamine D1 -like receptor activation as it was almost completely blocked by systemic administration of the D1 -like receptor antagonist SCH23390. Overall, our data demonstrate that activation of dopamine D1 -like receptors in the mPFC is important for regulating sleep-like state transitions.

Keywords: Oscillations; REM-like; Up state; slow wave activity.


Conflict of interest statement

The authors have no conflicts of interest, financial or otherwise, to declare.

Figures

Figure 1
Figure 1
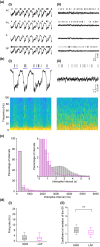
Spontaneous transitions from SWA to LAF activity under urethane anaesthesia. (a) Local field potential trace recorded in the PrL subregion of the mPFC shows oscillatory activity changes from SWA activity to LAF. (b) Spectrograms and (c) expanded traces taken as indicated from the local field potential in (a) during (i) SWA (ii), during the transitions from SWA‐LAF activity and (iii) during LAF activity. (d) Local field potential trace recorded in the PrL subregion of the mPFC shows oscillatory activity changes from LAF activity to SWA. (e) Spectrograms and (f) expanded traces taken as indicated from the field potential in (d) during (i) LAF (ii), during the transitions from LAF activity to SWA and (iii) during SWA [Colour figure can be viewed at wileyonlinelibrary.com]
Figure 2
Figure 2
Spontaneous transitions from SWA to LAF activity are associated with changes in mPFC unit firing properties. (ai) SWA activity recorded simultaneously in all subregions of the mPFC including the anterior cingulate (AC), prelimbic (PrL), infralimbic (IL) and dorsopeduncular (DP) cortices. Vertical lines show individual spike patterns from single neurons recorded simultaneously in mPFC subregions (except IL). Firing during SWA is phasic with spikes restricted to the Up state (corresponding to the downward deflection of the local field potential). (aii) Local field potential during the same recording session showing spontaneous LAF activity was present simultaneously in all mPFC subregions. The same neurons shown in (ai) now fire tonically during spontaneous LAF activity. (b) Expanded time scale showing the PrL channel recording during (bi) SWA and (bii) spontaneous LAF activity with corresponding spectrograms. During SWA, spiking is restricted to the Up state (blue line), but continuous firing occurs during spontaneous LAF activity. (c) Histogram of ISI distribution, 19 units (grouped in 250 ms bins) for SWA (grey) and LAF activity (magenta). Inset (truncated for clarity) shows more frequent long ISIs in SWA reflecting the phasic firing with spikes restricted to the Up state. di) Box plot shows the median (IQR) firing rate (Hz) for all units (n = 19) recorded during SWA and spontaneous LAF activity were not significantly different. (dii) Box plot of CV for units (n = 16) shows a significant (p = .003) decrease in CV during spontaneous LAF activity (3 units which stopped firing during LAF were removed) [Colour figure can be viewed at wileyonlinelibrary.com]
Figure 3
Figure 3
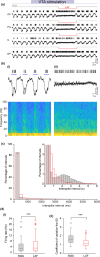
Electrical stimulation of the VTA evokes a state switch from SWA to LAF activity. (a) Local field potential recordings for each mPFC subregion; anterior cingulate (AC), prelimbic (PrL), infralimbic (IL) and dorsopeduncular (DP) cortices. VTA electrical stimulation (purple bar) evoked a transition to LAF activity simultaneously in all mPFC subregions (LAF detection indicated by text above red line).Vertical lines show unit firing for one neuron from each mPFC subregion and illustrates the transition from phasic firing on the Up state to tonic firing during LAF activity. (b) Expanded time scale showing the PrL channel recording during (bi) SWA and (bii) VTA stimulation‐evoked LAF activity with corresponding spectrograms. During SWA activity spiking is restricted to the Up state (blue line) but continuous firing occurs during VTA stimulation‐evoked LAF activity. (c) Histogram of ISI distribution (grouped in 250 ms bins) for SWA (grey) and VTA stimulation‐evoked LAF activity (red). Inset (truncated for clarity) shows more frequent long ISIs in SWA reflecting the phasic firing with spikes restricted to the Up state. (di) Box plot shows the median (IQR) for all units (n = 62) showing firing rate significantly increased (p = .000098) during VTA stimulation‐evoked LAF activity. (dii) Box plot shows the median (IQR) for all units showing a significant decrease in CV during VTA stimulation‐evoked LAF activity (p = 1.44 x 10−10, n = 56, (6 units that either stopped firing during LAF or had only ISI's > 1,500 ms were removed)) [Colour figure can be viewed at wileyonlinelibrary.com]
Figure 4
Figure 4
Low‐amplitude‐fast (LAF) activity can be induced by different VTA stimulation parameters (LAF activity indicated by red lines). (a) Extracellular field recordings from the PrL region showing that during SWA VTA stimulation (purple bar) at 25 Hz with either (ai) a burst pattern or (aii) regular stimulation pattern could evoke short periods of LAF activity. Increasing the VTA stimulation frequency to 50 Hz (aiii) elicited a longer period of LAF activity, after a short delay, which returned to SWA on cessation of the stimulation. Increasing the stimulus intensity to 0.28 mA (aiv) then caused a rapid transition to LAF that lasted a few seconds after cessation of the stimulation. (bi–iii) Three repeated 30 s VTA stimulations (50 Hz regular, 0.2 mA) at 10 min intervals evoked similar transitions from SWA to LAF activity. (c) Box plot shows no significant difference in median (IQR) time in LAF activity for the group data (n = 19 animals) for 3 repeated VTA stimulations at the same intensity [Colour figure can be viewed at wileyonlinelibrary.com]
Figure 5
Figure 5
VTA stimulation‐evoked transition to LAF activityis dependent on D1‐like receptor activity. (a–c) Example local field potential recordings in the PrL cortex during SWA showing effects of VTA stimulation (50 Hz, 30 s, purple bar). (ai) Response to the third (Base3) of three baseline VTA stimulations given at 10 min intervals and (aii) the third VTA stimulation given at 10 min intervals following an i.p. injection of saline (Sal3). (aiii) Box plot shows the group data for the time in LAF activity (s) following all three baseline (Base1‐3) VTA stimulations and all three stimulations following an i.p. injection of saline (Sal1‐3). Systemic application of saline had no significant effects on the time in LAF activity. (bi) In a separate experiment response to the third baseline (Base3) of three baseline VTA stimulations given at 10 min intervals and (bii) the third VTA stimulation given at 10 min intervals following an i.p. injection of the D1‐like receptor antagonist SCH23390 at 0.3 mg/kg (SCH(0.3)3). (biii) Box plot shows the group data for the time in LAF activity (s) following all three baseline (Base1‐3) VTA stimulations and all three stimulations following an i.p. injection of SCH23390 (SCH1‐3). Systemic application of the D1‐like receptor antagonist SCH23390 at 0.3 mg/kg caused a significant reduction in the time in LAF activity 20 and 30 min post‐injection (SCH2 and SCH3). (ci) In a separate experiment, response to the third baseline (Base3) of three baseline VTA stimulations given at 10 min intervals and (cii) the third VTA stimulation given at 10 min intervals following an i.p. injection of SCH23390 at 0.6 mg/kg (SCH(0.6)3). (ciii) Box plot shows the group data for the time in LAF activity (s) following all three baseline (Base1‐3) VTA stimulations and all three stimulations following an i.p. injection of SCH23390 (SCH1‐3). Systemic application of the D1‐like receptor antagonist SCH23390 at 0.6 mg/kg caused a rapid and significant reduction in the time in LAF activity for all post‐injection stimulations (SCH1‐3). Key: c = different to Base3, b = different to Base2, a = different to Base1. For full statistical analysis see text [Colour figure can be viewed at wileyonlinelibrary.com]

Similar articles

Cited by

References

    1. Amara, A. W. , Chahine, L. M. , & Videnovic, A. (2017). Treatment of sleep dysfunction in Parkinson's disease. Current Treatment Options in Neurology, 19, 26 10.1007/s11940-017-0461-6 - DOI - PMC - PubMed
    1. Bartho, P. , Slezia, A. , Matyas, F. , Faradzs‐Zade, L. , Ulbert, I. , Harris, K. D. , & Acsady, L. (2014). Ongoing network state controls the length of sleep spindles via inhibitory activity. Neuron, 82, 1367–1379. 10.1016/j.neuron.2014.04.046 - DOI - PMC - PubMed
    1. Beltramo, R. , D'Urso, G. , Dal Maschio, M. , Farisello, P. , Bovetti, S. , Clovis, Y. , … Fellin, T. (2013). Layer‐specific excitatory circuits differentially control recurrent network dynamics in the neocortex. Nature Neuroscience, 16, 227–234. 10.1038/nn.3306 - DOI - PubMed
    1. Boutrel, B. , & Koob, G. F. (2004). What keeps us awake: The neuropharmacology of stimulants and wakefulness‐promoting medications. Sleep, 27, 1181–1194. 10.1093/sleep/27.6.1181 - DOI - PubMed
    1. Brown, R. E. , Basheer, R. , McKenna, J. T. , Strecker, R. E. , & McCarley, R. W. (2012). Control of sleep and wakefulness. Physiological Reviews, 92, 1087–1187. 10.1152/physrev.00032.2011 - DOI - PMC - PubMed

Publication types