Multicenter Study
. 2019 Dec 31;14(12):e0226771.
doi: 10.1371/journal.pone.0226771. eCollection 2019.

A phenome-wide association study (PheWAS) in the Population Architecture using Genomics and Epidemiology (PAGE) study reveals potential pleiotropy in African Americans

Affiliations
Multicenter Study

A phenome-wide association study (PheWAS) in the Population Architecture using Genomics and Epidemiology (PAGE) study reveals potential pleiotropy in African Americans

Sarah A Pendergrass et al. PLoS One. .

Abstract

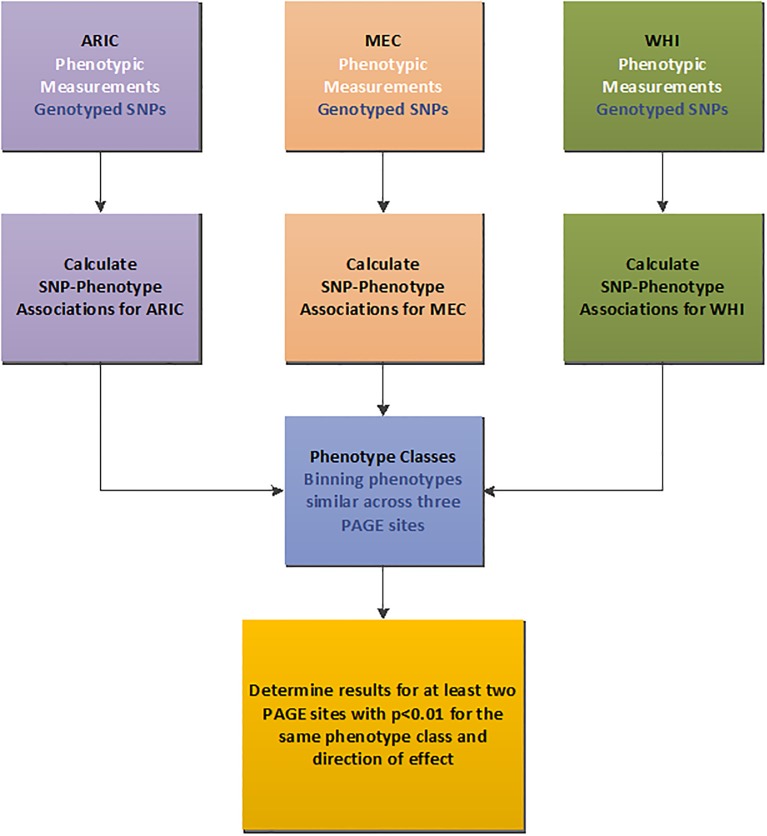
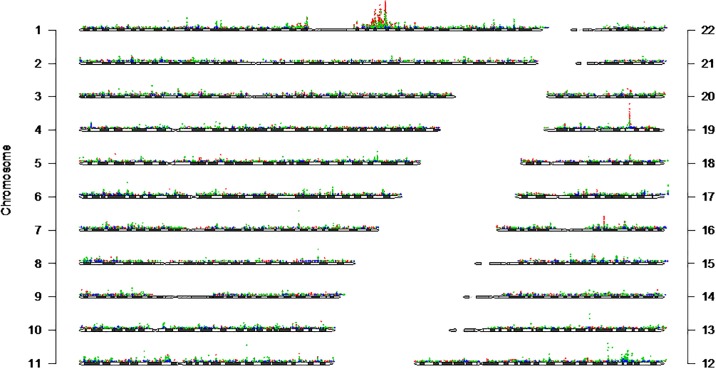
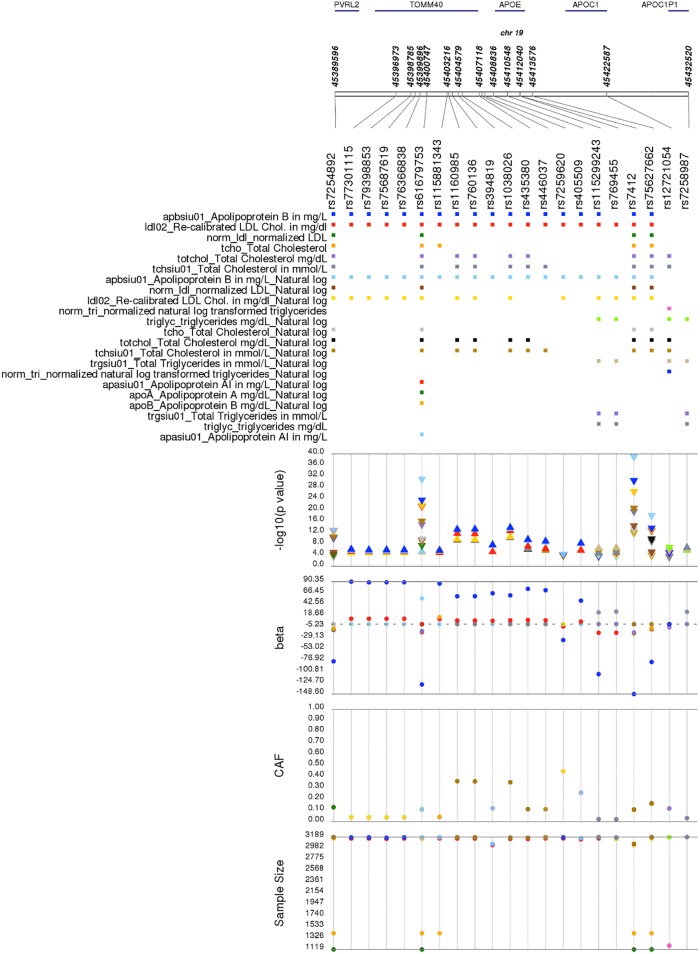
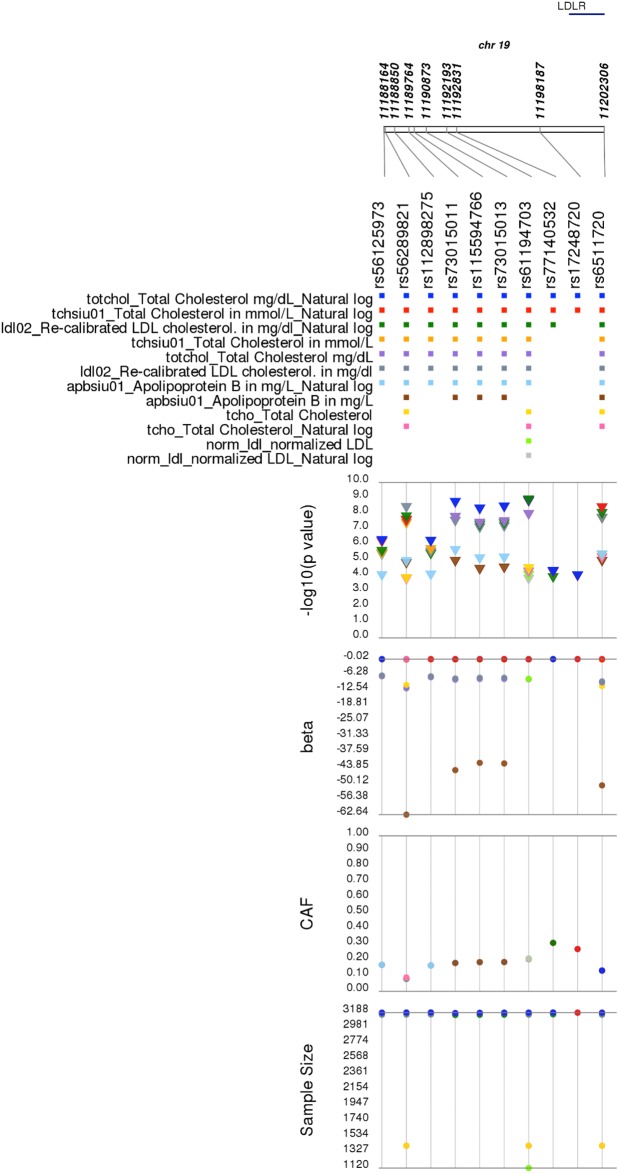
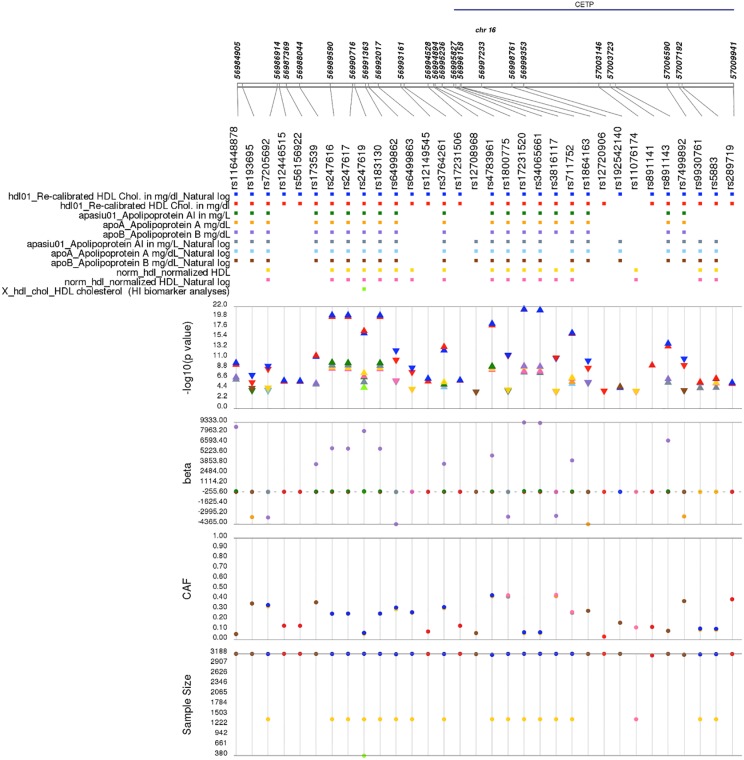
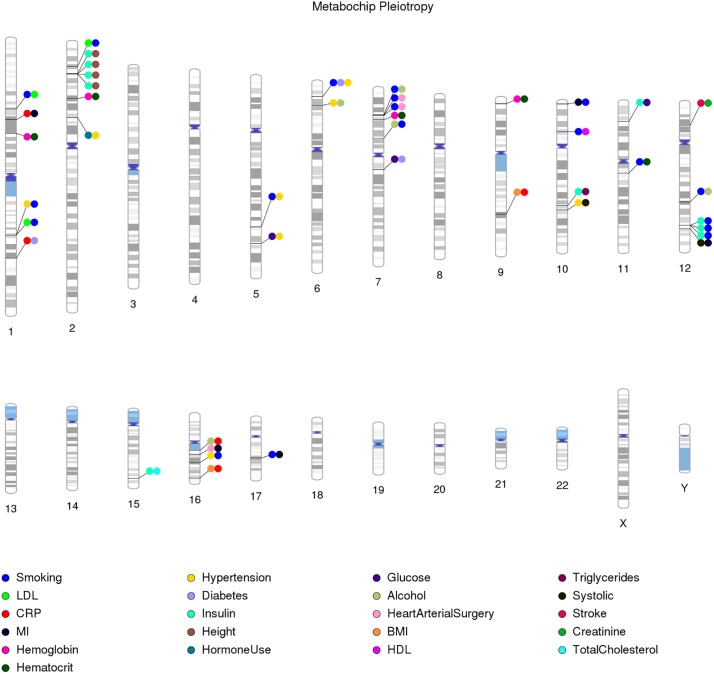
We performed a hypothesis-generating phenome-wide association study (PheWAS) to identify and characterize cross-phenotype associations, where one SNP is associated with two or more phenotypes, between thousands of genetic variants assayed on the Metabochip and hundreds of phenotypes in 5,897 African Americans as part of the Population Architecture using Genomics and Epidemiology (PAGE) I study. The PAGE I study was a National Human Genome Research Institute-funded collaboration of four study sites accessing diverse epidemiologic studies genotyped on the Metabochip, a custom genotyping chip that has dense coverage of regions in the genome previously associated with cardio-metabolic traits and outcomes in mostly European-descent populations. Here we focus on identifying novel phenome-genome relationships, where SNPs are associated with more than one phenotype. To do this, we performed a PheWAS, testing each SNP on the Metabochip for an association with up to 273 phenotypes in the participating PAGE I study sites. We identified 133 putative pleiotropic variants, defined as SNPs associated at an empirically derived p-value threshold of p<0.01 in two or more PAGE study sites for two or more phenotype classes. We further annotated these PheWAS-identified variants using publicly available functional data and local genetic ancestry. Amongst our novel findings is SPARC rs4958487, associated with increased glucose levels and hypertension. SPARC has been implicated in the pathogenesis of diabetes and is also known to have a potential role in fibrosis, a common consequence of multiple conditions including hypertension. The SPARC example and others highlight the potential that PheWAS approaches have in improving our understanding of complex disease architecture by identifying novel relationships between genetic variants and an array of common human phenotypes.


Conflict of interest statement

SAP is employed by and receives salary from Genentech Inc, and JMJ is employed by and receives salary from Illumina, Inc. This does not alter our adherence with PLOS ONE policies on sharing data and materials. DCC is an academic editor of PLOS ONE. DCC is not involved in the review of this manuscript per journal policy.

Figures

Fig 1
Fig 1. Overview of the Metabochip PheWAS study.
Three different PAGE study sites contributed data to the project: Atherosclerosis Risk in Communities (ARIC); the Women’s Health Initiative (WHI), and the Multiethnic Cohort (MEC). Comprehensive tests of association between 144,740 Metabochip SNPs and 273 phenotypes were calculated for African American participants from each of the three PAGE study sites. Similar phenotypes that were collected across the studies were binned into “phenotype classes”. Our PheWAS-significant criteria required an association at p<0.01 in at least two PAGE study sites for the same phenotype class and direction of effect.
Fig 2
Fig 2. All genetic tests of association results, by PAGE study.
Results from all tests of association for SNPs with a minor allele frequency >1% regardless of phenotype at p<5x10⁻⁴ were plotted across chromosomes 1–22. Each dot on the plot represents the −log10(p-value) for the test of the association, and each of the three PAGE studies is plotted with a different color, Multiethnic Cohort (MEC) in blue, Women’s Health Initiative (WHI) in green, and Atherosclerosis Risk in Communities (ARIC) in red. The most significant p-value plotted here is 8.01E-44 for OLFML2B rs6676438 and (natural log) white blood count in ARIC (see Table 2). The y-axis for each chromosome is the −log10(p-value), and the x-axis is chromosomal base pair location.
Fig 3
Fig 3. APOE rs7412 and nearby single nucleotide polymorphisms associated with lipid-related traits in a single Population Architecture using Genomics and Epidemiology (PAGE) study.
Plotted are single SNP tests of association in the Atherosclerosis Risk in Communities (ARIC) for APOE rs7412 and nearby SNPs within 100kb of previously-reported genome-wide association study (GWAS) associations also associated here at p<1.0x10⁻⁴ with lipid-related traits. Data shown are sample size, coded allele frequency (CAF), genetic effect size (beta), -log10(p-value), and ARIC phenotypes on the y-axes. Each SNP is plotted on the x-axis at the top of the figure from 5´ to 3′, and genomic positions along chromosome 19 along with annotated genes are given above. Data are color-coded by phenotype and displayed as a square (for SNPs), a triangle (p-values), or closed circles (betas, CAFs, and sample size). Direction of the triangle represents the direction of the effect size.
Fig 4
Fig 4. LDLR rs6511720 and nearby single nucleotide polymorphisms associated with lipid-related traits in a single Population Architecture using Genomics and Epidemiology (PAGE) study.
Plotted are single SNP tests of association in the Atherosclerosis Risk in Communities (ARIC) for LDLR rs6511720 and nearby SNPs within 100kb of previously-reported genome-wide association study (GWAS) associations also associated here at p<1.0x10⁻⁴ with lipid-related traits. Data shown are sample size, coded allele frequency (CAF), genetic effect size (beta), -log10(p-value), and ARIC phenotypes on the y-axes. Each SNP is plotted on the x-axis at the top of the figure from 5´ to 3′, and genomic positions along chromosome 19 along with annotated genes are given above. Data are color-coded by phenotype and displayed as a square (for SNPs), a triangle (p-values), or closed circles (betas, CAFs, and sample size). Direction of the triangle represents the direction of the effect size.
Fig 5
Fig 5. CETP rs3764261 and nearby single nucleotide polymorphisms associated with lipid-related traits in a single Population Architecture using Genomics and Epidemiology (PAGE) study.
Plotted are single SNP tests of association in the Atherosclerosis Risk in Communities (ARIC) for CETP rs3764261 and nearby SNPs within 100kb of previously-reported genome-wide association study (GWAS) associations also associated here at p<1.0x10⁻⁴ with lipid-related traits. Data shown are sample size, coded allele frequency (CAF), genetic effect size (beta), -log10(p-value), and ARIC phenotypes on the y-axes. Each SNP is plotted on the x-axis at the top of the figure from 5´ to 3′, and genomic positions along chromosome 16 along with annotated genes are given above. Data are color-coded by phenotype and displayed as a square (for SNPs), a triangle (p-values), or closed circles (betas, CAFs, and sample size). Direction of the triangle represents the direction of the effect size.
Fig 6
Fig 6. Phenotype classes associated with the same single nucleotide polymorphism in African Americans from the Population Architecture using Genomics and Epidemiology (PAGE) study.
A plot of the 43 PheWAS results where two or more phenotype classes were significantly associated (p<0.01) with the same single nucleotide polymorphism (SNP) in participating PAGE study sites. This plot does not include concomitant lipid phenotype-class results (53 SNPs) or white blood cell related results for chromosome 1 (37 SNPs). Lines connect the SNP chromosomal location to circles, and the color of each circle corresponds to an associated phenotype class listed in the legend at the bottom.

References

    1. Stearns FW. One Hundred Years of Pleiotropy: A Retrospective. Genetics. 2010;186(3):767–73. 10.1534/genetics.110.122549 - DOI - PMC - PubMed
    1. Paaby AB, Rockman MV. The many faces of pleiotropy. Trends in Genetics. 2013;29(2):66–73. 10.1016/j.tig.2012.10.010 - DOI - PMC - PubMed
    1. Tyler AL, Crawford DC, Pendergrass SA. The detection and characterization of pleiotropy: discovery, progress, and promise. Brief Bioinform. 2016;17(1):13–22. 10.1093/bib/bbv050 - DOI - PubMed
    1. Hindorff LA, Sethupathy P, Junkins HA, Ramos EM, Mehta JP, Collins FS, et al. Potential etiologic and functional implications of genome-wide association loci for human diseases and traits. Proceedings of the National Academy of Sciences. 2009;106(23):9362–7. - PMC - PubMed
    1. Sivakumaran S, Agakov F, Theodoratou E, Prendergast JG, Zgaga L, Manolio T, et al. Abundant pleiotropy in human complex diseases and traits. Am J Hum Genet. 2011;89(5):607–18. 10.1016/j.ajhg.2011.10.004 - DOI - PMC - PubMed

Publication types