. 2020 Mar-Apr:82-83:41-48.
doi: 10.1016/j.nucmedbio.2019.12.003. Epub 2019 Dec 17.

High-throughput radio-TLC analysis

Affiliations

High-throughput radio-TLC analysis

Jia Wang et al. Nucl Med Biol. 2020 Mar-Apr.

Abstract

Introduction: Radio thin layer chromatography (radio-TLC) is commonly used to analyze purity of radiopharmaceuticals or to determine the reaction conversion when optimizing radiosynthesis processes. In applications where there are few radioactive species, radio-TLC is preferred over radio-high-performance liquid chromatography due to its simplicity and relatively quick analysis time. However, with current radio-TLC methods, it remains cumbersome to analyze a large number of samples during reaction optimization. In a couple of studies, Cerenkov luminescence imaging (CLI) has been used for reading radio-TLC plates spotted with a variety of isotopes. We show that this approach can be extended to develop a high-throughput approach for radio-TLC analysis of many samples.

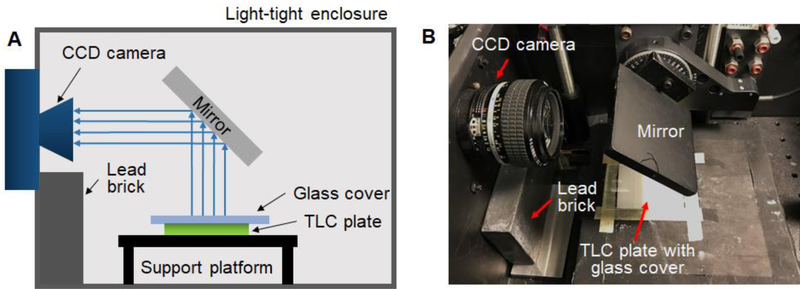
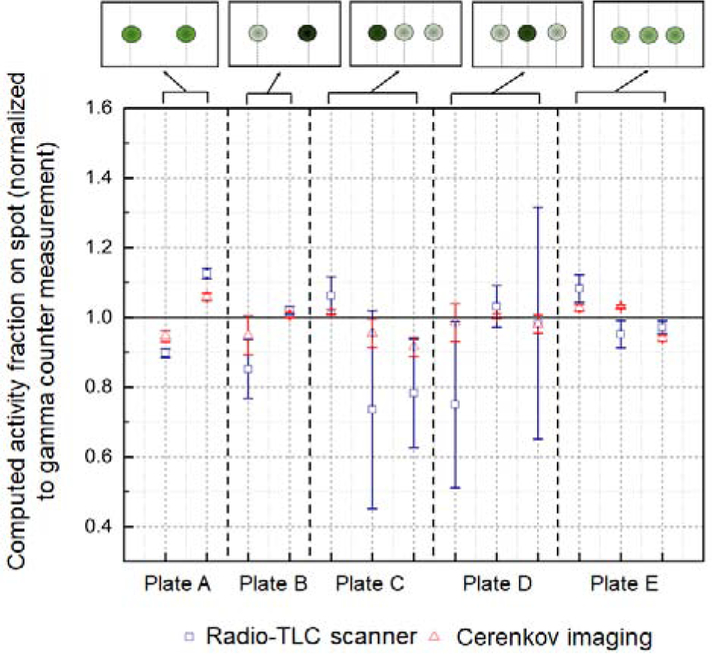
Methods: The high-throughput radio-TLC analysis was carried out by performing parallel development of multiple radioactive samples spotted on a single TLC plate, followed by simultaneous readout of the separated samples using Cerenkov imaging. Using custom-written MATLAB software, images were processed and regions of interest (ROIs) were drawn to enclose the radioactive regions/spots. For each sample, the proportion of integrated signal in each ROI was computed. Various crude samples of [18F]fallypride, [18F]FET and [177Lu]Lu-PSMA-617 were prepared for demonstration of this new method.

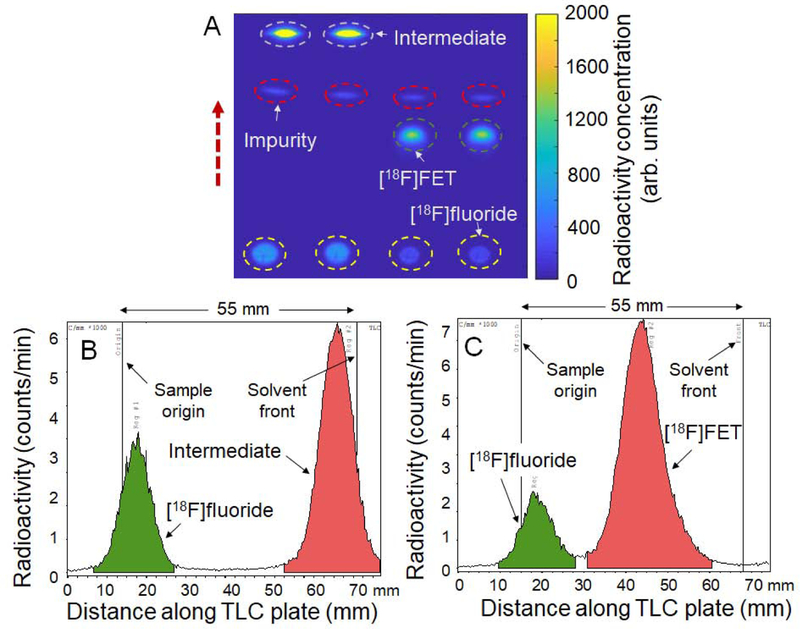
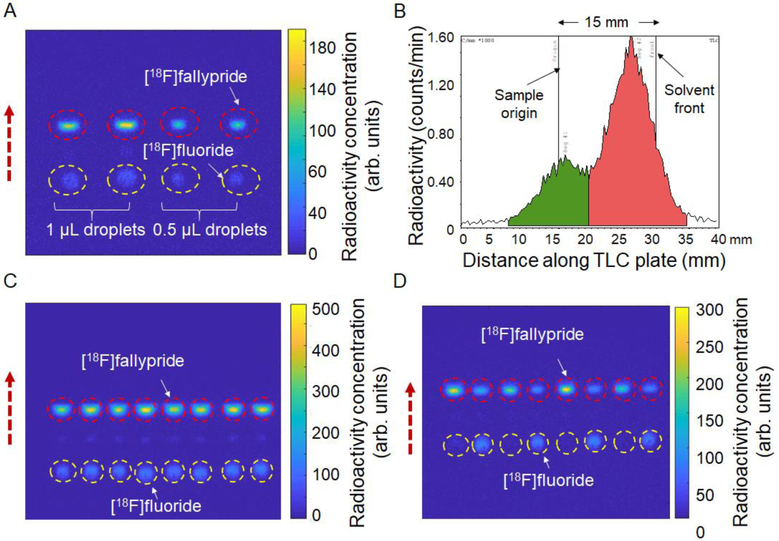
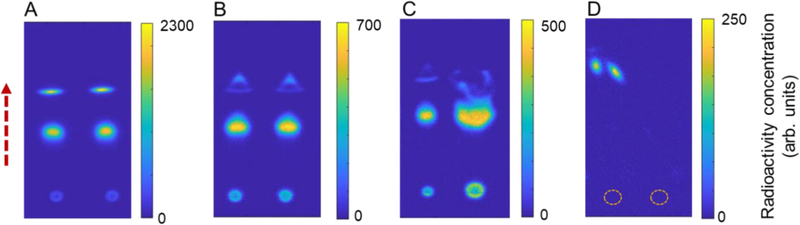
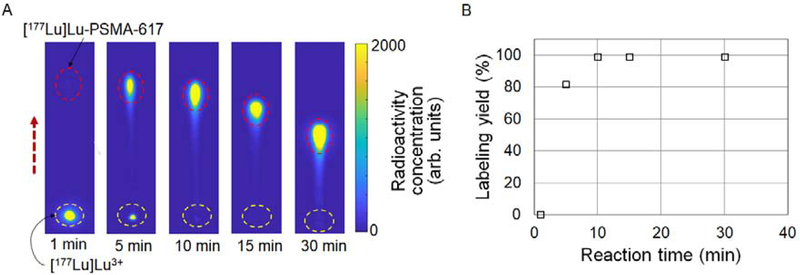
Results: Benefiting from a parallel developing process and high resolution of CLI-based readout, total analysis time for eight [18F]fallypride samples was 7.5 min (2.5 min for parallel developing, 5 min for parallel readout), which was significantly shorter than the 48 min needed using conventional approaches (24 min for sequential developing, 24 min for sequential readout on a radio-TLC scanner). The greater separation resolution of CLI enabled the discovery of a low-abundance side product from a crude [18F]FET sample that was not discernable using the radio-TLC scanner. Using the CLI-based readout method, we also observed that high labeling efficiency (99%) of [177Lu]Lu-PSMA-617 can be achieved in just 10 min, rather than the typical 30 min timeframe used.

Conclusions: Cerenkov imaging in combination with parallel developing of multiple samples on a single TLC plate proved to be a practical method for rapid, high-throughput radio-TLC analysis.

Keywords: High-throughput analysis; Quality control testing; Radiochemical purity; Radiopharmaceutical analysis; Radiosynthesis optimization; Thin-layer chromatography.


Conflict of interest statement

Declaration of competing interest The authors have no conflicts of interest to declare.

Figures

Figure 1.
Figure 1.
Cerenkov luminescence imaging setup within the light-tight enclosure. (A) Schematic. (B) Photograph.
Figure 2.
Figure 2.
High-throughput analysis of [18F]FET samples. (A) Cerenkov image of developed TLC plate spotted with two replicates of crude fluorination product (1 μL each) and two replicates of crude hydrolysis product (1 μL each). The dashed circles indicate the ROIs used for analysis. The dashed arrow indicates the direction of solvent movement during developing. (B) Example chromatogram obtained with the radio-TLC scanner spotted with crude fluorination product. (C) Example chromatogram from radio-TLC scan of crude hydrolysis product. Note that for B and C, the samples were spotted onto a different TLC plate and separation performed over 55 mm instead of 35 mm (in the Cerenkov image) to try to enhance separation between the species, but the low-abundance impurity could not be discerned.
Figure 3.
Figure 3.
High-throughput analysis of crude [18F]fallypride samples. (A) Cerenkov image of developed TLC plate spotted with 4 replicates (two 1.0 μL and two 0.5 μL) of the same crude reaction mixture using only 15 mm separation distance. (B) One example chromatogram obtained from the 0.5 μL sample in (A) using the radio-TLC scanner. The TLC plate was first imaged with the CLI based scanner and then was cut into 4 “lanes” each of which was scanned separately with miniGITA scanner. (C) Cerenkov image of developed TLC plate spotted with 8 replicates (0.5 μL) of another batch of crude [18F]fallypride. The dashed circles represent the ROIs for analysis. The dashed arrow represents the direction of solvent flow during developing. (D) Cerenkov image of developed TLC plate spotted with 8 droplets (0.5 μL) sampled from 8 different batches of crude [18F]fallypride reacted under different sets of conditions (n=4 replicates each of two different sets of conditions, spotted in alternating pattern).The dashed circles highlight the ROIs for the 8 samples. The dashed arrow represents the direction of solvent flow during developing.
Figure 4.
Figure 4.
Radio-TLC readout performance comparison of radio-TLC scanner (blue squares) and Cerenkov luminescence (red triangles) of the plates in Figure S8. The data points show the average activity fraction in each spot (averaged over the analysis performed by n=8 participants) normalized by the activity fraction determined by gamma counting. The normalized activity fraction provides a measure of accuracy. Values close to 1.0 indicate high accuracy, i.e., close agreement between the result from the radio-TLC scanner or Cerenkov luminescence analysis and the gamma counter measurement of the radioactivity in a particular spot. The error bars show the relative standard deviations and indicate the precision. The black dashed vertical lines separate the data from each of the five radio-TLC plates. Cartoons of the activity distribution are shown at the top of the graph (darker green spots represent higher activity level).
Figure 5.
Figure 5.
Assessing quality of the TLC spotting and developing process. (A) Cerenkov image of developed plate after spotting of two replicates (1 μL) each of crude [18F]FET product. This image indicates a normal spotting and developing process. (B) Separation artifacts visible in most distant spots when the plate was not completely dried prior to developing. (C) Separation artifacts due to a combination of incomplete drying as well as abnormally large sample volume (right spot 2.0 μL). (D) Separation artifacts arising from liquid contamination at the right edge of the TLC plate during developing, causing the main solvent flow to be deflected to the left. The TLC plate in this case was spotted, at the positions marked with dash circles, with two replicates (1 μL each) of crude [18F]fallypride product.
Figure 6.
Figure 6.
CLI-based analysis of crude [177Lu]Lu-PSMA-617 samples (β-emitter). (A) Cerenkov image of developed TLC plates spotted with droplets (2 μL) of the crude reaction mixture sampled at different reaction times. In this demonstration, each TLC plate was developed individually, resulting in variable separation distances, but multiple plates were imaged together. The dashed circles represent the ROIs for analysis. The dashed arrow represents the direction of solvent flow during developing. (B) Graph of radiolabeling yields as a function of reaction time.

References

    1. Fendler WP, Stuparu AD, Evans-Axelsson S, Lückerath K, Wei L, Kim W, et al. Establishing 177Lu-PSMA-617 Radioligand Therapy in a Syngeneic Model of Murine Prostate Cancer. J Nucl Med 2017;58:1786–92. 10.2967/jnumed.117.193359. - DOI - PMC - PubMed
    1. Zacharias P, Gather MC, Rojahn M, Nuyken O, Meerholz K. New Crosslinkable Hole Conductors for Blue-Phosphorescent Organic Light-Emitting Diodes. Angew Chem Int Ed n.d;46:4388–92. 10.1002/anie.200605055. - DOI - PubMed
    1. Momiyama N, Torii H, Saito S, Yamamoto H. O-nitroso aldol synthesis: Catalytic enantioselective route to α-aminooxy carbonyl compounds via enamine intermediate. Proc Natl Acad Sci 2004;101:5374–8. 10.1073/pnas.0307785101. - DOI - PMC - PubMed
    1. Skipski VP, Peterson RF, Barclay M. Quantitative analysis of phospholipids by thin-layer chromatography. Biochem J 1964;90:374–8. - PMC - PubMed
    1. Wang J, Chao PH, Hanet S, Dam RM van. Performing multi-step chemical reactions in microlitersized droplets by leveraging a simple passive transport mechanism. Lab Chip 2017;17:4342–55. 10.1039/C7LC01009E. - DOI - PMC - PubMed

Publication types