Genome-Wide Tiling Array Analysis of HPV-Induced Warts Reveals Aberrant Methylation of Protein-Coding and Non-Coding Regions
- PMID: 31892232
- PMCID: PMC7017144
- DOI: 10.3390/genes11010034
Genome-Wide Tiling Array Analysis of HPV-Induced Warts Reveals Aberrant Methylation of Protein-Coding and Non-Coding Regions
Abstract
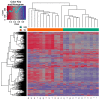
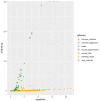
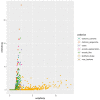
The human papillomaviruses (HPV) are a group of double-stranded DNA viruses that exhibit an exclusive tropism for squamous epithelia. HPV can either be low- or high-risk depending on its ability to cause benign lesions or cancer, respectively. Unsurprisingly, the majority of epigenetic research has focused on the high-risk HPV types, neglecting the low-risk types in the process. Therefore, the main objective of this study is to better understand the epigenetics of wart formation by investigating the differences in methylation between HPV-induced cutaneous warts and normal skin. A number of clear and very significant differences in methylation patterns were found between cutaneous warts and normal skin. Around 55% of the top-ranking 100 differentially methylated genes in warts were protein coding, including the EXOC4, KCNU, RTN1, LGI1, IRF2, and NRG1 genes. Additionally, non-coding RNA genes, such as the AZIN1-AS1, LINC02008, and MGC27382 genes, constituted 11% of the top-ranking 100 differentially methylated genes. Warts exhibited a unique pattern of methylation that is a possible explanation for their transient nature. Since the genetics of cutaneous wart formation are not completely known, the findings of the present study could contribute to a better understanding of how HPV infection modulates host methylation to give rise to warts in the skin.
Keywords: HPV; cutaneous warts; methylation; skin.
Conflict of interest statement
The authors declare no conflict of interest.
Figures


Similar articles
-
Epigenome-wide analysis of common warts reveals aberrant promoter methylation.Int J Med Sci. 2020 Jan 14;17(2):191-206. doi: 10.7150/ijms.39261. eCollection 2020. Int J Med Sci. 2020. PMID: 32038103 Free PMC article.
-
Genome-Wide CpG Island Methylation Profiles of Cutaneous Skin with and without HPV Infection.Int J Mol Sci. 2019 Sep 28;20(19):4822. doi: 10.3390/ijms20194822. Int J Mol Sci. 2019. PMID: 31569353 Free PMC article.
-
Genome-wide identification of methylated CpG sites in nongenital cutaneous warts.BMC Med Genomics. 2020 Jul 8;13(1):100. doi: 10.1186/s12920-020-00745-6. BMC Med Genomics. 2020. PMID: 32641122 Free PMC article.
-
The low-risk papillomaviruses.Virus Res. 2017 Mar 2;231:119-127. doi: 10.1016/j.virusres.2016.12.017. Epub 2016 Dec 28. Virus Res. 2017. PMID: 28040475 Review.
-
Review: antibodies to cutaneous human papillomaviruses.J Med Virol. 2012 May;84(5):814-22. doi: 10.1002/jmv.23257. J Med Virol. 2012. PMID: 22431031 Review.
Cited by
-
Detecting SARS-CoV-2 and its variant strains with a full genome tiling array.Brief Bioinform. 2021 Nov 5;22(6):bbab213. doi: 10.1093/bib/bbab213. Brief Bioinform. 2021. PMID: 34097003 Free PMC article.
-
Global gene methylation profiling of common warts caused by human papillomaviruses infection.Saudi J Biol Sci. 2021 Jan;28(1):612-622. doi: 10.1016/j.sjbs.2020.10.050. Epub 2020 Nov 2. Saudi J Biol Sci. 2021. PMID: 33424347 Free PMC article.
-
Identification of Differentially Methylated CpG Sites in Fibroblasts from Keloid Scars.Biomedicines. 2020 Jun 28;8(7):181. doi: 10.3390/biomedicines8070181. Biomedicines. 2020. PMID: 32605309 Free PMC article.
References
Publication types
MeSH terms
Substances
LinkOut - more resources
Full Text Sources
Medical

