. 2019 Dec 31;21(1):2.
doi: 10.1186/s13059-019-1921-y.

Distinct epigenetic features of tumor-reactive CD8+ T cells in colorectal cancer patients revealed by genome-wide DNA methylation analysis

Affiliations

Distinct epigenetic features of tumor-reactive CD8+ T cells in colorectal cancer patients revealed by genome-wide DNA methylation analysis

Rui Yang et al. Genome Biol. .

Abstract

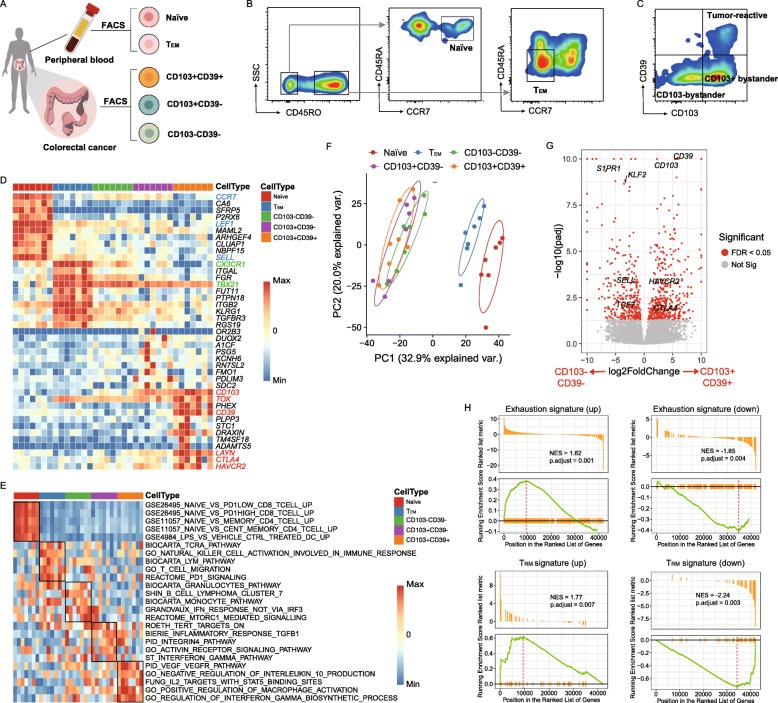
Background: Tumor-reactive CD8+ tumor-infiltrating lymphocytes (TILs) represent a subtype of T cells that can recognize and destroy tumor specifically. Understanding the regulatory mechanism of tumor-reactive CD8+ T cells has important therapeutic implications. Yet the DNA methylation status of this T cell subtype has not been elucidated.

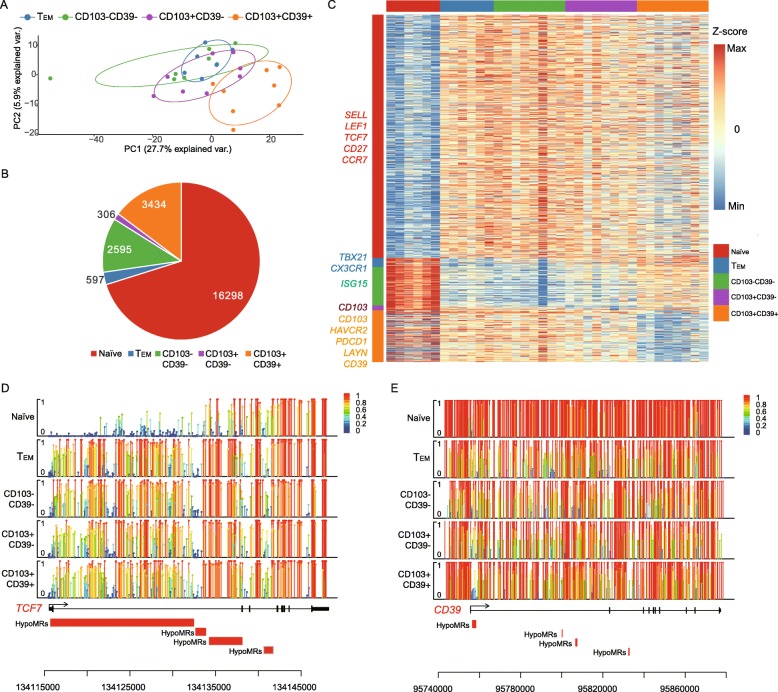
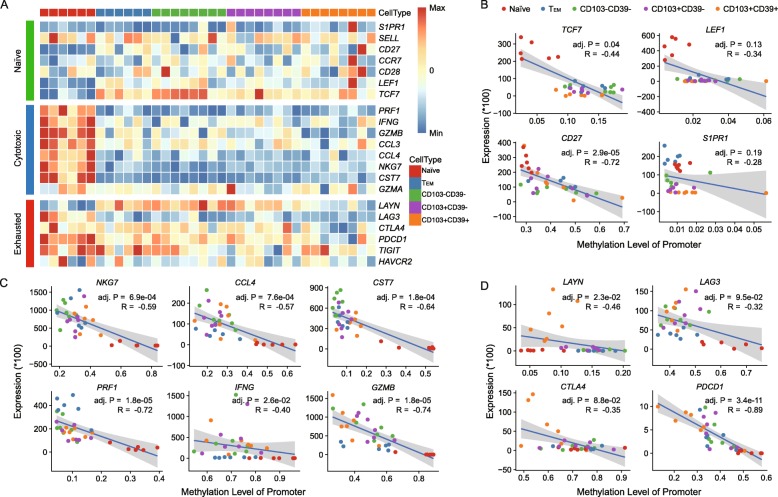
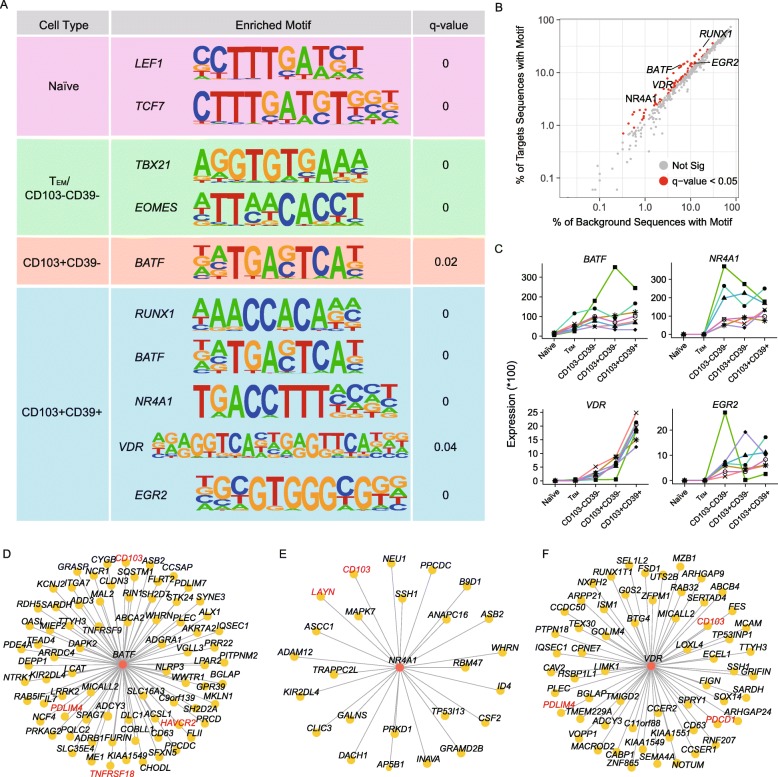
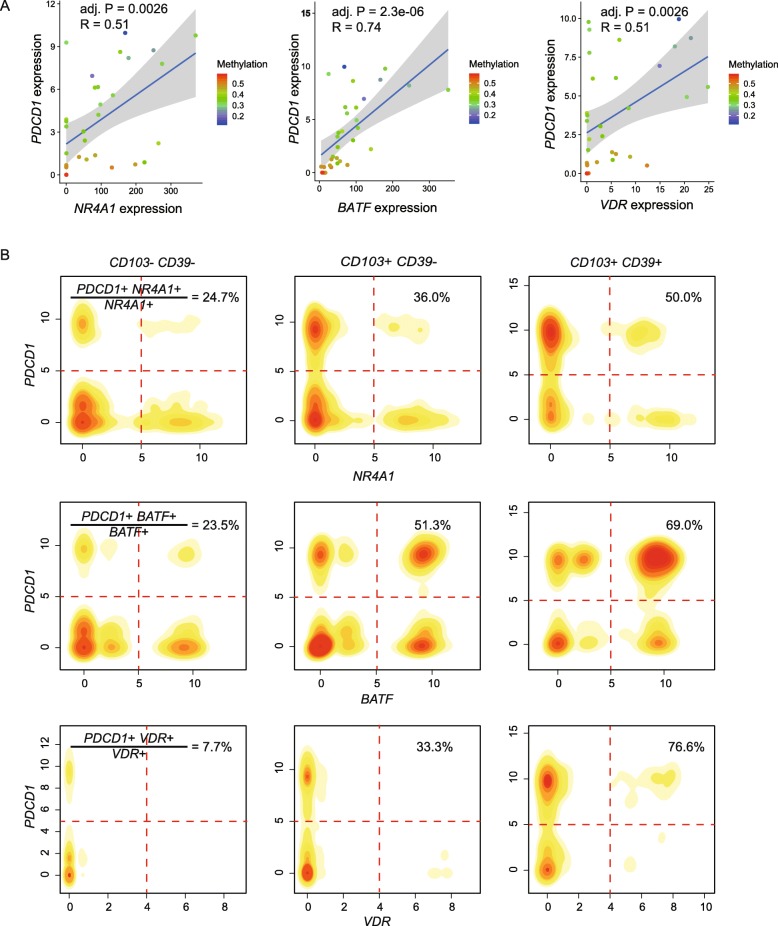
Results: In this study, we segregate tumor-reactive and bystander CD8+ TILs, as well as naïve and effector memory CD8+ T cell subtypes as controls from colorectal cancer patients, to compare their transcriptome and methylome characteristics. Transcriptome profiling confirms previous conclusions that tumor-reactive TILs have an exhausted tissue-resident memory signature. Whole-genome methylation profiling identifies a distinct methylome pattern of tumor-reactive CD8+ T cells, with tumor-reactive markers CD39 and CD103 being specifically demethylated. In addition, dynamic changes are observed during the transition of naïve T cells into tumor-reactive CD8+ T cells. Transcription factor binding motif enrichment analysis identifies several immune-related transcription factors, including three exhaustion-related genes (NR4A1, BATF, and EGR2) and VDR, which potentially play an important regulatory role in tumor-reactive CD8+ T cells.

Conclusion: Our study supports the involvement of DNA methylation in shaping tumor-reactive and bystander CD8+ TILs, and provides a valuable resource for the development of novel DNA methylation markers and future therapeutics.

Keywords: Bystanders; Colorectal cancer; Methylome; T cell exhaustion; Transcription factor; Transcriptome; Tumor-reactive T cells.


Conflict of interest statement

The authors declare that they have no competing interests.

Figures

Fig. 1
Fig. 1
Comparative transcriptional analysis reveals tumor-reactive CD8+ T cells to have a TRM signature with high expression of exhaustion markers. a Experimental design for the isolation of different CD8+ T cell populations from CRC patients. b, c Representative plots of FACS-isolated T cell populations. d Gene expression heat map of five CD8+ T cell populations. Rows represent signature genes, and columns represent cell types. Selective specifically expressed genes are marked in red. e GSVA was performed to identify enriched significant biological pathways in five CD8+ T cell subtypes. Five gene sets for each T cell population are depicted in a heat map. f PCA analysis of transcriptome expression of five CD8+ T cell populations. Each symbol represents one patient. g Volcano plot showing differential gene expression of CD103+CD39+ T cells vs. CD103−CD39− T cells (log2-transformed). Each red dot denotes an individual gene with a false-discovery rate (FDR) < 0.05. h Enrichment plot for the gene sets of “T cell exhaustion” and “TRM” in the transcriptome of CD103+CD39+ T cells vs. that of CD103−CD39− T cells by GSEA. NES, normalized enrichment score
Fig. 2
Fig. 2
Whole-genome methylation profiling across multiple CD8+ T cell subtypes. a PCA analysis based on methylation profiles of CD8+ T cells in four T cell subtypes. b The graph shows the number of HypoMRs identified among five T cell subtypes. c Heat map showing the HypoMRs in the five subtypes. Color gradation from blue to red represents low to high DNA methylation levels. Selected genes associated with the HypoMRs were listed at the left side. d, e Lollipop plots for the nucleotide-resolution methylation level of the TCF7 and CD39 loci. Each covered cytosine is displayed as a bar with a large round head. The color and height of the bar indicate the methylation level
Fig. 3
Fig. 3
Immune function annotations. a Heat map showing methylation levels of selected T cell function-associated genes for each CD8+ T cell subtypes. bd Scatter plots and trend lines were plotted to illustrate the correlation between the differences in mRNA expression and DNA methylation of promoters in three groups of immune signature genes for b naïve, c cytotoxic, and d exhausted T cells. R, Spearman’s correlation; adj. P, Benjamini-Hochberg adjusted p value
Fig. 4
Fig. 4
Key transcription factors and their targets for each CD8+ T cell subtype. a Selected TF motifs enriched in HypoMRs for five subtypes. Q value here represents adjusted p value reported by HOMER. b Target (y-axis) vs. background (x-axis) sequences with motif in CD103+CD39+ subtypes. c RNA expression of BATF, NR4A1, VDR, and EGR2 in five subtypes. df Computed gene regulatory networks showing transcription factor BATF (d), NR4A1 (e), and VDR (f) and their target genes. TFs and their targets of interest are labeled in red
Fig. 5
Fig. 5
Effects of NR4A1, BATF, and VDR expression and methylation status of their PDCD1 binding sites on PDCD1 expression. a Scatter plots and trend lines were plotted to illustrate the correlation between PDCD1 expression and three TF (NR4A1, BATF, and VDR) expressions. Colors of dots represent the methylation levels of the promoter regions of PDCD1. Each dot represents a replicate of one patient. R, regression coefficient; adj. P, Benjamini-Hochberg adjusted p value. b In silico FACS analysis of our previous scRNA-seq data of CD8+ T cells from CRC patients. The percentages of double-positive cells for PDCD1 and TF in the corresponding TF-positive cells are calculated in three TIL subtypes, respectively

References

    1. Simoni Y, Becht E, Fehlings M, Loh CY, Koo SL, Teng KWW, et al. Bystander CD8(+) T cells are abundant and phenotypically distinct in human tumour infiltrates. Nature. 2018;557(7706):575–579. doi: 10.1038/s41586-018-0130-2. - DOI - PubMed
    1. Scheper Wouter, Kelderman Sander, Fanchi Lorenzo F., Linnemann Carsten, Bendle Gavin, de Rooij Marije A. J., Hirt Christian, Mezzadra Riccardo, Slagter Maarten, Dijkstra Krijn, Kluin Roelof J. C., Snaebjornsson Petur, Milne Katy, Nelson Brad H., Zijlmans Henry, Kenter Gemma, Voest Emile E., Haanen John B. A. G., Schumacher Ton N. Low and variable tumor reactivity of the intratumoral TCR repertoire in human cancers. Nature Medicine. 2018;25(1):89–94. doi: 10.1038/s41591-018-0266-5. - DOI - PubMed
    1. Duhen T, Duhen R, Montler R, Moses J, Moudgil T, de Miranda NF, et al. Co-expression of CD39 and CD103 identifies tumor-reactive CD8 T cells in human solid tumors. Nat Commun. 2018;9(1):2724. doi: 10.1038/s41467-018-05072-0. - DOI - PMC - PubMed
    1. Li Hanjie, van der Leun Anne M., Yofe Ido, Lubling Yaniv, Gelbard-Solodkin Dikla, van Akkooi Alexander C.J., van den Braber Marlous, Rozeman Elisa A., Haanen John B.A.G., Blank Christian U., Horlings Hugo M., David Eyal, Baran Yael, Bercovich Akhiad, Lifshitz Aviezer, Schumacher Ton N., Tanay Amos, Amit Ido. Dysfunctional CD8 T Cells Form a Proliferative, Dynamically Regulated Compartment within Human Melanoma. Cell. 2019;176(4):775-789.e18. doi: 10.1016/j.cell.2018.11.043. - DOI - PMC - PubMed
    1. Willinger T, Freeman T, Hasegawa H, McMichael AJ, Callan MF. Molecular signatures distinguish human central memory from effector memory CD8 T cell subsets. J Immunol. 2005;175(9):5895–5903. doi: 10.4049/jimmunol.175.9.5895. - DOI - PubMed

Publication types

Substances