. 2019 Dec 31;12(1):1.
doi: 10.1186/s13195-019-0546-4.

Targeting soluble tumor necrosis factor as a potential intervention to lower risk for late-onset Alzheimer's disease associated with obesity, metabolic syndrome, and type 2 diabetes

Affiliations

Targeting soluble tumor necrosis factor as a potential intervention to lower risk for late-onset Alzheimer's disease associated with obesity, metabolic syndrome, and type 2 diabetes

Maria Elizabeth De Sousa Rodrigues et al. Alzheimers Res Ther. .

Abstract

Background: Insulin impairment and inflammation are two features common to type 2 diabetes and Alzheimer's disease; however, the molecular and signaling interactions underlying this relationship are not well understood. Mounting evidence point to the associations between the disruption of metabolite processing in insulin impairment and neurodegenerative conditions such as Alzheimer's. Although the brain depends partially on metabolites processed in the periphery, to date, little is known about how soluble tumor necrosis factor signaling (solTNF) impacts integrated peripheral immune and metabolic feedback signals in states of energy overload and insulin insensitivity.

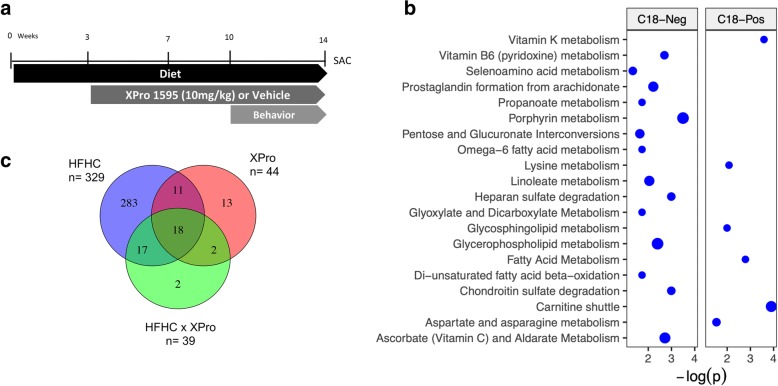
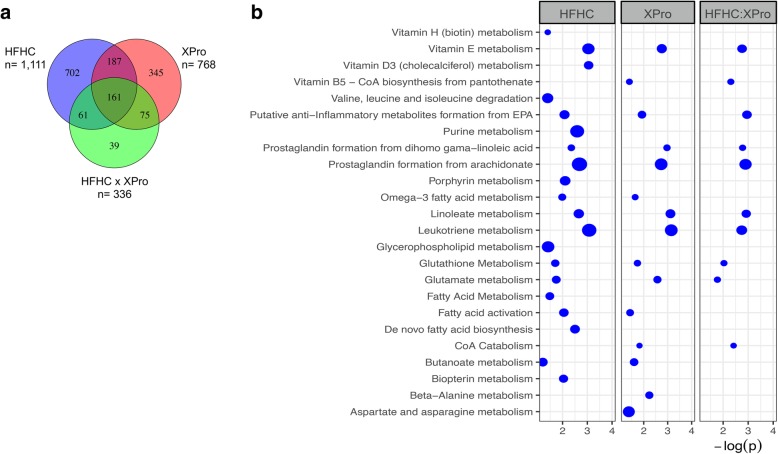
Methods: C57Bl/6J mice were fed a high-fat high-carbohydrate diet (HFHC) for 14 weeks. The brain-permeant biologic XPro1595® was used to block solTNF-dependent pathways. Metabolic and immune alterations were evaluated in the gut, liver, and brain. Behavioral tests were performed. Untargeted metabolomics was carried out in the plasma and liver.

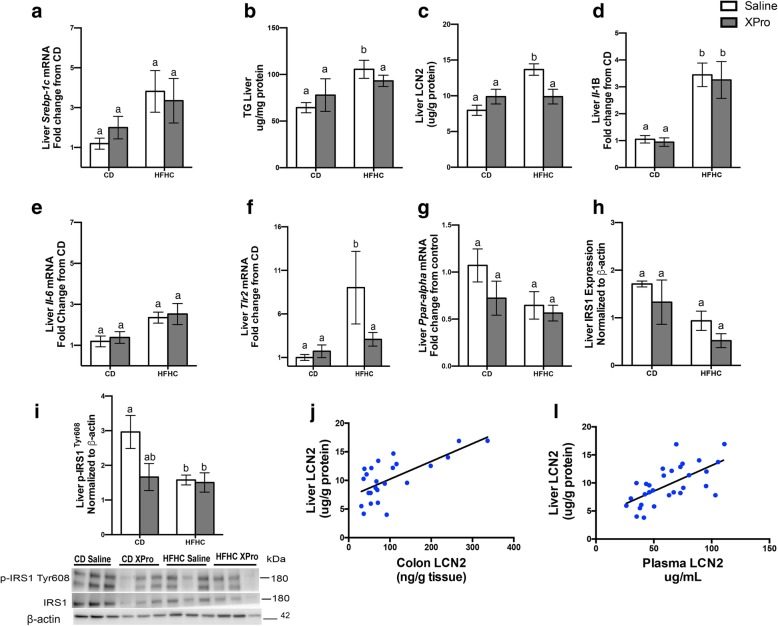
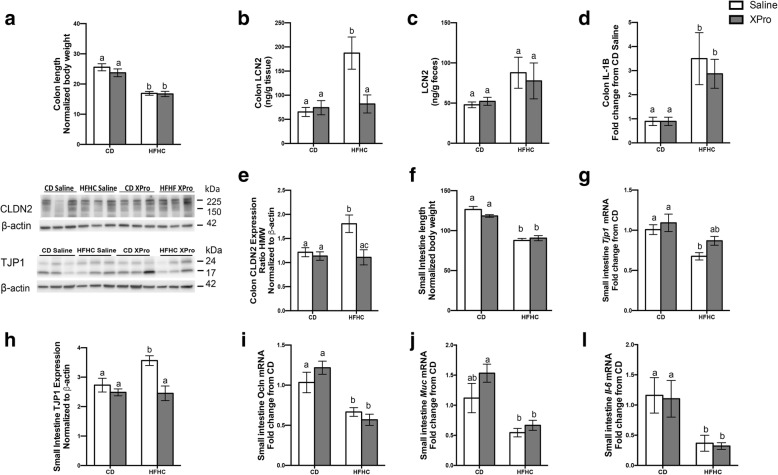
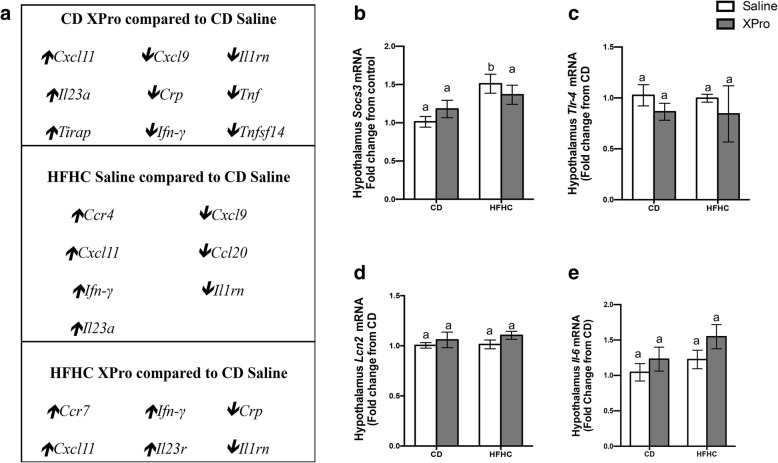
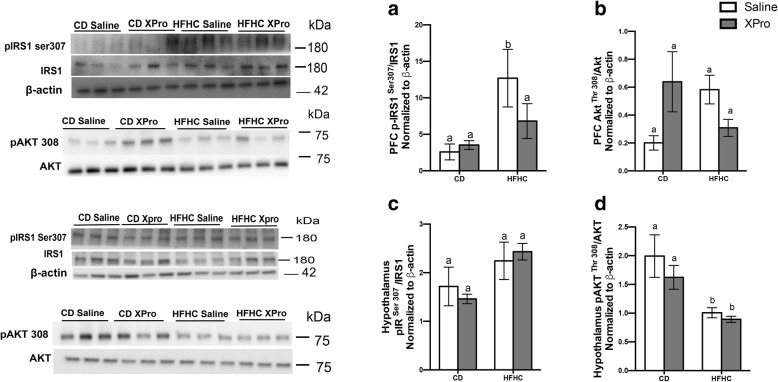
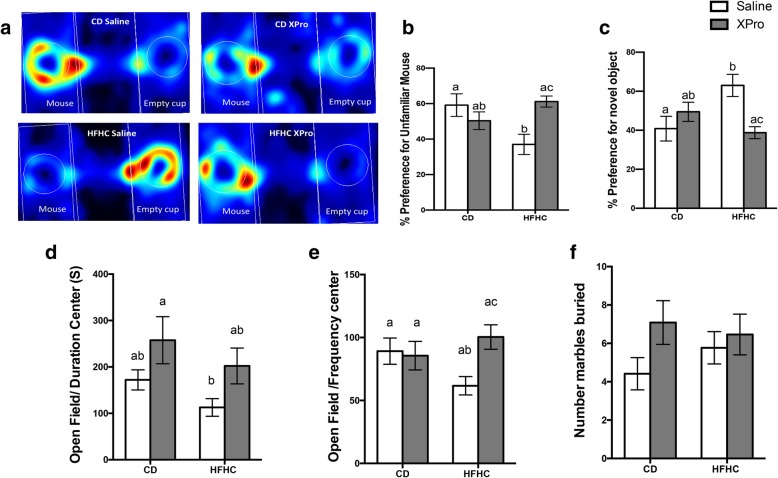
Results: HFHC diet promotes central insulin impairment and dysregulation of immune-modulatory gene expressed in the brain. Alteration of metabolites associated with type 2 diabetes and Alzheimer's such as butanoate, glutamate, biopterin, branched-chain amino acids, purines, and proteoglycan metabolism was observed in HFHC-fed mice. solTNF inhibition ameliorates hepatic metabolic disturbances and hepatic and intestinal lipocalin-2 levels, and decreases insulin impairment in the brain and behavioral deficits associated with HFHC diet.

Conclusions: Our novel findings suggest that HFHC diet impacts central insulin signaling and immune-metabolic interactions in a solTNF-dependent manner to increase the risk for neurodegenerative conditions. Our novel findings indicate that selective solTNF neutralization can ameliorate peripheral and central diet-induced insulin impairment and identify lipocalin-2 as a potential target for therapeutic intervention to target inflammation and insulin disturbances in obesogenic environments. Collectively, our findings identify solTNF as a potential target for therapeutic intervention in inflammatory states and insulin disturbances in obesogenic environments to lower risk for AD.

Keywords: Gut; Insulin; Lipocalin-2; Liver; Metabolic inflammation; Metabolomics; Neuroactive metabolites; Proteoglycans; Purines; Soluble tumor necrosis factor.


Conflict of interest statement

MG Tansey is an ex-employee of Xencor, Inc. and is a co-inventor on the dominant-negative TNF patent but does not hold a significant financial stake in Xencor, Inc. or INmune Bio, Inc. CJ Barnum is an employee of INmune Bio. The other authors declare that they have no competing interests.

Figures

Fig. 1
Fig. 1
Plasma metabolic profile associated with HFHC diet consumption and solTNF neutralization with XPro1595. a Graphic representation of the study timeline. Diet—chow (4% kcal + water) or HFHC (high fat 42% kcal fat + 30% fructose w/v). Injections—subcutaneous injections every third day. Behavior—sociability, open field, and marble burying. At 14 weeks, mice were euthanized, and tissues were harvested (n = 12–13/group). b Mummichog pathway enrichment of HFHC differentially expressed m/z features included pathways related to amino acid metabolism, fatty acid and lipid pathways, oxidative stress, and pentose/glucuronate and proteoglycan metabolism. c Untargeted high-resolution metabolomics was used to identify plasma metabolic changes associated with HFHC diet, solTNF neutralization, and the interaction between the two. The majority of m/z features identified using two-way ANOVA with post hoc analysis were differentially expressed in association with the HFHC diet. Associations with solTNF neutralization and the interaction between diet and solTNF were also detected. Venn diagram quantities represent the number of mass spectral features with FDR < 5% prior to the metabolite annotation, n = 7–13 animals/group
Fig. 2
Fig. 2
Liver metabolic profile associated with HFHC diet consumption and solTNF neutralization with XPro1595. a Untargeted high-resolution metabolomics of hepatic tissues showed a significant metabolic response to diet and solTNF treatment. HFHC showed the greatest number of metabolic changes, with 1111 m/z features differentially expressed in association with diet. Targeting solTNF promoted marked liver metabolic alterations and resulted in differential expression of 768 m/z features. A large number of these showed interaction with diet or were also associated with hepatic changes following HFHC diet consumption. Venn diagram quantities represent the number of mass spectral features with FDR < 5% prior to metabolite annotation. b Mummichog pathway enrichment of m/z features associated with HFHC showed changes in inflammatory, lipid, oxidative stress, cofactor, branched-chain amino acid, biopterin, and purine pathways. solTNF treatment showed association with a number of these pathways, including inflammatory, oxidative stress, and fatty acid pathways. Interaction between solTNF and HFHC suggests solTNF neutralization could mediate diet-induced changes in inflammation and oxidative stress in hepatic tissues. Analysis using two-way ANOVA with post hoc analysis at false discovery rate (FDR) threshold ≤ 5%, n = 12 animals/group
Fig. 3
Fig. 3
solTNF neutralization decreases hepatic LCN2 in diet-induced liver inflammation. a HFHC diet impact on Srebp-1c mRNA expression (n = 6, diet effect P = 0.0263). b Increased hepatic triglyceride accumulation was observed in the HFHC groups (n = 8, diet effect P = 0.0102). c solTNF neutralization decreases elevated hepatic LCN2 associated with HFHC diet (n = 9–11, diet effect P = 0.0034, interaction P = 0.0034). d-g HFHC diet impact on Il-1 (n = 6, diet effect P < 0.0001), Il-6 (n = 6, diet effect P = 0.0036), Tlr2 (n = 5–6, diet effect P = 0.0221), and Ppar-α (n = 5–6, diet effect P = 0.0348) liver mRNA expression in the HFHC groups. h, i Immunoblot analysis demonstrates decreased IRS1 expression (n = 6, diet effect P = 0.0075) and phosphorylated of IRS1 (TYR608) (n = 6, diet effect P = 0.0372) after 14 weeks of HFHC diet treatment. j-l Scatter plots indicate significant Pearson correlation analysis (r value) between hepatic and colonic LCN2 levels (r2 = 0.4650, P < 0.0002) and hepatic and plasma LCN2 (r2 = 0.4168, P < 0.0001). Tissues were analyzed by qPCR using primers directed against murine Il-1, Il-6, Tlr2, and Ppar-alpha. RNA expression. For each animal, the Ct values were normalized to the Ct values for Gapdh and Ppia. The relative expression level of the target gene (fold change) was expressed as 2−ΔΔCt, when compared with the mean DCt (threshold cycle) of the control group. Immunoblots are representative of two independent experiments. Band intensity was calculated using Image Studio Lite, and values were normalized to the intensity of β-actin. Blot images were cropped for comparison. Data were analyzed by two-way ANOVA followed by Tukey’s multiple comparisons in GraphPad Prism 6. Data in bar graphs are represented as the mean ± SEM. Lowercase letters indicate post hoc analysis. Values with different lowercase letters are significantly different from each other. Means with different lowercase letters are significantly different from each other, P < 0.05
Fig. 4
Fig. 4
solTNF neutralization with XPro1595 reduces colonic LCN2 and reverses tight junction protein alterations associated with HFHC diet consumption. a-c HFHC diet promoted and decrease in colon length (n = 12–13, diet effect P < 0.0001) and an inflammatory colonic profile demonstrated by elevated LCN2 in colon (n = 6–9, diet effect P = 0.0091) and feces (n = 8–10, diet effect P = 0.0252). d Colonic Il-1b mRNA expression (n = 6, diet effect P < 0.0001). XPro 1595 reverses colonic LCN2 (P = 0.0460). e solTNF neutralization and HFHC diet-associated alterations in proteins involved in barrier function in the colon (CLDN2 n = 6, diet effect P = 0.0091), solTNF inhibition decreased the ratio of claudin-2 high/low in the HFHC diet/XPro1595 group (CLDN2 n = 6, XPro effect P = 0.0425). f HFHC diet decreases small intestine length (n = 12–13, diet effect P < 0.0001). g-i Small intestinal barrier alterations in HFHC mice (Tjp1 mRNA expression, n = 6, diet effect P = 0.0012; TJP1 protein expression, n = 6, diet effect P = 0.05; Ocln mRNA, n = 6, diet effect P < 0.0001). jl Muc (n = 6, diet effect, P < 0.0001) and Il-6 (n = 6, diet effect, P = 0.0004) mRNA expression in the small intestine. Tissues were analyzed by qPCR; for each animal, the Ct values were normalized to the Ct values for Gapdh and Ppia. The relative expression level of the target gene ratio of high molecular weight to low molecular weight forms of CLDN2 and TJP1 protein expression was assessed by immunoblot. Immunoblots are representative of two independent experiments. Band intensity was calculated using Image Studio Lite, and values were normalized to intensity of β-actin. Blot images were cropped for comparison. Data were analyzed by two-way ANOVA followed by Tukey’s multiple comparisons in GraphPad Prism 6. Bar height indicates mean of samples; error bars indicate standard error of the mean (SEM). Lowercase letters indicate post hoc analysis. Means with different lowercase letters are significantly different from each other, P < 0.05
Fig. 5
Fig. 5
High-fat high-carbohydrate (HFHC) diet and solTNF neutralization with XPro1595 impact brain immunomodulatory genes expression. a RT2 Profiler PCR Array analysis of the pre-frontal cortex demonstrate immunomodulatory genes significantly up- and downregulated (≥ 3-fold regulations changes) in the pre-frontal cortex in the presence of high-fat high-carbohydrate diet or soluble TNF neutralization. b-e HFHC diet increases Socs3 mRNA expression in the hypothalamus (n = 6, diet effect P = 0.0018); no significant changes in hypothalamic Tlr4, Lcn2, and Il-6 were observed. Tissues analyzed by qPCR had the Ct values normalized to the Ct values for Gapdh and Ppia. The relative expression level of the target gene (fold change) was expressed as 2−ΔΔCt, when compared with the mean DCt (threshold cycle) of the control group. Pre-frontal cortex samples were pooled together from an n = 6–7 mice per group. Abbreviations: qPCR, quantitative real-time reverse-transcription polymerase chain reaction; GAPDH, glyceraldehyde 3-phosphate dehydrogenase; Cxcl11, chemokine (C-X-C motif) ligand 11; Cxcl9, chemokine (C-X-C motif) ligand 9; Il1rn, interleukin 1 receptor antagonist; Il23a, interleukin 23, alpha subunit p19; Crp, C-reactive protein, pentraxin-related; Tnf, tumor necrosis factor; Tirap, Toll-interleukin 1 receptor (TIR) domain-containing adaptor protein; Ifn, interferon; Tnfsf14, tumor necrosis factor (ligand) superfamily, member 14; Ccr4, chemokine (C-C motif) receptor 4; Ccl20, chemokine (C-C motif) ligand 20; Ccr7, chemokine (C-C motif) receptor 7. qPCR data were analyzed by two-way ANOVA followed by Tukey’s multiple comparisons in GraphPad Prism 6. Bar height indicates mean of samples; error bars indicate standard error of the mean (SEM). Means with different lowercase letters are significantly different from each other, P < 0.05
Fig. 6
Fig. 6
solTNF blockade with XPro1595 reverts diet-induced pre-frontal cortex IRS1/Akt impairment. ab HFHC diet increases phosphorylated IRS1 (Ser 307) (n = 6, diet effect P = 0.0117). HFHC diet XPro 1595 interaction modulated phosphorylated Akt (Thr 308) (n = 6, diet effect P = 0.0180) in the prefrontal cortex. c, d Immunoblotting demonstrating the impact of HFHC diet in the hypothalamic phosphorylated IRS1 (Ser 307) (n = 6, diet effect P = 0.0245) and phosphorylated Akt (Thr 308) (n = 6, diet effect P = 0.0014). Immunoblots are representative of two independent experiments. Band intensity was calculated using Image Studio Lite, and values were normalized to intensity of β-act. Immunoblot images were cropped for comparison. Data were analyzed by two-way ANOVA followed by Tukey’s multiple comparisons in GraphPad Prism 6. Bar height indicates mean of samples; error bars indicate standard error of the mean (SEM). Lowercase letters indicate post hoc analysis. Means with different lowercase letters are significantly different from each other, P < 0.05
Fig. 7
Fig. 7
Neutralization of solTNF with XPro1595 prevents the sociability deficits and anxiety-like behavior induced by HFHC diet consumption. a Representative heat map demonstrating individual time spent in each chamber of a three-chamber sociability test. b HFHC diet decreased the percentage of preference of exploration for an unfamiliar mouse, and solTNF neutralization rescues this behavior alteration (n = 11–12, interaction P = 0.0027). c HFHC-fed mice percentage of exploration of a novel object (n = 11–12, interaction P = 0.0027). Preference for novel mouse was calculated as [(time spent exploring novel mouse)/(total time spent exploring empty cup and novel mouse)] × 100. Preference for novel object was calculated as [(time spent exploring empty cup)/(total time spent exploring empty cup and novel mouse)] × 100. de Soluble TNF neutralization and its interaction with HFHC diet impacted time (n = 12–12, P = 0.0152) and frequency (n = 12–13, P = 0.0349) in the center of an open field as an indication of anxiety-like behavior. Animal behavior activity assessed using EthoVision XT Software. f No changes in the number of marbles buried was observed between the groups. Heat map representative of a single experiment. Data were analyzed by two-way ANOVA followed by Tukey’s multiple comparisons in GraphPad Prism 6. Bar height indicates mean of samples; error bars indicate standard error of the mean (SEM). Lowercase letters indicate post hoc analysis. Means with different lowercase letters are significantly different from each other, P < 0.05

Similar articles

Cited by

References

    1. Zheng Y, Ley SH, Hu FB. Global aetiology and epidemiology of type 2 diabetes mellitus and its complications. Nat Rev Endocrinol. 2018;14(2):88–98. doi: 10.1038/nrendo.2017.151. - DOI - PubMed
    1. Arnold SE, et al. Brain insulin resistance in type 2 diabetes and Alzheimer disease: concepts and conundrums. Nat Rev Neurol. 2018;14(3):168–181. doi: 10.1038/nrneurol.2017.185. - DOI - PMC - PubMed
    1. Milanski M, et al. Inhibition of hypothalamic inflammation reverses diet-induced insulin resistance in the liver. Diabetes. 2012;61(6):1455–1462. doi: 10.2337/db11-0390. - DOI - PMC - PubMed
    1. Mu ZP, et al. Association between tumor necrosis factor-alpha and diabetic peripheral neuropathy in patients with type 2 diabetes: a meta-analysis. Mol Neurobiol. 2017;54(2):983–996. doi: 10.1007/s12035-016-9702-z. - DOI - PubMed
    1. Saltiel AR, Olefsky JM. Inflammatory mechanisms linking obesity and metabolic disease. J Clin Invest. 2017;127(1):1–4. doi: 10.1172/JCI92035. - DOI - PMC - PubMed

Publication types

MeSH terms

Substances