. 2020 Jan 21;117(3):1742-1752.
doi: 10.1073/pnas.1914742117. Epub 2019 Dec 31.

Microglial IRF5-IRF4 regulatory axis regulates neuroinflammation after cerebral ischemia and impacts stroke outcomes

Affiliations

Microglial IRF5-IRF4 regulatory axis regulates neuroinflammation after cerebral ischemia and impacts stroke outcomes

Abdullah Al Mamun et al. Proc Natl Acad Sci U S A. .

Abstract

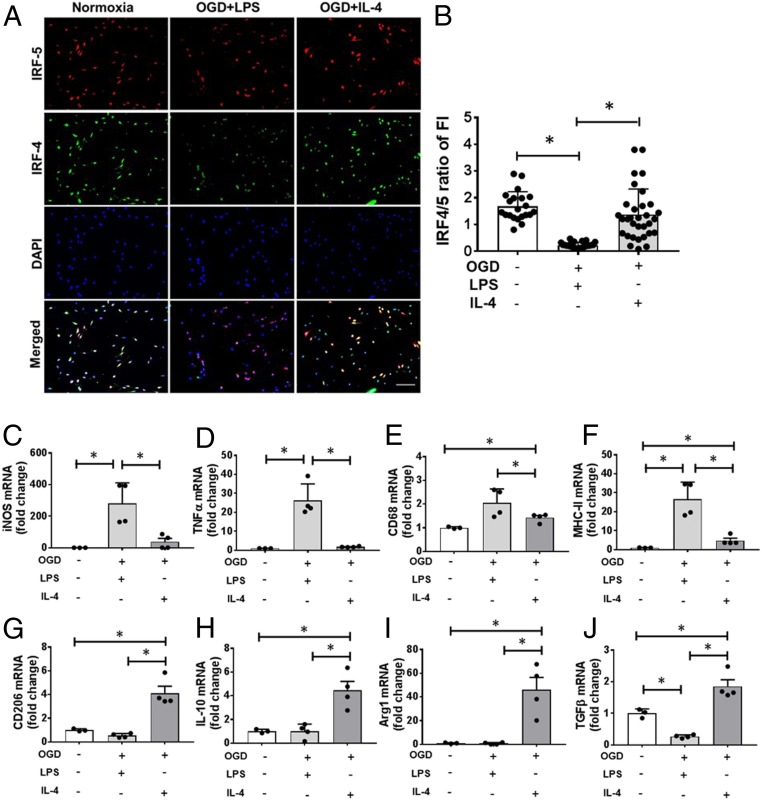
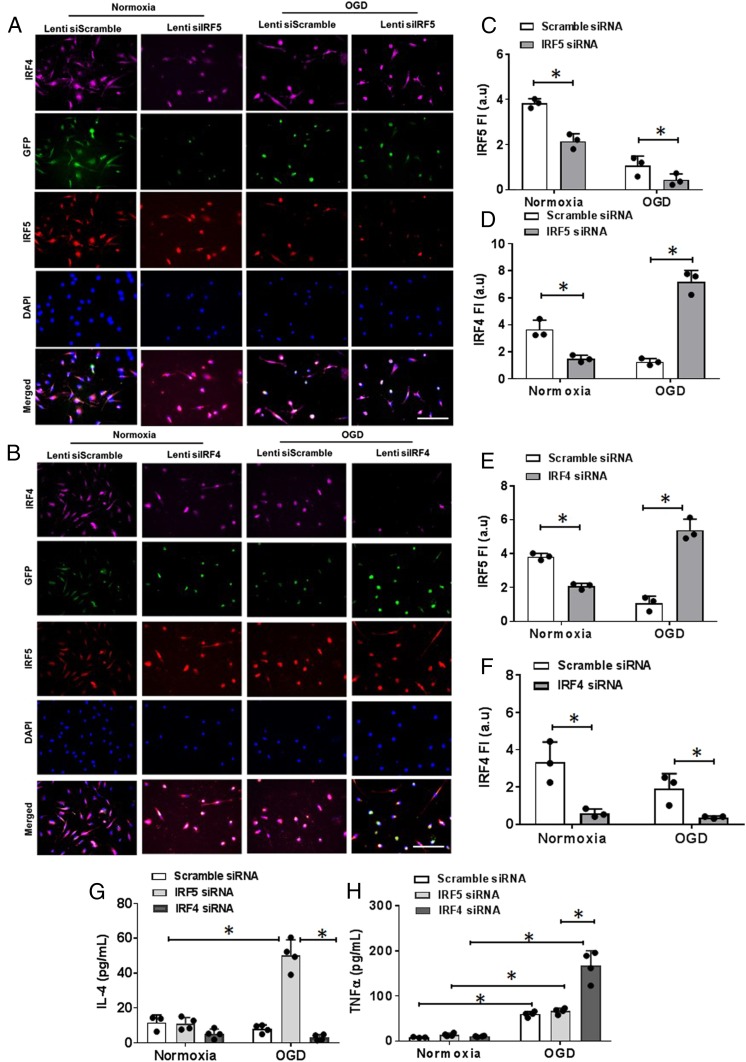
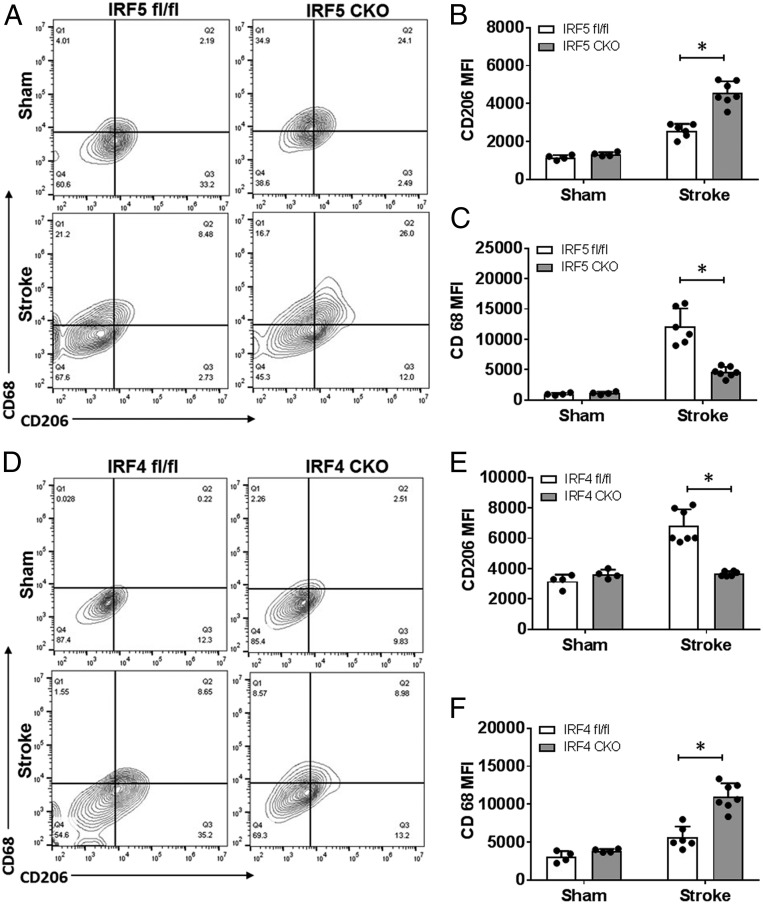
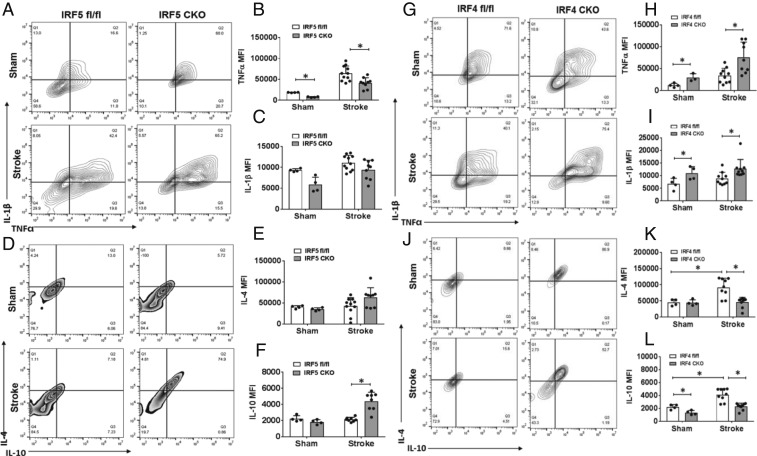
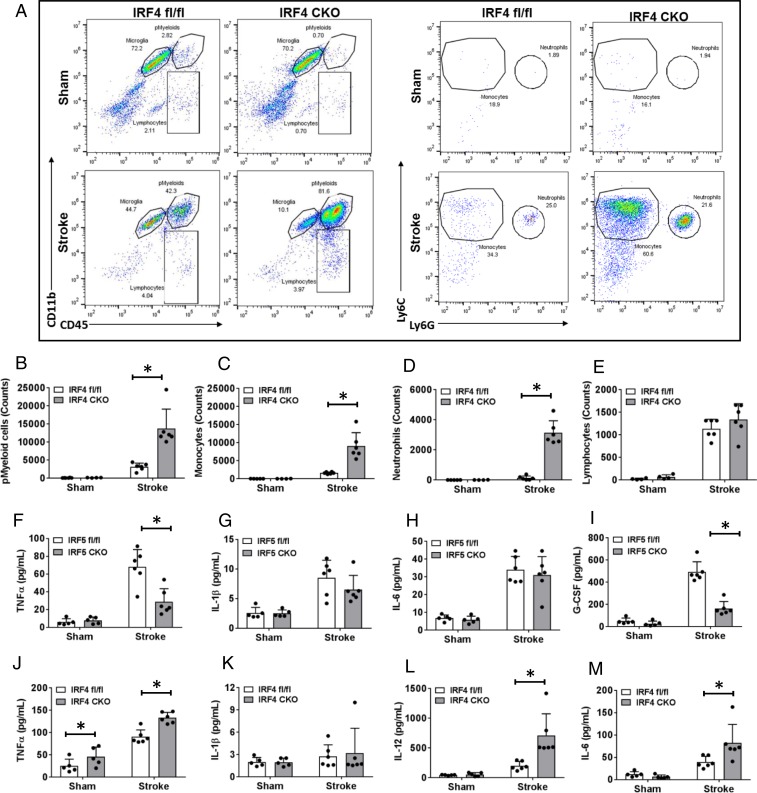
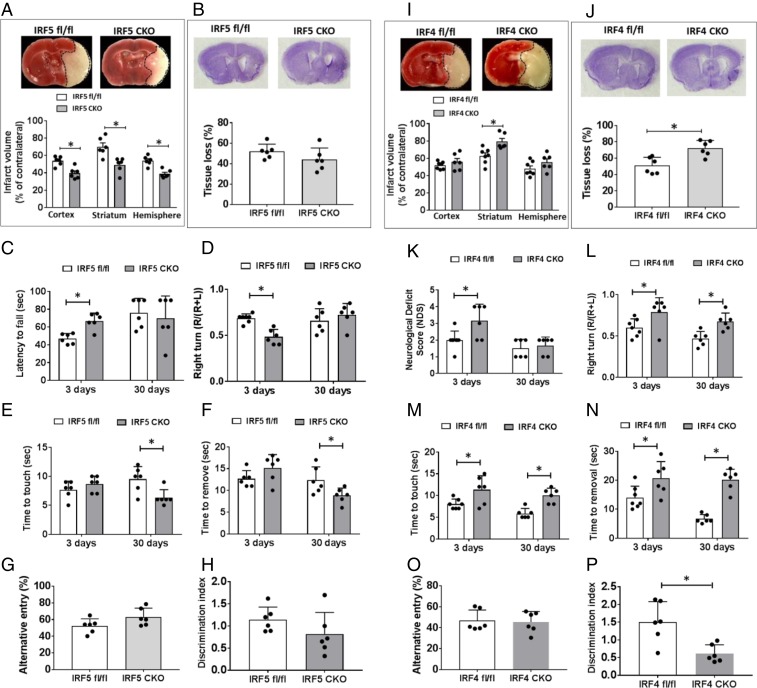
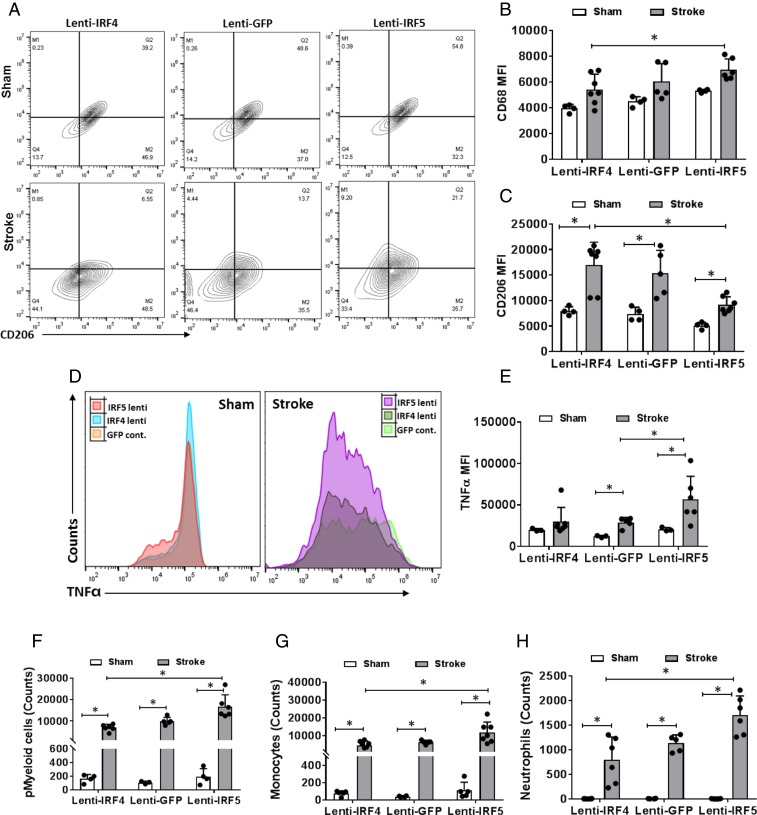
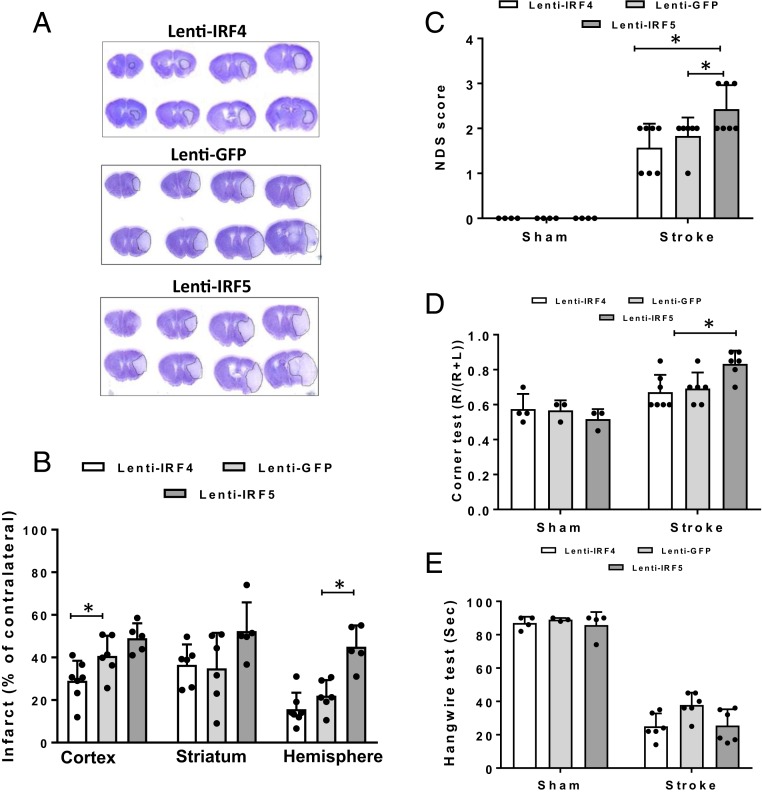
Microglial activation plays a central role in poststroke inflammation and causes secondary neuronal damage; however, it also contributes in debris clearance and chronic recovery. Microglial pro- and antiinflammatory responses (or so-called M1-M2 phenotypes) coexist and antagonize each other throughout the disease progress. As a result of this balance, poststroke immune responses alter stroke outcomes. Our previous study found microglial expression of interferon regulatory factor 5 (IRF5) and IRF4 was related to pro- and antiinflammatory responses, respectively. In the present study, we genetically modified the IRF5 and IRF4 signaling to explore their roles in stroke. Both in vitro and in vivo assays were utilized; IRF5 or IRF4 small interfering RNA (siRNA), lentivirus, and conditional knockout (CKO) techniques were employed to modulate IRF5 or IRF4 expression in microglia. We used a transient middle cerebral artery occlusion model to induce stroke and examined both acute and chronic stroke outcomes. Poststroke inflammation was evaluated with flow cytometry, RT-PCR, MultiPlex, and immunofluorescence staining. An oscillating pattern of the IRF5-IRF4 regulatory axis function was revealed. Down-regulation of IRF5 signaling by siRNA or CKO resulted in increased IRF4 expression, enhanced M2 activation, quenched proinflammatory responses, and improved stroke outcomes, whereas down-regulation of IRF4 led to increased IRF5 expression, enhanced M1 activation, exacerbated proinflammatory responses, and worse functional recovery. Up-regulation of IRF4 or IRF5 by lentivirus induced similar results. We conclude that the IRF5-IRF4 regulatory axis is a key determinant in microglial activation. The IRF5-IRF4 regulatory axis is a potential therapeutic target for neuroinflammation and ischemic stroke.

Keywords: brain; interferon regulatory factor; microglia; neuroinflammation; stroke.


Conflict of interest statement

The authors declare no competing interest.

Figures

Fig. 1.
Fig. 1.
Microglial IRF5-IRF4 expression and phenotypes after OGD. (A) ICC of primary microglia exposed to OGD+LPS or +IL-4 stimulation showing IRF5 and IRF4 expression. 20×; (Scale bar, 100 μm.) (B) Ratio of IRF4 over IRF5 fluorescence intensity (FI). Data were averaged from 21 to 24 microscopic fields from 3 independent experiments; each dot represents the FI of one 20× microscopic field. *P < 0.05. (CF) Proinflammatory mRNA levels by RT-PCR in cultured microglia. (GJ) Anti-inflammatory mRNA levels in microglia. Data were averaged from 3 to 4 independent experiments; each dot represents the mRNA level from one independent experiment. *P < 0.05.
Fig. 2.
Fig. 2.
IRF5-IRF4 expression and cytokine levels in siRNA/OGD-treated microglia cultures. (A and B) ICC staining of IRF5-IRF4 in IRF5 siRNA- (A) and IRF4 siRNA- (B) treated microglia. 40×; (Scale bar, 100 μm.) (CF) IRF5-IRF4 fluorescence intensity in IRF5 siRNA- (C and D) and IRF4 siRNA- (E and F) treated microglia. (G and H) IL-4 and TNFα levels by ELISA in cell-culture medium. Data were averaged from 3 independent experiments with duplicate wells, and each dot represents the average FI of 12 to 16 random 40× microscopic fields. *P < 0.05.
Fig. 3.
Fig. 3.
Cell-membrane inflammatory marker levels in IRF5 or IRF4 CKO microglia by flow cytometry performed on stroke and sham brains. (A and D) Representative flow plots of IRF5 (A) and IRF4 (D) CKO microglia gated by CD68 and CD206. Quantification data were presented as MFI. The MFI of CD206 and CD68 is shown in B and C for IRF5 CKO and in E and F for IRF4 CKO microglia. n = 4 to 5 per sham and 6 to 7 per stroke group; *P < 0.05.
Fig. 4.
Fig. 4.
Intracellular cytokine levels in IRF5 or IRF4 CKO microglia by flow cytometry performed on stroke and sham brains. Quantification data are presented as mean MFI. (AL) Data of IRF4 and IRF5 CKO microglia, respectively. A, D, G, and J are representative intracellular staining plots for TNFα/IL-1β and IL-4/IL-10. MFI of these cytokines were quantified in BF for IRF5 CKO and in H, I, K, and L for IRF4 CKO microglia. n = 4 to 5 per sham and 6 to 7 per stroke group; *P < 0.05.
Fig. 5.
Fig. 5.
Brain infiltration of peripheral immune cells and circulating cytokine levels in IRF5 or IRF4 CKO mice. (A, Left) Flow plots: representative gating plots for total pMyeloid, microglia, and lymphocytes. (A, Right) Flow plots: gating strategy for monocytes and neutrophils. (B) Percentage of pMyeloid cells. (CE) Absolute cell counts of monocytes (C), neutrophils (D), and lymphocytes (E). (FM) Plasma levels of cytokines in IRF5 and IRF4 CKO mice, respectively. n = 5 to 6 per sham and 6 to 7 per stroke group; *P < 0.05.
Fig. 6.
Fig. 6.
Stroke outcomes from IRF5 and IRF4 CKO mice after MCAO. (A and I) Representative images of TTC-stained brain slices and quantification of infarct size in IRF5 (A) and IRF4 (I) CKO mice brains at 3 d of MCAO. (B and J) Representative images of CV-stained brain slices and quantification of tissue loss in IRF5 (B) and IRF4 (J) CKO mice brains at 30 d of MCAO. For IRF5 CKO mice, hanging wire test (C), corner test (D), and tape removal test (E and F) were performed at 3 d and 30 d after stroke; Y-maze (G) and NORT (H) were tested only at 30 d. For IRF4 CKO group, NDS (K), corner test (L), and tape removal test (M and N) were performed at both acute and chronic stages of stroke; Y-maze (O) and NORT (P) were tested only at 30 d. n = 6 to 7 per group; *P < 0.05.
Fig. 7.
Fig. 7.
Microglial activation and peripheral immune cell infiltration in IRF5 or IRF4 lentivirus-treated C57BL/6 mice brains after stroke. Lenti-GFP served as a control lentivirus for lenti-IRF5 and -IRF4. (A) Representative flow plots of CD68/CD206-gated microglia from lenti-IRF5/-IRF4–treated mice. (B and C) Quantification of CD68 (B) and CD206 (C) MFI in lenti-IRF5/-IRF4–treated microglia. (D) Representative histogram plots for intracellular TNFα expression in lentivirus-treated microglia. (E) Quantification of TNFα MFI in D. (FH) Absolute cell counts of infiltrating pMyeloid cells (F), monocytes (G), and neutrophils (H) in lentivirus-treated mice brains after stroke. n = 5 for Lenti-GFP control and 6 for the lenti-IRF4 or -IRF5 group; *P < 0.05.
Fig. 8.
Fig. 8.
Stroke outcomes from lentivirus-treated C57BL/6 mice after MCAO. (A) Representative images of CV-stained brain slices from lenti-IRF5/-IRF4–treated mice. (B) Quantification of infarct size in A. (CE) Behavioral deficit data in the NDS (C), corner test (D), and hanging wire test (E) for lenti-IRF5/-IRF4–treated mice. n = 5 for Lenti-GFP control and 6 for lenti-IRF4 or -IRF5 group; *P < 0.05.

References

    1. Rayasam A., et al. , Immune responses in stroke: How the immune system contributes to damage and healing after stroke and how this knowledge could be translated to better cures? Immunology 154, 363–376 (2018). - PMC - PubMed
    1. Devarajan P., Chen Z., Autoimmune effector memory T cells: The bad and the good. Immunol. Res. 57, 12–22 (2013). - PMC - PubMed
    1. Faustino J. V., et al. , Microglial cells contribute to endogenous brain defenses after acute neonatal focal stroke. J. Neurosci. 31, 12992–13001 (2011). - PMC - PubMed
    1. Lalancette-Hébert M., Gowing G., Simard A., Weng Y. C., Kriz J., Selective ablation of proliferating microglial cells exacerbates ischemic injury in the brain. J. Neurosci. 27, 2596–2605 (2007). - PMC - PubMed
    1. Hu X., et al. , Microglia/macrophage polarization dynamics reveal novel mechanism of injury expansion after focal cerebral ischemia. Stroke 43, 3063–3070 (2012). - PubMed

Publication types