

Deconvolving the input to random abstract parabolic systems: a population model-based approach to estimating blood/breath alcohol concentration from transdermal alcohol biosensor data
- PMID: 31892764
- PMCID: PMC6938217
- DOI: 10.1088/1361-6420/aae791
Deconvolving the input to random abstract parabolic systems: a population model-based approach to estimating blood/breath alcohol concentration from transdermal alcohol biosensor data
Abstract
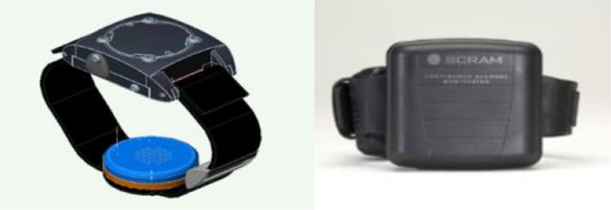
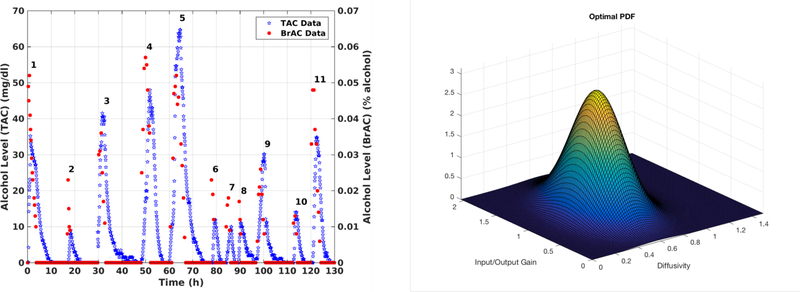
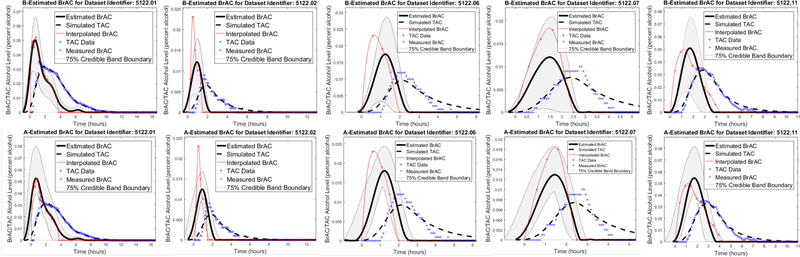
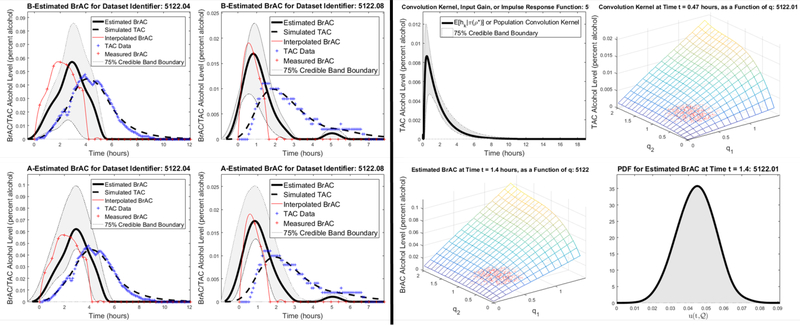
The distribution of random parameters in, and the input signal to, a distributed parameter model with unbounded input and output operators for the transdermal transport of ethanol are estimated. The model takes the form of a diffusion equation with the input, which is on the boundary of the domain, being the blood or breath alcohol concentration (BAC/BrAC), and the output, also on the boundary, being the transdermal alcohol concentration (TAC). Our approach is based on the reformulation of the underlying dynamical system in such a way that the random parameters are treated as additional spatial variables. When the distribution to be estimated is assumed to be defined in terms of a joint density, estimating the distribution is equivalent to estimating a functional diffusivity in a multi-dimensional diffusion equation. The resulting system is referred to as a population model, and well-established finite dimensional approximation schemes, functional analytic based convergence arguments, optimization techniques, and computational methods can be used to fit it to population data and to analyze the resulting fit. Once the forward population model has been identified or trained based on a sample from the population, the resulting distribution can then be used to deconvolve the BAC/BrAC input signal from the biosensor observed TAC output signal formulated as either a quadratic programming or linear quadratic tracking problem. In addition, our approach allows for the direct computation of corresponding credible bands without simulation. We use our technique to estimate bivariate normal distributions and deconvolve BAC/BrAC from TAC based on data from a population that consists of multiple drinking episodes from a single subject and a population consisting of single drinking episodes from multiple subjects.
Keywords: Deconvolution; Distributed parameter systems; Linear semigroups of operators; Population model; Random abstract parabolic systems; System identification; Transdermal alcohol biosensor.
Figures
References
-
- Banks HT and Burns JA. Hereditary control problems: Numerical methods based on averaging approximations. SIAM Journal on Control and Optimization, 16(2):169–208, 1976.
-
- Banks HT, Burns JA, and Cliff EM. Parameter estimation and identification for systems with delays. SIAM Journal on Control and Optimization, 19(6):791–828, 1981.
-
- Banks HT and Clayton Thompson W. Least squares estimation of probability measures in the Prohorov metric framework. Technical report, DTIC Document, 2012.
-
- Thomas Banks H and Kunisch Karl Estimation Techniques for Distributed Parameter Systems. Birkhauser, Boston-Basel-Berlin, 1989.
Grants and funding
LinkOut - more resources
Full Text Sources