. 2020 Dec;77(23):4899-4919.
doi: 10.1007/s00018-019-03434-5. Epub 2019 Dec 31.

Integrative genomics reveal a role for MCPIP1 in adipogenesis and adipocyte metabolism

Affiliations

Integrative genomics reveal a role for MCPIP1 in adipogenesis and adipocyte metabolism

Magdalena Losko et al. Cell Mol Life Sci. 2020 Dec.

Abstract

Obesity is considered a serious chronic disease, associated with an increased risk of developing cardiovascular diseases, non-alcoholic fatty liver disease and type 2 diabetes. Monocyte chemoattractant protein-1-induced protein-1 (MCPIP1) is an RNase decreasing stability of transcripts coding for inflammation-related proteins. In addition, MCPIP1 plays an important role in the regulation of adipogenesis in vitro by reducing the expression of key transcription factors, including C/EBPβ. To elucidate the role of MCPIP1 in adipocyte biology, we performed RNA-Seq and proteome analysis in 3T3-L1 adipocytes overexpressing wild-type (WTMCPIP1) and the mutant form of MCPIP1 protein (D141NMCPIP1). Our RNA-Seq analysis followed by confirmatory Q-RT-PCR revealed that elevated MCPIP1 levels in 3T3-L1 adipocytes upregulated transcripts encoding proteins involved in signal transmission and cellular remodeling and downregulated transcripts of factors involved in metabolism. These data are consistent with our proteomic analysis, which showed that MCPIP1 expressing adipocytes exhibit upregulation of proteins involved in cellular organization and movement and decreased levels of proteins involved in lipid and carbohydrate metabolism. Moreover, MCPIP1 adipocytes are characterized by decreased level of insulin receptor, reduced insulin-induced Akt phosphorylation, as well as depleted Glut4 level and impaired glucose uptake. Overexpression of Glut4 in 3T3-L1 cells expressed WTMCPIP1 rescued adipogenesis. Interestingly, we found decreased level of MCPIP1 along with an increase in body mass index in subcutaneous adipose tissue. The presented data show a novel role of MCPIP1 in modulating insulin sensitivity in adipocytes. Overall, our findings demonstrate that MCPIP1 is an important regulator of adipogenesis and adipocyte metabolism.

Keywords: C/EBPα; Lipid homeostasis; Pparγ; Regnase-1.


Conflict of interest statement

The authors declare no conflict of interest. These experiments are performed according to law of EU.

Figures

Fig. 1
Fig. 1
MCPIP1 levels in human adipose tissue of lean and obese subjects. a Scatter dot plot graph (mean ± SEM) showing expression analysis of MCPIP1, IL-6, MCP-1 and CD68 mRNA in SAT and VAT adipose tissues of lean (BMI < 28; MCPIP1: n = 9 for SAT and n = 7 for VAT; IL6: n = 4 for SAT and n = 3 for VAT; MCP-1: n = 4 for SAT and n = 6 for VAT; CD68: n = 6 for SAT and n = 6 for VAT) and obese (BMI > 30; MCPIP1: n = 12 for SAT and n = 17 for VAT; IL6: n = 11 for SAT and n = 16 for VAT; MCP-1: n = 12 for SAT and n = 15 for VAT; CD68: n = 8 for SAT and n = 16 for VAT) subjects estimated by Q-RT-PCR. Transcript levels were normalized to EF2 mRNA levels. P values were estimated using two-tailed unpaired Student t test. b Left panel: Western blot analysis of MCPIP1 protein levels in subjects with different range of BMI in SAT (BMI: 27–49; n = 7) and c VAT (BMI: 27–57; n = 8). MCPIP1 protein levels were normalized to β-actin as the loading control. b, c Right panel presents the quantification of correlation between the MCPIP1 protein level and BMI in SAT and VAT. Statistical significance was determined with Pearson’s correlation. *p < 0.05; **p < 0.01
Fig. 2
Fig. 2
Global transcriptome analysis of 3T3-L1 adipocytes overexpressing wild-type or mutant MCPIP1 at day 2 of differentiation. a Venn diagrams present the number of differentially expressed transcripts (adj. p value < 0.05) in adipocytes expressing WTMCPIP1 and D141NMCPIP1 relative to the control cells (WTMCPIP1 vs. Control and D141NMCPIP1 vs. Control datasets; data was obtained for 3 biological replicates). b Heatmap of 30 genes that are associated with adipocyte biology and adipogenesis (adj. p value < 0.05; fold change ≥ 1.5). Each column represents an individual sample. c KEGG analysis of differentially expressed genes in WTMCPIP1 vs. Control and d WTMCPIP1 vs. D141NMCPIP1 adipocytes. Scale is the −log10 (p value) of the enrichment score. Red bars indicate upregulated genes and blue bars downregulated genes.
Fig. 3
Fig. 3
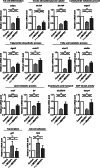
MCPIP1 decreases transcripts coding for proteins involved in lipid metabolism. Q-RT-PCR analysis of cebpa, slc2a4, tbc1d4, mgat1, dgat2, srebf1, elovl1, stat5a, scd1, lpl, slc25a10, dusp4, gli1 and flrt2 in Control, WTMCPIP1 and D141NMCPIP1 adipocytes at day 2 of differentiation. Transcript levels are normalized to ef2 mRNA levels as a reference control. Data are presented as fold change (normalized to control cells) and as mean ± SD of four independent experiments. Statistical significance was determined with one-way ANOVA. *p < 0.05; **p < 0.01; ***p < 0.001
Fig. 4
Fig. 4
Global proteome changes in 3T3-L1 adipocytes overexpressing wild-type or mutant MCPIP1 at day 4 of differentiation. a Venn diagram comparison of proteomes (adj. p value < 0.05) from adipocytes expressing WTMCPIP1 or D141NMCPIP1 and control cells (left panel: WTMCPIP1 vs. Control; WTMCPIP1 vs. D141NMCPIP1 and D141NMCPIP1 vs. Control datasets; right panel: WTMCPIP1 vs. Control and WTMCPIP1 vs. D141NMCPIP1, both upregulated and downregulated proteins datasets; data were obtained for 3 biological replicates). b IPA analysis of significantly activated and inhibited biological processes in WTMCPIP1 vs Control and c WTMCPIP1 and D141NMCPIP1 group. Red and green bars indicate increased (z-score > 1) and decreased (z-score <  − 1) activation of biological process, respectively. d Potential upstream regulators predicted by IPA analysis (p value < 0.05) in WTMCPIP1 vs Control and e WTMCPIP1 and D141NMCPIP1 group. Proteins are indicated by their gene names. Red (z-score > 1) and green (z-score <  − 1) colors indicate increased and decreased protein levels, respectively.
Fig. 5
Fig. 5
MCPIP1 impairs glucose uptake in 3T3-L1 adipocytes a Western blot analysis of MCPIP1, Glut4 with β-actin as the loading control in 3T3-L1 adipocytes overexpressing wild-type or mutant MCPIP1 and control cells at day 8 of differentiation. Left panel: representative Western blot. Right panel: densitometric quantification of Glut4 protein normalized to β-Actin. Data are presented as fold change (normalized to control cells) and as mean ± SD of three independent experiments. b Analysis of insulin-stimulated 2-deoxyglucose (2-DG) uptake in 3T3-L1 adipocytes overexpressing wild-type or mutant MCPIP1 and control cells at day 8 of differentiation. Data are presented as fold change (normalized to control cells) and as mean ± SD of three independent experiments. Statistical significance was determined with one-way ANOVA. *p < 0.05; **p < 0.01; ***p < 0.001 c Immunofluorescent staining for Glut4. Representative merged images of 3T3-L1 adipocytes overexpressing wild-type or mutant MCPIP1 and control cells at day 8 of differentiation (Hoechst 33,258 dye used for nuclei; Glut4 antibody labeled with fluorescent dye AlexaFluor 488). Scale bar represents 50 μm. d Scatter dot plot graph (mean ± SEM) showing expression analysis of SLC2A4 mRNA in SAT and VAT adipose tissues of lean (BMI < 28; n = 7 for SAT and n = 6 for VAT) and obese (BMI > 30; n = 10 for SAT and n = 13 for VAT) subjects estimated by Q-RT-PCR. Transcript levels were normalized to EF2 mRNA levels. p values were estimated using two-tailed unpaired Student t test
Fig. 6
Fig. 6
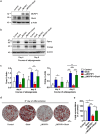
Enforced expression of Glut4 rescues differentiation in 3T3-L1 adipocytes expressing wild-type MCPIP1. a Representative Western blot for MCPIP1 and Glut4 protein levels from total cell lysates of WTMCPIP1, Glut4, WTMCPIP1 + Glut4 and adipocytes with an empty vector (Control) at day 0 of differentiation. b Representative Western blot for PPARγ and C/EBPα from total cell lysates of WTMCPIP1, Glut4, WTMCPIP1 + Glut4 and adipocytes with an empty vector (Control) at day 4 and 8 of differentiation. c Densitometric quantification of PPARγ (n = 4) and d C/EBPα (n = 4) protein levels normalized to β-Actin and presented as mean ± SD. Statistical significance was determined with one-way ANOVA. *p < 0.05; **p < 0.01; **p < 0.001 e Oil O Red staining of lipid droplets accumulated by 3T3-L1 adipocytes overexpressed wild-type MCPIP1, Glut4 or both wild-type MCPIP1 and Glut4 and control cells at day 8 of adipogenic differentiation. The pictures represent data from one of four independent experiments. Scale bar represents 100 μm. f Graph presenting percentage of accumulated lipid droplets estimated by measuring the absorbance of stain extracted with 100% isopropanol. Data are presented as mean ± SD of four independent experiments (normalized to control cells). Statistical significance was determined with one-way ANOVA. *p < 0.05; ***p < 0.001
Fig. 7
Fig. 7
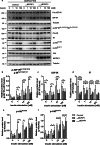
MCPIP1 diminishes insulin receptor activation and downstream signaling in 3T3-L1 adipocytes. a Representative Western blots from total cell lysates of WTMCPIP1, D141NMCPIP1 and adipocytes with an empty vector (Control) at day 8 of differentiation without (0 nM) and after 15 min of 1, 10 or 100 nM insulin stimulation. b Quantification of tyrosine phosphorylated IGF1R/IR in 3T3-L1 adipocytes, after insulin stimulation, normalized to tubulin level (n = 3). c Quantification of total IGF1R protein level, after insulin stimulation in 3T3-L1 adipocytes, normalized to tubulin level (n = 3). d Quantification of total IR protein level, after insulin stimulation in 3T3-L1 adipocytes, normalized to tubulin level (n = 4). e Quantification of p-Akt Thr308 and f p-Akt Ser473 protein level, after insulin stimulation in 3T3-L1 adipocytes, normalized to total Akt level (n = 4). Data are presented as mean ± SD of three or four independent experiments (as indicated above). Statistical significance was determined with two-way ANOVA. *p < 0.05; **p < 0.01; ***p < 0.001

Similar articles

Cited by

References

    1. Mino T, Murakawa Y, Fukao A, et al. Regnase-1 and roquin regulate a common element in inflammatory mRNAs by spatiotemporally distinct mechanisms. Cell. 2015;161:1058–1073. doi: 10.1016/j.cell.2015.04.029. - DOI - PubMed
    1. Wilamowski M, Gorecki A, Dziedzicka-Wasylewska M, Jura J. Substrate specificity of human MCPIP1 endoribonuclease. Sci Rep. 2018 doi: 10.1038/s41598-018-25765-2. - DOI - PMC - PubMed
    1. Suzuki HI, Arase M, Matsuyama H, et al. MCPIP1 ribonuclease antagonizes dicer and terminates microRNA biogenesis through precursor microRNA degradation. Mol Cell. 2011;44:424–436. doi: 10.1016/j.molcel.2011.09.012. - DOI - PubMed
    1. Mizgalska D, Wegrzyn P, Murzyn K, et al. Interleukin-1-inducible MCPIP protein has structural and functional properties of RNase and participates in degradation of IL-1β mRNA. FEBS J. 2009;276:7386–7399. doi: 10.1111/j.1742-4658.2009.07452.x. - DOI - PubMed
    1. Matsushita K, Takeuchi O, Standley DM, et al. Zc3h12a is an RNase essential for controlling immune responses by regulating mRNA decay. Nature. 2009;458:1185–1190. doi: 10.1038/nature07924. - DOI - PubMed

MeSH terms