

Peroxisomal fission is modulated by the mitochondrial Rho-GTPases, Miro1 and Miro2
- PMID: 31894645
- PMCID: PMC7001505
- DOI: 10.15252/embr.201949865
Peroxisomal fission is modulated by the mitochondrial Rho-GTPases, Miro1 and Miro2
Abstract
Peroxisomes are essential for a number of cellular functions, including reactive oxygen species metabolism, fatty acid β-oxidation and lipid synthesis. To ensure optimal functionality, peroxisomal size, shape and number must be dynamically maintained; however, many aspects of how this is regulated remain poorly characterised. Here, we show that the localisation of Miro1 and Miro2-outer mitochondrial membrane proteins essential for mitochondrial trafficking-to peroxisomes is not required for basal peroxisomal distribution and long-range trafficking, but rather for the maintenance of peroxisomal size and morphology through peroxisomal fission. Mechanistically, this is achieved by Miro negatively regulating Drp1-dependent fission, a function that is shared with the mitochondria. We further find that the peroxisomal localisation of Miro is regulated by its first GTPase domain and is mediated by an interaction through its transmembrane domain with the peroxisomal-membrane protein chaperone, Pex19. Our work highlights a shared regulatory role of Miro in maintaining the morphology of both peroxisomes and mitochondria, supporting a crosstalk between peroxisomal and mitochondrial biology.
Keywords: Fis1; Rhot1; Rhot2; oscillatory; tail-anchored.
© 2020 The Authors. Published under the terms of the CC BY 4.0 license.
Conflict of interest statement
The authors declare that they have no conflict of interest.
Figures
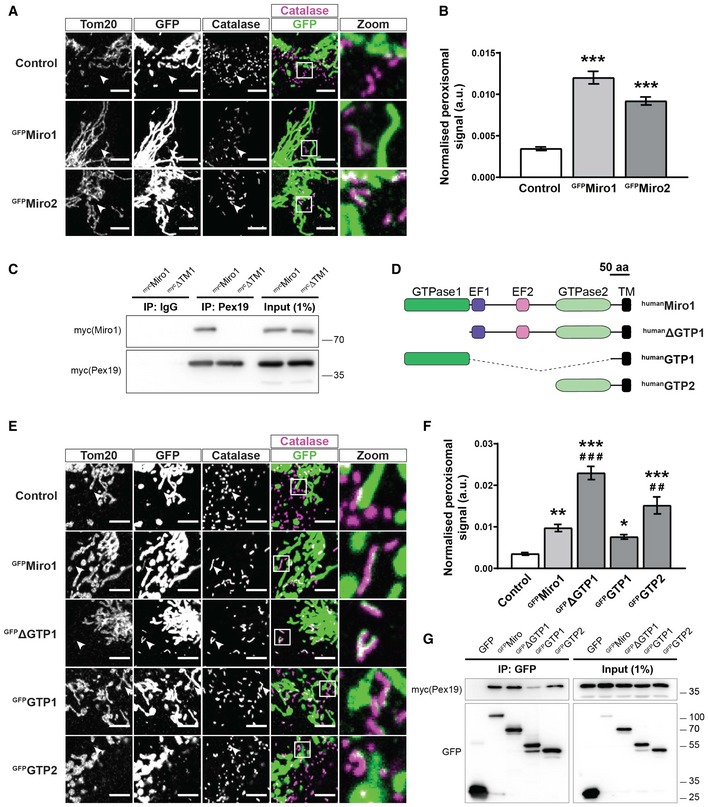
Representative zooms of WT MEFs transfected with GFP‐tagged Miro1 and Miro2 (GFPMiro1 and GFPMiro2). Control is GFP fused to the first 70 amino acids of Tom70. Tom20 and catalase stain mitochondria and peroxisomes, respectively. Merge is of Miro (green) and catalase (magenta) with co‐localisation shown as white. White arrowheads highlight an area where an isolated peroxisome is situated.
Quantification of the extent of GFP signal on peroxisomes.
Pulldown of overexpressed Pex19 in Cos7 cells with a Pex19 antibody shows interaction with full‐length Miro1 (mycMiro1), but not Miro1 lacking the transmembrane domain (mycΔTM1).
Schematic of Miro1 truncation mutants used in E‐G. TM denotes the transmembrane domain.
Representative images of Miro1 truncation constructs expressed in DKO MEFs. Mitochondria and peroxisomes are stained with Tom20 and catalase, respectively. White arrowheads highlight an area where an isolated peroxisome is situated.
Quantification of the extent of peroxisomal localisation of the Miro1 truncation constructs.
Co‐immunoprecipation of Miro1 truncation constructs and mycPex19 following transfection into Cos7 cells. GFP‐tagged Miro1 truncation constructs were pulled down with GFP‐Trap agarose beads, and Pex19 was probed with myc antibody.
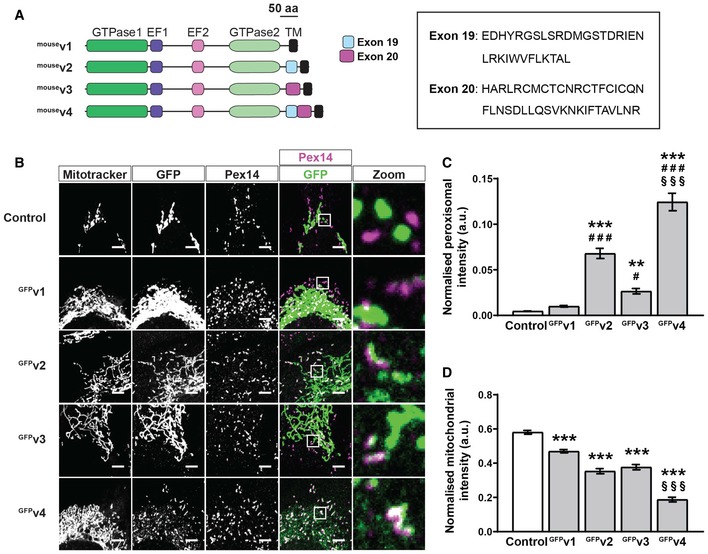
Schematic of mouse Miro1 splice variants including amino acid sequences of exon 19 and exon 20. TM denotes the transmembrane domain.
Representative images of DKO MEFs expressing control (GFP‐tagged 1‐70 of Tom70) or mouse Miro1 splice variants (GFPv1, GFPv2, GFPv3 and GFPv4 corresponding to variants 1, 2, 3 and 4, respectively). MitoTracker stains mitochondria, and Pex14 stains peroxisomes. Scale bar is 5 μm.
Comparison of Miro1 splice variant localisation to peroxisomes by thresholded GFP signal on Pex14‐positive and MitoTracker‐negative structures.
Comparison of splice variant localisation to mitochondria by thresholded GFP signal on MitoTracker‐positive and Pex14‐negative structures.
- A
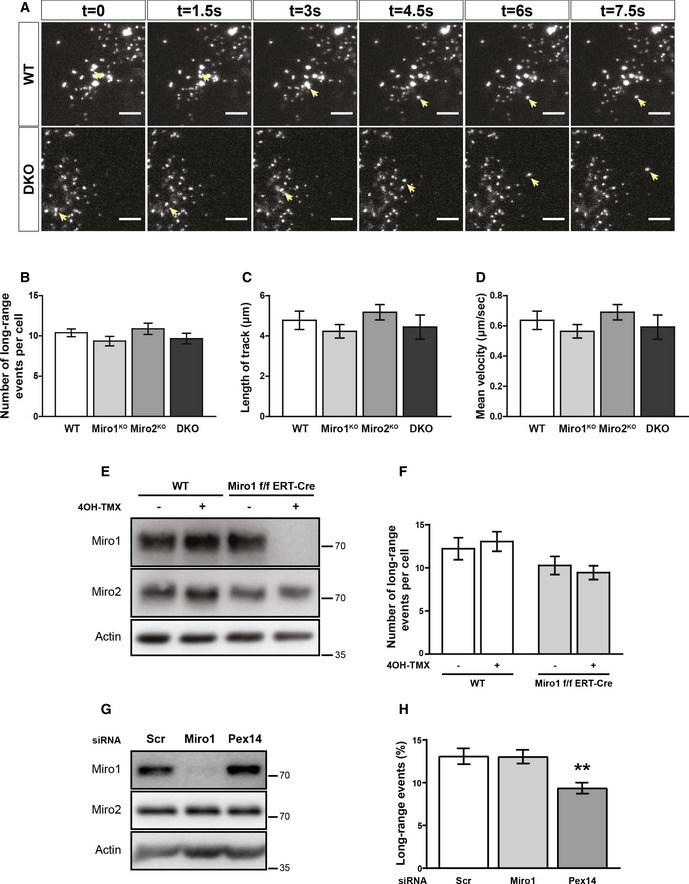
Six consecutive frames of live trafficking of peroxisomes (pxDsRed signal at 1.5 s per frame). Yellow arrows show the trajectory of a fast‐moving peroxisome in both WT and DKO MEFs. Scale bar is 5 μm.
- B
Blind scoring of the number of long‐range peroxisomal trafficking events in WT, Miro1KO and Miro2KO and DKO MEFs (n = 42 cells over six independent experiments. Two different MEFs lines were used for each genotype).
- C, D
Quantification of individual track length and velocity, respectively (n = 24 cells over three independent experiments).
- E
Representative blots of Miro1, Miro2 and actin from whole cell lysates of wild‐type and Miro1‐floxed ERT‐Cre‐recombinase MEFs treated with and without 4‐OH tamoxifen for 48 hours. Lysates were taken 1 day after the end of treatment.
- F
Quantification of long‐range peroxisomal trafficking events by blind scoring of pxDsRed signal from a two‐minute movie (n = 18 cells per condition over three independent experiments).
- G
Representative blot of Miro1 and Miro2 following knockdown of either Miro1 or Pex14 in HeLa cells.
- H
Quantification of long‐range peroxisomal trafficking events (visualised with pxGFP) in HeLa cells transfected with scrambled, Miro1 and Pex14 siRNA, by blind scoring of a 5‐min movie (n = 18 cells over three independent experiments).
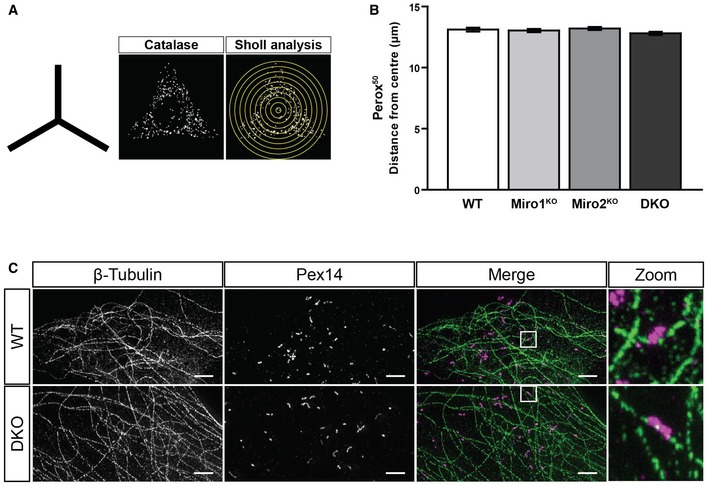
Schematic of the shape of the fibronectin patterns used for organelle distribution experiments and representative image of catalase signal of WT MEF on a micropattern along with a schematic of Sholl analysis.
Quantification of the distance at which 50% of peroxisomal signal is situated in WT, Miro1KO, Miro2KO and DKO MEFs following Sholl analysis (n = 60 cells per condition over three independent experiments). No statistical significance was observed following a one‐way ANOVA. All data are represented as mean ± SEM.
Representative images of STED imaging of β‐tubulin (microtubules in green) and Pex14 (peroxisomes in magenta) in WT and DKO MEFs. Scale bar is 2 μm.
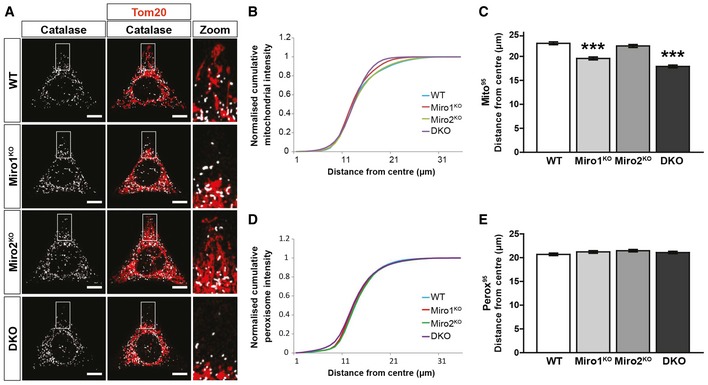
Representative images of WT, Miro1KO, Miro2KO and DKO MEFs seeded onto Y‐shaped fibronectin micropatterns stained for mitochondria (Tom20 in red) and peroxisomes (catalase in white). Scale bar represents 10 μm.
Normalised cumulative distribution of mitochondria in WT, Miro1KO, Miro2KO and DKO MEFs.
Distance at which 95% of mitochondria are distributed (Mito95) for all four genotypes of MEF.
Normalised cumulative distribution curves comparing the peroxisomal distribution from the centre of the cell to the periphery of WT, Miro1KO, Miro2KO and DKO MEFs.
Bar graph comparing the average distance at which 95% of the peroxisomal signal is distributed (Perox95).
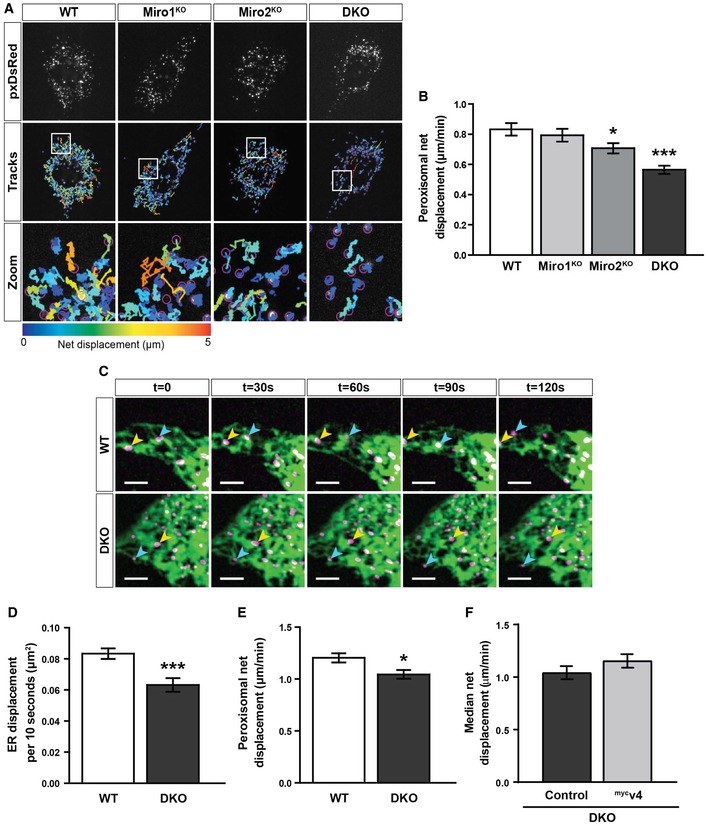
Snapshots and tracks of pxDsRed signal in WT, Miro1KO, Miro2KO and DKO MEFs following live imaging at 1.5 s per frame for 2 min.
Quantification of median net displacement of individual peroxisomes (pxDsRed signal) for WT, Miro1KO, Miro2KO and DKO MEFs (n = 42 cells over six independent experiments. Two different MEFs lines were used for each genotype).
Still images every 30 s of ER and peroxisomes (ER‐DsRed pseudo‐coloured to green and pxGFP pseudo‐coloured to magenta, respectively) in WT and DKO MEFs taken from 2‐min movies by live‐cell spinning‐disc microscopy. Arrows track individual peroxisomes associated with an ER tubule. Scale bar is 5 μm.
Quantification of the relative ER displacement over a 2‐min movie using ER‐DsRed signal in WT and DKO MEFs (n = 20 cells per condition over three independent experiments).
Median net displacement of peroxisomes in WT and DKO MEFs. n = 20 cells per condition over three independent experiments.
Median net displacement of peroxisomes in DKO MEFs with and without myc‐tagged variant 4 of Miro1 (mycv4) (n = 12 cells per condition over three independent experiments).
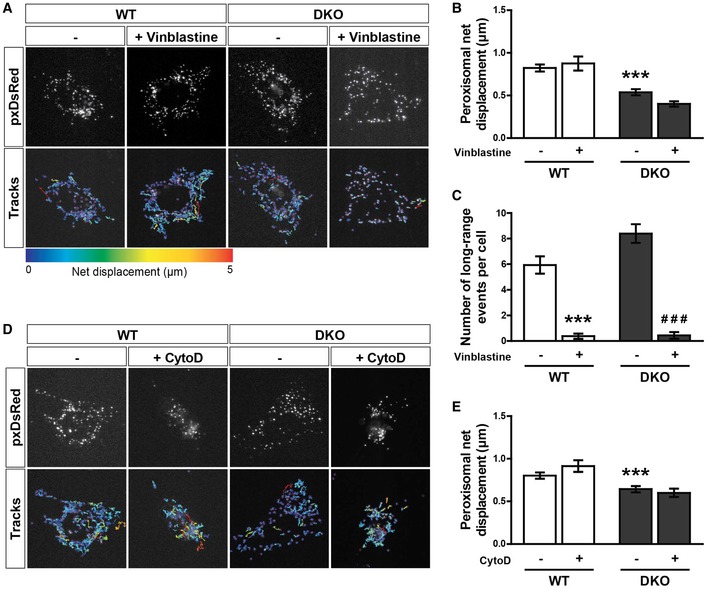
Snapshots and tracks from representative movies of peroxisome motility (pxDsRed) of untreated and vinblastine‐treated (1 μM for 1 h) WT and DKO MEFs. Movies were acquired at 1.5 s per frame for 2 min.
Median net displacement of peroxisomes over a 2‐min period (n = 16 cells per condition over three independent experiments).
Blind scoring of long‐ranged peroxisomal trafficking events per cell over a 2‐min movie. n = 16 cells per condition over three independent experiments.
Snapshots and tracks from representative movies of peroxisome motility (pxDsRed) of untreated and cytochalasin‐D (CytoD)‐treated (1 μg/ml for 30 min) WT and DKO MEFs. Movies were acquired at 1.5 s per frame for 2 min.
Median net displacement of peroxisomes from untreated and cytochalasin‐D‐treated WT and DKO MEFs (n = 18 cells per condition over three independent experiments).
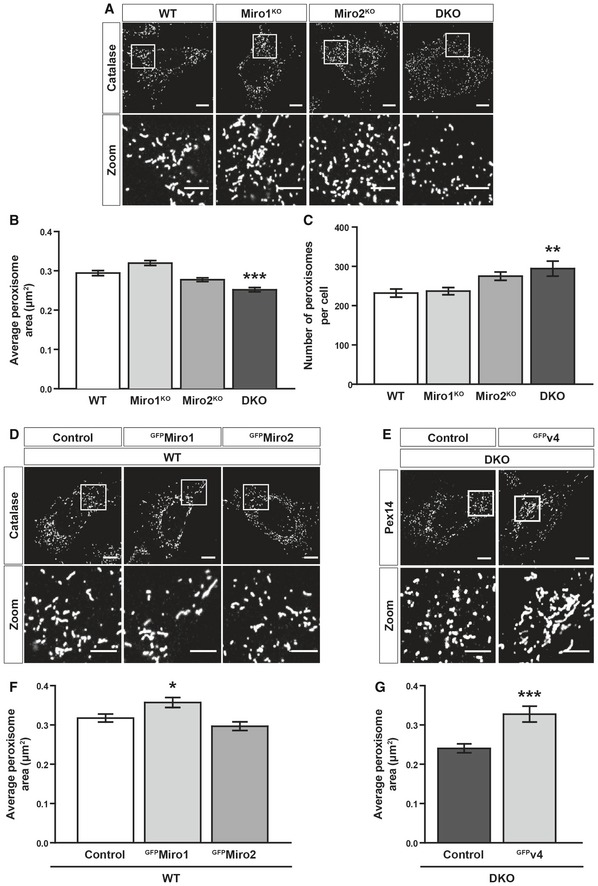
Representative images of catalase staining (peroxisomes) in WT, Miro1KO, Miro2KO and DKO MEFs.
Bar graph comparing average peroxisomal area of WT Miro1KO, Miro2KO and DKO MEFs (n = 60 cells per condition over three independent experiments).
Comparison of total peroxisomal number between WT, Miro1KO, Miro2KO and DKO MEFs. n = 60 cells per condition over three independent experiments.
Representative images of control (GFP‐tagged 1‐70 of Tom70), GFPMiro1 and GFPMiro2 in WT MEFs stained with catalase (peroxisomes).
Representative images of Pex14 (peroxisomes) in DKO MEFs expressing either GFP (control) or GFP‐tagged variant 4 of Miro1 (GFPv4).
Bar graph comparing average peroxisomal area of control, GFPMiro1 and GFPMiro2 overexpressing WT MEFs (n = 60 cells per condition over three independent experiments).
Comparison of average area of individual peroxisomes between DKO MEFs expressing either GFP (control) or GFP‐tagged variant 4 of Miro1 (GFPv4) (n = 30 cells per condition over three independent experiments).
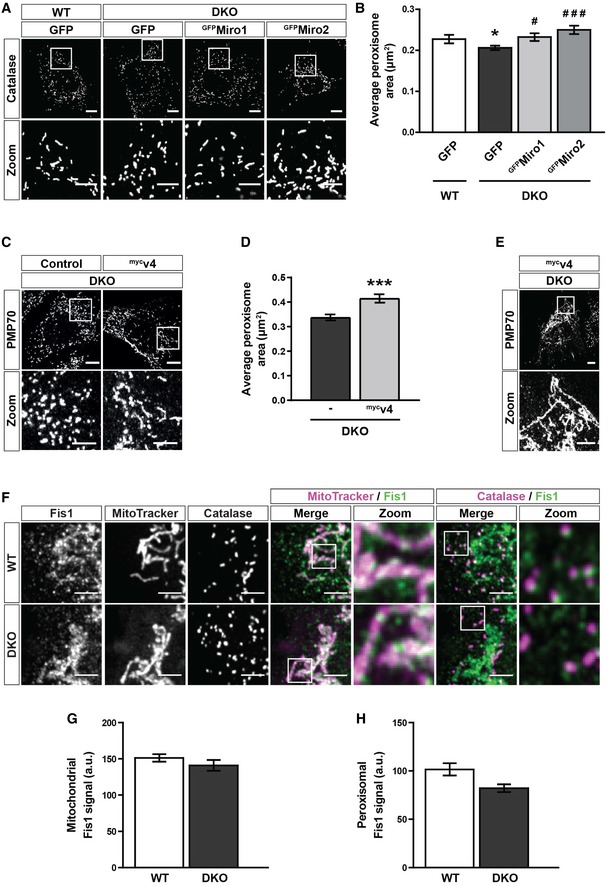
Representative images of catalase signal (peroxisomes) in WT MEFs and DKO MEFs either untransfected or expressing GFP‐tagged human Miro1 or Miro2 (GFPMiro1 and GFPMiro2, respectively).
Quantification of the average size of individual peroxisomes between WT, DKO, DKO‐expressing GFPMiro1 and DKO‐expressing GFPMiro2 (n = 36 cells per condition over three independent experiments).
Representative images and zooms of peroxisomes (PMP70) of DKO MEFs and DKO MEFs transfected with mycv4.
Quantification of the average size of individual peroxisomes in DKO MEFs compared to DKO MEFs transfected with mycv4 (n = 30 cells per condition over three independent experiments).
Representative image and zoom of the long‐reticulated peroxisomal morphology observed in 20% of mycv4‐expressing DKO cells.
Zooms of endogenous Fis1, mitochondria (MitoTracker) and peroxisomes (PMP70) in WT and DKO MEFs.
Integrated density of Fis1 signal on MitoTracker‐positive and PMP70‐negative structures in WT and DKO MEFs (n = 42 cells per condition over three independent experiments).
Integrated density of Fis1 signal on PMP70‐positive and MitoTracker‐negative structures in WT and DKO MEFs (n = 42 cells per condition over three independent experiments).
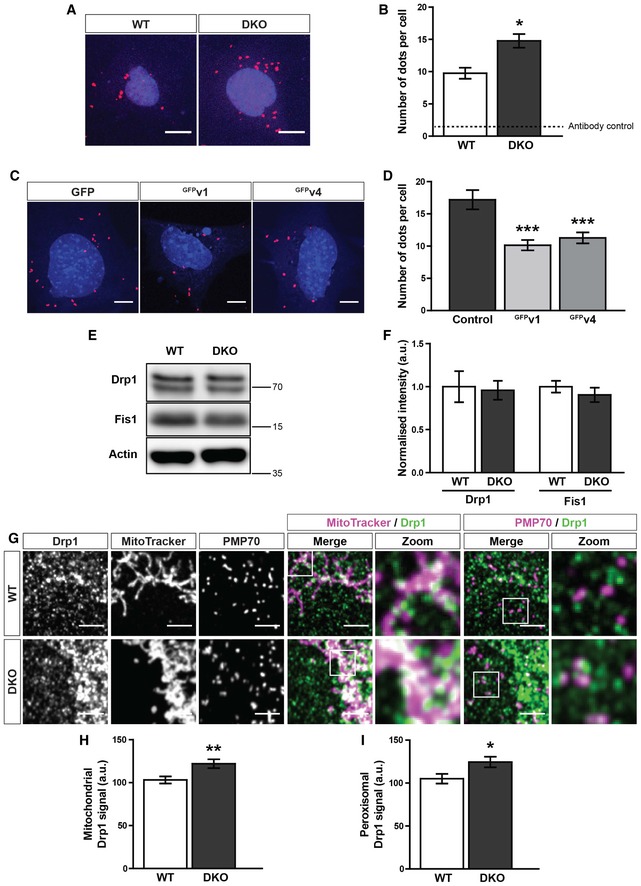
Representative images of proximity ligation assay (PLA) of Fis1 and Drp1 in WT and DKO MEFs. Scale bar is 10 μm. Red dots indicate interaction of Fis1 and Drp1. Blue is DAPI.
Quantification of fluorescent dots from PLA of Fis1 and Drp1 in WT and DKO MEFs. Dotted line indicates the sum of the Fis1 and Drp1 single antibody controls (n = 3 experiments).
Representative images of a Fis1‐Drp1 PLA in DKO MEFs expressing either GFP, GFPv1 (GFP‐tagged variant 1 of Miro1) or GFPv4 (GFP‐tagged variant 4 of Miro1) (n = 30 cells per condition over three independent experiments). Scale bar is 10 μm. Red dots indicate interaction of Fis1 and Drp1. Blue is DAPI.
Quantification of PLA fluorescent dots per cells between GFP, GFPv1 or GFPv4 transfected DKO MEFs (n = 30 cells over three independent experiments).
Western blot of Drp1, Fis1 and actin from WT and DKO whole cell lysates.
Quantification of normalised band intensity of Drp1 and Fis1 in WT and DKO MEFs (n = 3).
Zooms of endogenous Drp1, mitochondria (MitoTracker) and peroxisomes (PMP70) in WT and DKO MEFs. Scale bar is 5 μm.
Integrated density of Drp1 signal on MitoTracker‐positive and PMP70‐negative structures in WT and DKO MEFs.
Integrated density of Drp1 signal on PMP70‐positive and MitoTracker‐negative structures in WT and DKO MEFs.
Comment in
-
PCAF, ISX, and BRD4: a maleficent alliance serving lung cancer malignancy.EMBO Rep. 2020 Feb 5;21(2):e49766. doi: 10.15252/embr.201949766. Epub 2020 Jan 7. EMBO Rep. 2020. PMID: 31908099 Free PMC article.
References
-
- Sugiura A, Mattie S, Prudent J, McBride HM (2017) Newly born peroxisomes are a hybrid of mitochondrial and ER‐derived pre‐peroxisomes. Nature 542: 251–254 - PubMed
Publication types
MeSH terms
Substances
Grants and funding
- 1368635/UK Research and Innovation|Medical Research Council (MRC)/International
- 282430/EC|H2020|H2020 Priority Excellent Science|H2020 European Research Council (ERC)/International
- 1368635/MRC_/Medical Research Council/United Kingdom
- 2180679/MRC_/Medical Research Council/United Kingdom
- 1477260/MRC_/Medical Research Council/United Kingdom
LinkOut - more resources
Full Text Sources
Molecular Biology Databases
Research Materials
Miscellaneous
