. 2020 Mar 19;31(7):709-723.
doi: 10.1091/mbc.E19-10-0559. Epub 2020 Jan 2.

Imaging FCS delineates subtle heterogeneity in plasma membranes of resting mast cells

Affiliations

Imaging FCS delineates subtle heterogeneity in plasma membranes of resting mast cells

Nirmalya Bag et al. Mol Biol Cell. .

Abstract

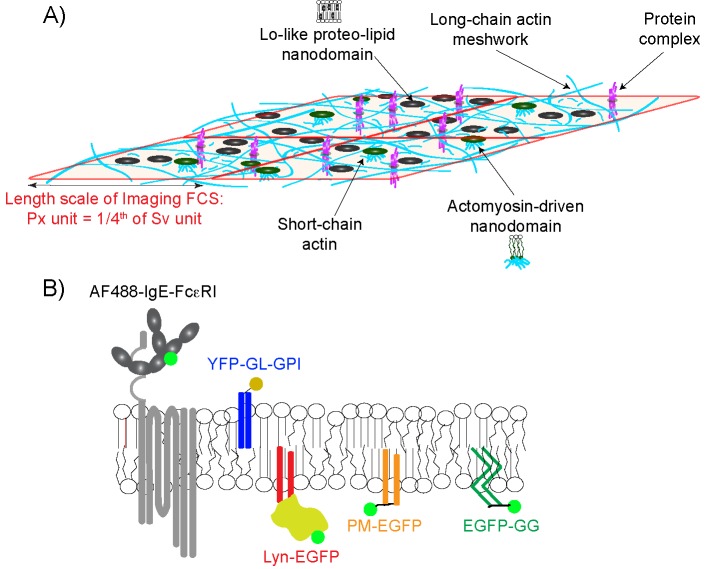
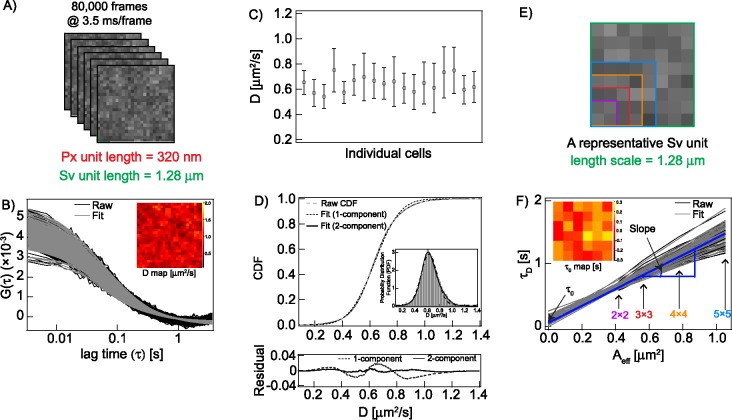
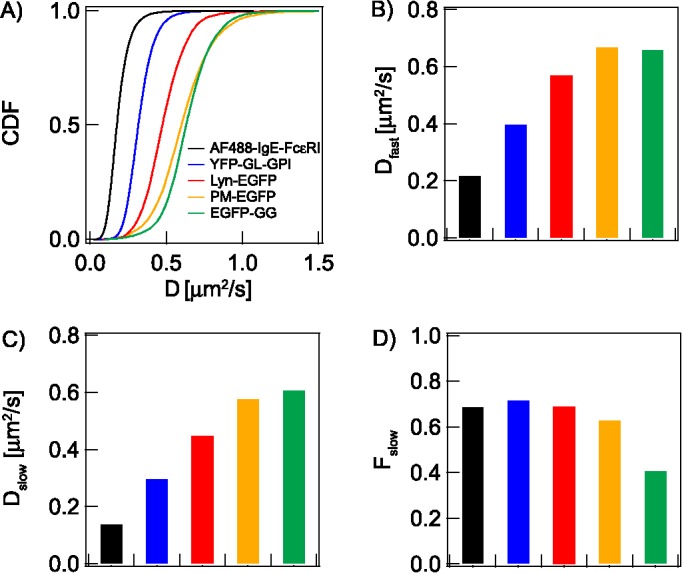
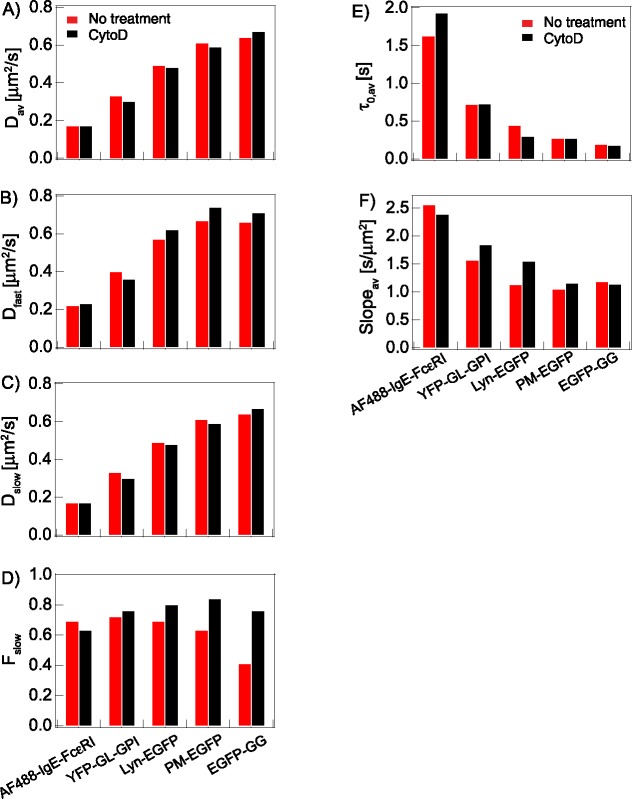
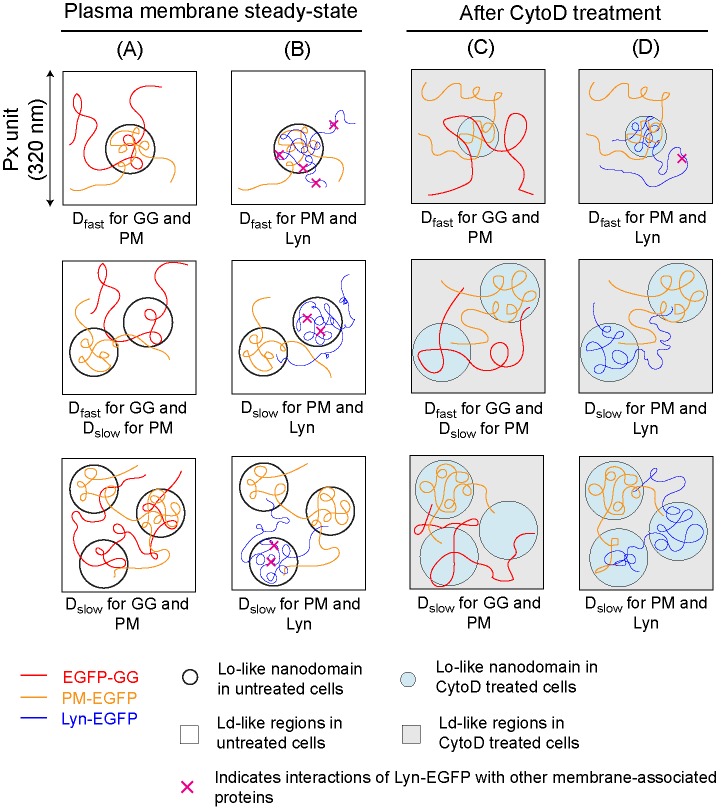
A myriad of transient, nanoscopic lipid- and protein-based interactions confer a steady-state organization of the plasma membrane in resting cells that is poised to orchestrate assembly of key signaling components upon reception of an extracellular stimulus. Although difficult to observe directly in live cells, these subtle interactions can be discerned by their impact on the diffusion of membrane constituents. Here, we quantified the diffusion properties of a panel of structurally distinct lipid, lipid-anchored, and transmembrane (TM) probes in RBL mast cells by imaging fluorescence correlation spectroscopy (ImFCS). We developed a statistical analysis of data combined from many pixels over multiple cells to characterize differences in diffusion coefficients as small as 10%, which reflect differences in underlying interactions. We found that the distinctive diffusion properties of lipid probes can be explained by their dynamic partitioning into Lo-like proteolipid nanodomains, which encompass a major fraction of the membrane and whose physical properties are influenced by actin polymerization. Effects on diffusion of functional protein modules in both lipid--anchored and TM probes reflect additional complexity in steady state membrane organization. The contrast we observe between different probes diffusing through the same membrane milieu represents the dynamic resting steady state, which serves as a baseline for monitoring plasma membrane remodeling that occurs upon stimulation.


Figures

FIGURE 1:
FIGURE 1:
A composite of plasma membrane organization may be determined by monitoring the diffusion of structurally distinct probes. (A) The plasma membrane is organized at different length scales in a hierarchical scheme: a relatively static actin meshwork (cyan long chains); dynamic Lo-like proteolipid nanodomains (black circles) with variable physical properties within and across leaflets; transmembrane ordered lipids mediated by dynamic, myosin-driven assembly of short actin chains (green circles connected to short cyan chains); and stable or dynamic protein complexes. We note that Lo-like proteolipid nanodomains and protein complexes are much smaller than the dimensions of the actin meshwork and are not drawn to scale here. Interaction of a probe with these organizational features retards its diffusion, depending on that probe’s physicochemical properties. ImFCS measures diffusion coefficients (D) at the resolution of a Px unit (320 × 320 nm2), which has dimensions considerably larger than the actin meshwork; parameters τ0 and 1/Deff = Slope are measured in Sv units that comprise a square of 16 Px units. These measurements are illustrated in Figure 2. (B) Fluorescent lipid, lipid-anchored, and transmembrane (TM) probes are evaluated by ImFCS. AF488-IgE-FcεRI: transmembrane with seven TM regions; YFP-GL-GPI: outer-leaflet lipid probe with saturated acyl chain anchor and an extracellular consensus glycosylation site; Lyn-EGFP: inner leaflet probe with saturated acyl chain anchors and additional cytosolic protein modules; PM-EGFP: inner leaflet lipid probe with same saturated acyl chain anchors of Lyn-EGFP; EGFP-GG: inner leaflet lipid probe with unsaturated acyl chain anchors and membrane-proximal basic sequence. Previous studies showed that lipid probes YFP-GL-GPI, PM-EGFP dynamically partition into Lo-like proteolipid nanodomains, whereas EGFP-GG partitions less favorably into these nanodomains, preferring Ld-like regions.
FIGURE 2:
FIGURE 2:
Very large data sets from ImFCS measurements are analyzed to examine spatially heterogeneous diffusion properties of plasma membrane probes, as exemplified by EGFP-GG. (A) A typical ImFCS measurement records image stack of 80,000 frames (3.5 ms/frame) from a region of interest (ROI) on the ventral plasma membrane. Representative first few images of 2 × 2 binned pixels (Px units) are shown. Representative Px unit (red box: 320 × 320 nm2) and Sv unit (green box: 1.28 × 1.28 μm2) in the image stack are shown. (B) Raw autocorrelation functions (ACFs; black) and respective fits (gray) for each Px unit using a single-component Brownian diffusion model (Eq. 1). Inset: spatial map of extracted diffusion coefficient (D) values at each Px unit of the image stack represented in A. (C) D values averaged over ROIs in 18 individual RBL cells expressing EGFP-GG; error bars are standard deviations about an average D for each cell. ROIs generally contain 400–625 Px units covering about 41–64 μm2 membrane area for each cell, yielding 10,527 total D values for 18 cells in this example. (D) Top: 10,527 D values obtained from ROIs in all cells are pooled and plotted as a normalized cumulative distribution function (CDF), which is fitted with one (Eq. 2) or two (Eq. 3) components, as indicated. The inset shows the same data for D plotted as a probability distribution function (PDF) with arbitrary binning of parameter values. Bottom: residual plots for one-component and two-component fits to CDF. (E) svFCS analysis is carried out on each Sv unit of the same raw data as depicted in A. A representative Sv unit is outlined in green, and four different sizes of observation area (Aeff) are created by pixel binning within the Sv unit (pink, red, orange, and blue boxes). (F) Linear svFCS plots (diffusion time [τD] vs. observation area [Aeff]; Eq. 5) are generated from all possible nonoverlapping Sv units (represented in A), yielding values for y-intercept (τ0) and Slope (1/Deff). Inset: spatial map of τ0 values determined from each Sv unit of an ROI represented in A.
FIGURE 3:
FIGURE 3:
Diffusion parameters are determined from the statistical analyses of D CDF for lipid, lipid-anchored, and TM probes depicted in Figure 1B. (A) CDF of D values for indicated probes. Fitting of the respective CDFs yields: (B) Dfast: average diffusion coefficient of probes in Px unit population with less dynamic confinement (nanodomain-poor for lipid probes); (C) Dslow: average diffusion coefficient of probes in Px unit population with more dynamic confinement (nanodomain-rich for lipid probes); (D) Fslow: fraction of Px units exhibiting Dslow. Probes EGFP-GG, PM-EGFP, Lyn-EGFP, and YFP-GL-GPI are primarily subject to lipid-based interactions, whereas AF488-IgE-FcεRI (and other TM probes) depends on protein-based interactions. The color code in A identifies the probes in all panels. Numerical values of all parameters with defined errors are provided in Table 1. Because of very large data sets and robust statistics, all pairwise comparisons within each panel are significantly different (though the differences may be small): In B, PM-EGFP and EGFP-GG are different with p < 0.05, as determined by unpaired Student’s t test; all other comparisons within B and other panels A–D are different with p < 0.0001 (see Materials and Methods).
FIGURE 4:
FIGURE 4:
Inhibition of actin polymerization modulates plasma membrane organization and affects probe diffusion properties, as shown without (red) and with (black) CytoD (1 μM) treatment for probes depicted in Figure 1B: (A) Dav; (B) Dfast; (C) Dslow; (D) Fslow; (E) τ0,av; (F) Slopeav. D CDFs yielding values for B–D are shown in Supplemental Figure S4. Numerical values of all parameters with defined errors are provided in Table 1.
FIGURE 5:
FIGURE 5:
Diffusion of inner leaflet probes EGFP-GG, PM-EGFP, and Lyn-EGFP depends on lipid-based interactions inside and outside of Lo-like proteolipid nanodomains and is modulated by inhibition of actin polymerization. Representative Px units with low (top), moderate (middle), or high (bottom) levels of coverage by nanodomains (circles) are shown. EGFP-GG partitions less favorably into Lo-like environments so that this probe’s diffusion is less affected by the presence of the nanodomains and its Dfast corresponds to Px units with both low and moderate coverage; only Px with high levels of coverage manifest as Dslow for this probe. Dfast for PM-EGFP and Lyn-EGFP corresponds to Px units with low coverage by nanodomains, whereas Dslow for these probes corresponds to Px units with moderate and high levels of coverage. Diffusion of Lyn-EGFP is further retarded by interactions of its protein modules with other proteins in and out of nanodomains (indicated by × [pink]). Contrasting behavior of these probes is illustrated by their respective diffusion trajectories. PM-EGFP is compared with EGFP-GG (A) and to Lyn-EGFP (B) in resting steady state plasma membrane of RBL cells. Retardation of diffusion due to dynamic partitioning into nanodomains: Lyn-EGFP > PM-EGFP > EGFP-GG, as reflected by respective D CDFs and extracted D values (Figure 3), as well as relative τ0,av values determined for these probes (Table 1). (C, D) When resting cells are treated with 1 μM CytoD, the nanodomains become more ordered and probe interactions with membrane components change into and out of nanodomains, as reflected by their diffusion properties (Figure 4). Compared with untreated cells, EGFP-GG partitions less favorably into nanodomains, whereas PM-EGFP partitions more favorably, C. As reflected by τ0,av values, Lyn-EGFP loses interactions with proteins within nanodomains (absence of × inside nanodomains), behaving more like PM-EGFP in these regions, but gains interactions with proteins outside these regions (as reflected by Slopeav values), D. Differences in diffusion properties caused by CytoD treatment are also reflected in D CDFs (Supplemental Figure S4) and extracted D values (Table 1).

References

    1. Akinlaja J, Sachs F. (1998). The breakdown of cell membranes by electrical and mechanical stress. Biophys J , 247–254. - PMC - PubMed
    1. Albrecht D, Winterflood CM, Ewers H. (2015). Dual color single particle tracking via nanobodies. Methods Appl Fluoresc , 024001. - PubMed
    1. Anderson RG, Jacobson K. (2002). A role for lipid shells in targeting proteins to caveolae, rafts, and other lipid domains. Science , 1821–1825. - PubMed
    1. Andrade DM, Clausen MP, Keller J, Mueller V, Wu C, Bear JE, Hell SW, Lagerholm BC, Eggeling C. (2015). Cortical actin networks induce spatio-temporal confinement of phospholipids in the plasma membrane—a minimally invasive investigation by STED-FCS. Sci Rep , 11454. - PMC - PubMed
    1. Bag N, Huang S, Wohland T. (2015). Plasma membrane organization of epidermal growth factor receptor in resting and ligand-bound states. Biophys J , 1925–1936. - PMC - PubMed

Publication types

LinkOut - more resources