. 2020 Apr 1;130(4):1843-1849.
doi: 10.1172/JCI133344.

Enasidenib drives human erythroid differentiation independently of isocitrate dehydrogenase 2

Affiliations

Enasidenib drives human erythroid differentiation independently of isocitrate dehydrogenase 2

Ritika Dutta et al. J Clin Invest. .

Abstract

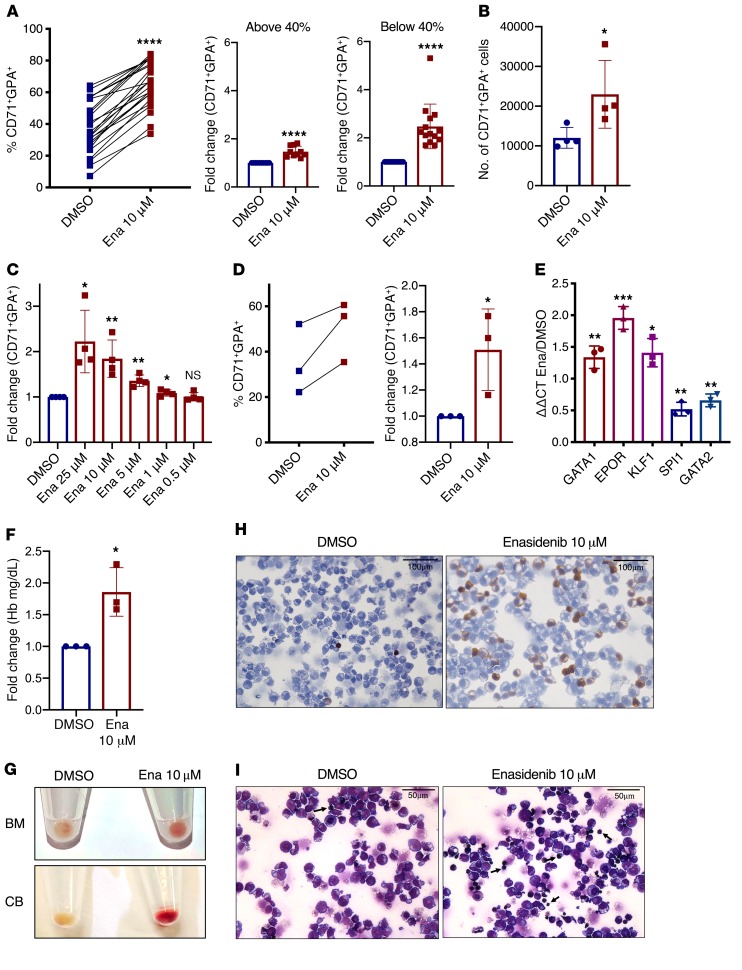
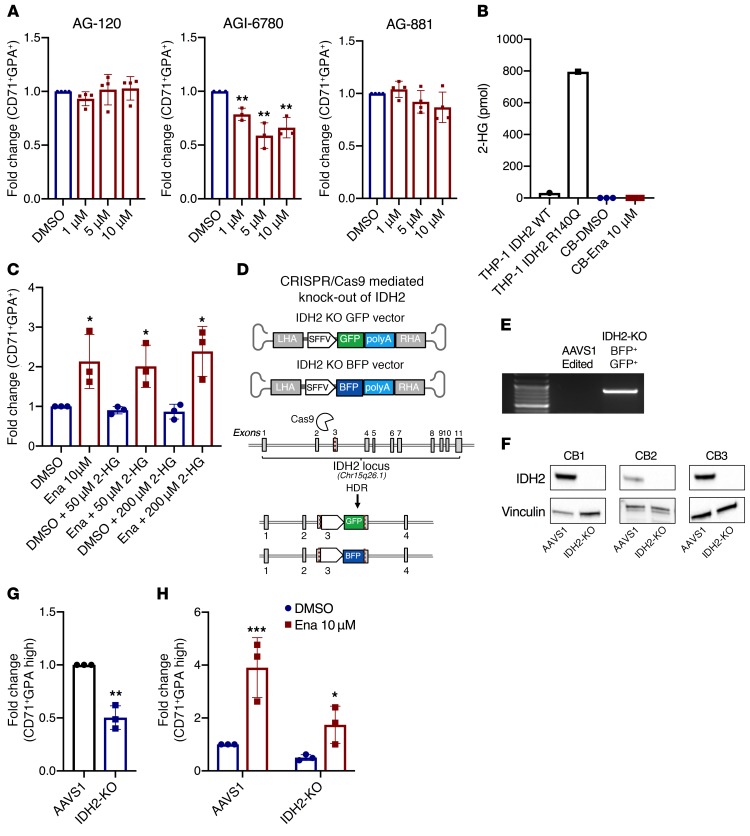
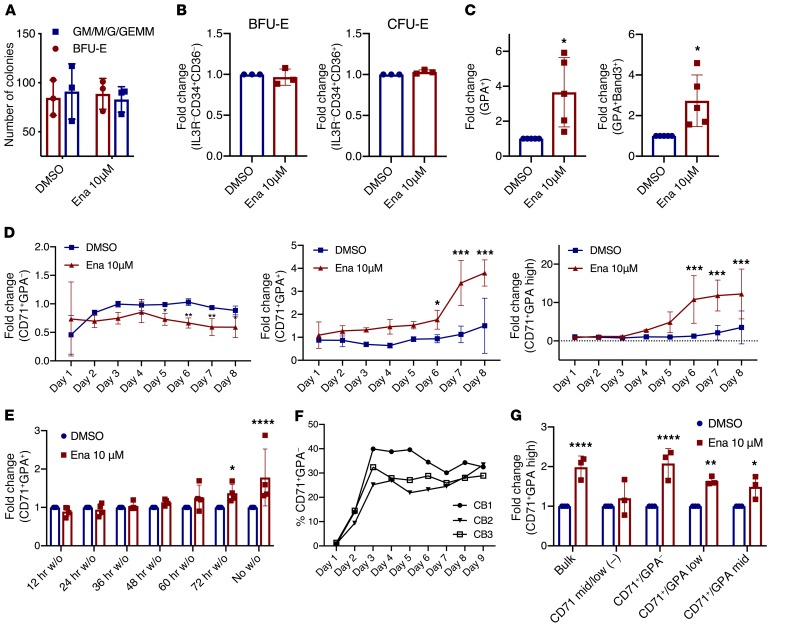
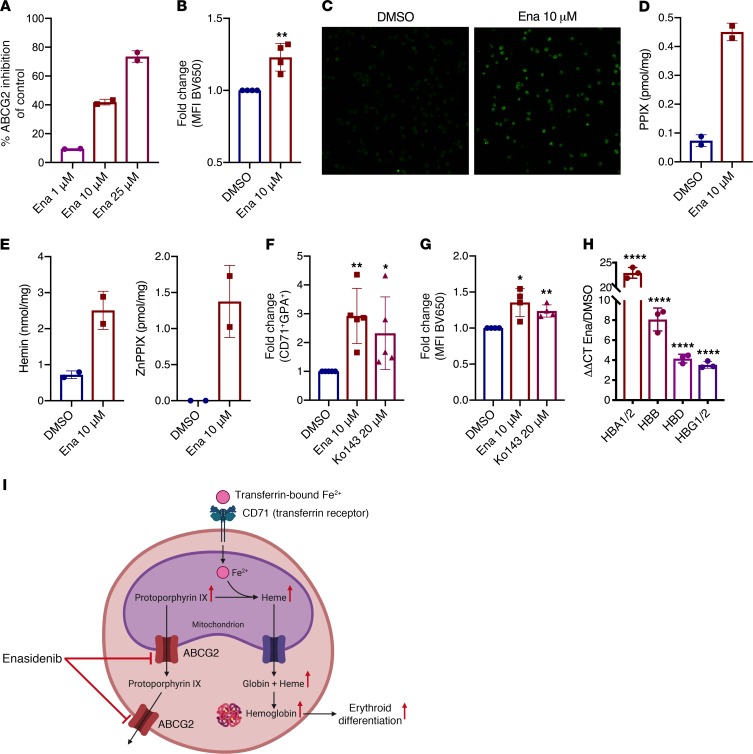
Cancer-related anemia is present in more than 60% of newly diagnosed cancer patients and is associated with substantial morbidity and high medical costs. Drugs that enhance erythropoiesis are urgently required to decrease transfusion rates and improve quality of life. Clinical studies have observed an unexpected improvement in hemoglobin and RBC transfusion-independence in patients with acute myeloid leukemia (AML) treated with the isocitrate dehydrogenase 2 (IDH2) mutant-specific inhibitor enasidenib, leading to improved quality of life without a reduction in AML disease burden. Here, we demonstrate that enasidenib enhanced human erythroid differentiation of hematopoietic progenitors. The phenomenon was not observed with other IDH1/2 inhibitors and occurred in IDH2-deficient CRISPR-engineered progenitors independently of D-2-hydroxyglutarate. The effect of enasidenib on hematopoietic progenitors was mediated by protoporphyrin accumulation, driving heme production and erythroid differentiation in committed CD71+ progenitors rather than hematopoietic stem cells. Our results position enasidenib as a promising therapeutic agent for improvement of anemia and provide the basis for a clinical trial using enasidenib to decrease transfusion dependence in a wide array of clinical contexts.

Keywords: Bone marrow differentiation; Hematology; Leukemias; Stem cells.


Conflict of interest statement

Conflict of interest: RM is a founder, equity holder, and board member of Forty Seven Inc.

Figures

Figure 1
Figure 1. Enasidenib augments erythroid differentiation.
(A) Proportion of CD71+GPA+ (%CD71+GPA+) cells after 8 days culture of CB-CD34+ cells in EDC with DMSO or 10 μM enasidenib (Ena) (left; n = 24 independent CB specimens). Fold change (FC) of percentage of CD71+GPA+ cells (DMSO = 1) cells with baseline differentiation capacity (%CD71+GPA+) of less than 40% (right; n = 14) or greater than 40% (middle; n = 10). (B) Number of CB-derived CD71+GPA+ cells at day 8 of EDC (n = 4). (C) Dose response of enasidenib, represented as FC of percentage of CD71+GPA+ cells (DMSO = 1) at day 8 of EDC (n = 4). (D) Proportion of CD71+GPA+ cells at day 8 of EDC of CD34+ cells from normal bone marrow (BM) (left; n = 3). FC of percentage of CD71+GPA+ cells (DMSO = 1) (right; n = 3). (E) qPCR detection of relative RNA expression of erythroid and myeloid transcription factors with enasidenib treatment compared with DMSO of CB-CD34+ cells at day 8 of EDC (DMSO = 1) (n = 3). (F) FC of hemoglobin in a colorimetric assay after 14 days in EDC (DMSO=1) (n = 3). (G) Representative cell pellets from normal BM (top panel) and CB (bottom panel) after 14 days in EDC (n = 3). (H) Representative image at day 8 of CB-CD34+ cells in EDC treated with DMSO or 10 μM enasidenib (n = 3) and stained with benzidine. (I) Representative image at day 8 of CB-CD34+ cells in EDC treated with DMSO or 10 μM enasidenib (n = 3) and stained with Wright-Giemsa. Arrows indicate maturing erythrocytes. Graphs represent mean ± SD. Statistical significance was calculated using unpaired 2-tailed t tests. *P < 0.05, **P < 0.01, ***P < 0.001, ****P < 0.0001.
Figure 2
Figure 2. Enasidenib increases erythroid differentiation independently of IDH2.
(A) FC of percentage of CD71+GPA+ (DMSO = 1) in CB-CD34+-derived cells on day 8 of EDC with AG-120 (n = 4), AGI-6780 (n = 3), and AG-881 (n = 4). (B) D-2-HG measurement in the parental THP-1 cell line, an inducible IDH2 R140Q mutant THP-1 cell line, and CB-CD34+-derived cells treated with DMSO or enasidenib for 8 days in EDC (n = 3). (C) FC of percentage of CD71+GPA+ (DMSO only = 1) in CB-CD34+-derived cells on day 8 of EDC with the addition of (2R)-octyl-alpha-2HG at the indicated concentrations (n = 3). (D) Schematic of CRISPR-Cas9 knockout strategy, with disruption of IDH2 in exon 3 and integration of AAV donors with BFP or GFP reporters. RHA/LHA – right/left homology arm (E) PCR with a reverse primer in the AAV donor (SFFV) and forward primer in the genome (IDH2) to confirm site-specific integration of the AAV donor. AAVS1-edited cells (safe harbor locus) were used as control. (F) Western blot showing knockout of IDH2 in 3 independent CB samples, with vinculin as the loading control. (G) FC of percentage of CD71+GPA-high IDH2-KO cells at day 8 of EDC compared with AAVS1 control (AAVS1 = 1) (n = 3). (H) FC of percentage of CD71+GPA-high in AAVS1 and IDH2-KO cells treated with DMSO or enasidenib (AAVS1 DMSO = 1, with statistical comparisons made to each respective DMSO condition) (n = 3). Cells were gated on live, singlet, BFP+GFP+ before gating on CD71/GPA. Graphs represent mean ± SD. Statistical significance was calculated using unpaired 2-tailed t tests. *P < 0.05, **P < 0.01, ***P < 0.001.
Figure 3
Figure 3. Enasidenib acts on mature CD71+ erythroid progenitors to increase differentiation.
(A) Methylcellulose colony forming assay of CB-CD34+ cells indicating the number of erythroid colonies (BFU-E) and myeloid colonies (GM/M/GEMM) observed with DMSO or enasidenib treatment after 14 days (n = 3). (B) FC of percentage of BFU-E (IL3RCD34+CD36) (middle) and percentage of CFU-E (IL3RCD34CD36+) (right) at day 4 of EDC (DMSO = 1) (n = 3). (C) FC of percentage of GPA+ (left) and percentage of GPA+Band3+ (right) at day 8 of EDC (DMSO = 1) (n = 3). (D) Time course of erythroid differentiation: FC of percentage of CD71+GPA (left), percentage of CD71+GPA+ (middle), and percentage of CD71+GPA-high (right) relative to untreated cells (not shown) (n = 3). (E) FC of percentage of CD71+GPA+ measured at day 8 of EDC, with DMSO or enasidenib washed out (w/o) of the culture at the indicated time points (DMSO = 1) (n = 4). (F) Timeline of the gain of CD71 expression (%CD71+GPA) in 3 untreated CB samples. (G) Cells were sorted into CD71 mid/low, CD71+GPA, CD71+GPA-low, and CD71+GPA-mid after 6 days of EDC, and then treated with DMSO or enasidenib for 4 days. FC of percentage of CD71+GPA-high (DMSO for each population = 1) (n = 3). Graphs represent mean ± SD. Statistical significance was calculated using unpaired 2-tailed t tests. *P < 0.05, **P < 0.01, ***P < 0.001, ****P <0.0001.
Figure 4
Figure 4. Enasidenib modulates heme biosynthesis through accumulation of PPIX.
(A) Enasidenib-mediated inhibition of ABCG2-mediated Hoechst efflux in CHO cells, measured in duplicate, as percentage of inhibition relative to DMSO control. (B) FC of MFI measuring PPIX fluorescence by flow cytometry (BV650 channel) in CB-CD34+-derived cells at D8 of EDC (DMSO = 1) (n = 4). (C) Representative microscopy image of PPIX (HeNe 633 laser, original magnification ×20) in CB-CD34+-derived cells at day 8 of EDC (n = 3). (D) UPLC levels of PPIX after 8 days of enasidenib treatment. For D and E, each point represents 3 independent CB-CD34+ samples that were pooled together before metabolite measurement. (E) UPLC levels of hemin and ZnPPIX after 8 days of enasidenib treatment. (F) FC of percentage of CD71+GPA+ cells at day 8 of EDC after treatment with enasidenib or Ko143 (DMSO = 1) (n = 5). (G) FC of MFI measuring PPIX fluorescence by flow cytometry (BV650 channel) in CB-CD34+-derived cells at day 8 of EDC with enasidenib or Ko143 (DMSO = 1) (n = 4). (H) qPCR determination of relative RNA expression of hemoglobin genes in enasidenib-treated CB-CD34+-derived cells at day 8 of EDC (DMSO = 1) (n = 3). (I) Schematic of proposed model. Graphs represent mean ± SD. Statistical significance was calculated using unpaired 2-tailed t tests. *P < 0.05, **P < 0.01, ****P < 0.0001.

References

    1. [No authors listed]. SEER Cancer Stat Facts: Acute Myeloid Leukemia. National Cancer Institute. https://seer.cancer.gov/statfacts/html/amyl.html Accessed February 24, 2020.
    1. Shah A, Andersson TM, Rachet B, Björkholm M, Lambert PC. Survival and cure of acute myeloid leukaemia in England, 1971-2006: a population-based study. Br J Haematol. 2013;162(4):509–516. doi: 10.1111/bjh.12425. - DOI - PubMed
    1. Yen K, et al. AG-221, a first-in-class therapy targeting acute myeloid leukemia harboring oncogenic IDH2 mutations. Cancer Discov. 2017;7(5):478–493. doi: 10.1158/2159-8290.CD-16-1034. - DOI - PubMed
    1. Thomas D, Majeti R. Optimizing next-generation AML therapy: activity of mutant IDH2 inhibitor AG-221 in preclinical models. Cancer Discov. 2017;7(5):459–461. doi: 10.1158/2159-8290.CD-17-0270. - DOI - PMC - PubMed
    1. Stein EM, et al. Enasidenib in mutant IDH2 relapsed or refractory acute myeloid leukemia. Blood. 2017;130(6):722–731. doi: 10.1182/blood-2017-04-779405. - DOI - PMC - PubMed

Publication types

MeSH terms