. 2020:25:102094.
doi: 10.1016/j.nicl.2019.102094. Epub 2019 Nov 28.

Applying the D50 disease progression model to gray and white matter pathology in amyotrophic lateral sclerosis

Affiliations

Applying the D50 disease progression model to gray and white matter pathology in amyotrophic lateral sclerosis

Robert Steinbach et al. Neuroimage Clin. 2020.

Abstract

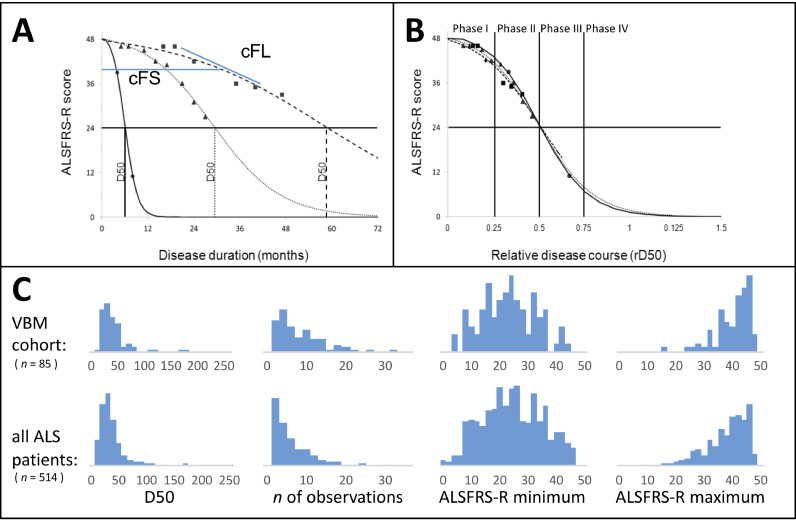
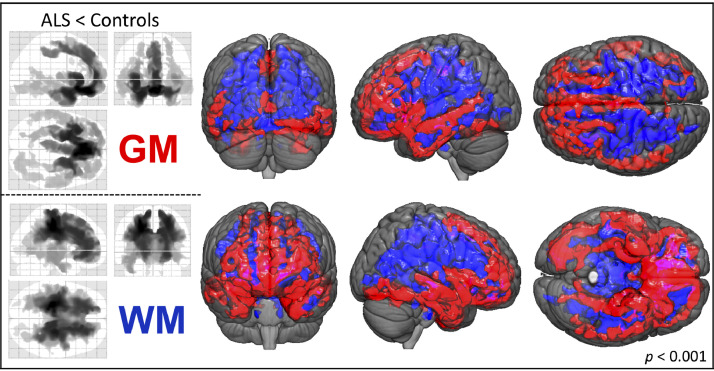
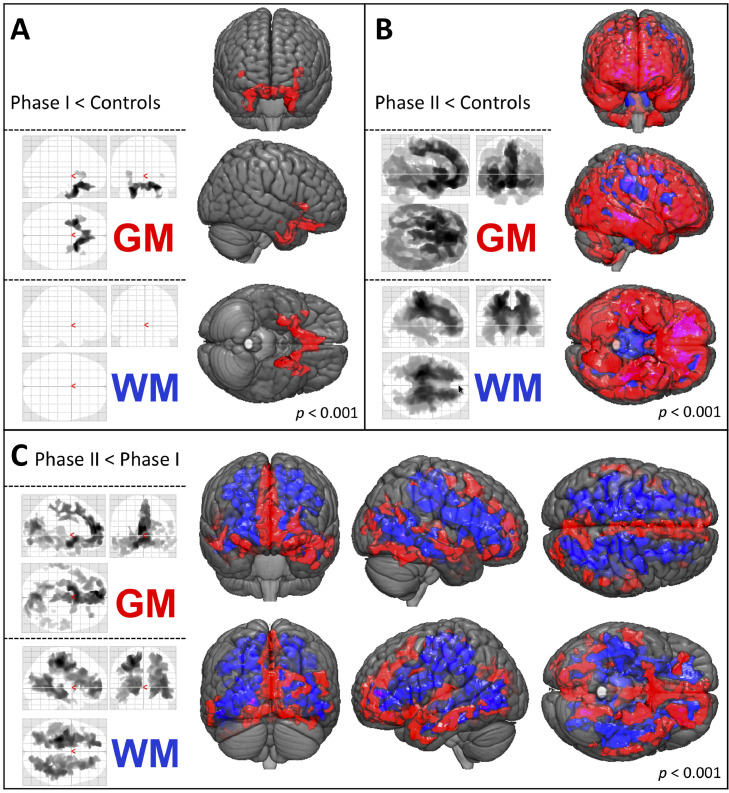
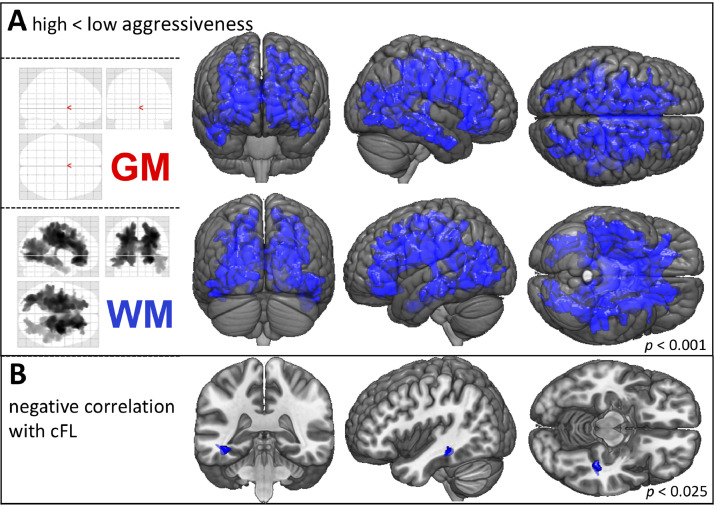
Therapeutic management and research in Amyotrophic Laterals Sclerosis (ALS) have been limited by the substantial heterogeneity in progression and anatomical spread that are endemic of the disease. Neuroimaging biomarkers represent powerful additions to the current monitoring repertoire but have yielded inconsistent associations with clinical scores like the ALS functional rating scale. The D50 disease progression model was developed to address limitations with clinical indices and the difficulty obtaining longitudinal data in ALS. It yields overall disease aggressiveness as time taken to reach halved functionality (D50); individual disease covered in distinct phases; and calculated functional state and calculated functional loss as acute descriptors of local disease activity. It greatly reduces the noise of the ALS functional rating scale and allows the comparison of highly heterogeneous disease and progression subtypes. In this study, we performed Voxel-Based Morphometry for 85 patients with ALS (60.1 ± 11.5 years, 36 female) and 62 healthy controls. Group-wise comparisons were performed separately for gray matter and white matter using ANCOVA testing with threshold-free cluster enhancement. ALS-related widespread gray and white matter density decreases were observed in the bilateral frontal and temporal lobes (p < 0.001, family-wise error corrected). We observed a progressive spread of structural alterations along the D50-derived phases, that were primarily located in frontal, temporal and occipital gray matter areas, as well as in supratentorial neuronal projections (p < 0.001 family-wise error corrected). ALS patients with higher overall disease aggressiveness (D50 < 30 months) showed a distinct pattern of supratentorial white matter density decreases relative to patients with lower aggressiveness; no significant differences were observed for gray matter density (p < 0.001 family-wise error corrected). The application of the D50 disease progression model separates measures of disease aggressiveness from disease accumulation. It revealed a strong correlation between disease phases and in-vivo measures of cerebral structural integrity. This study underscores the proposed corticofugal spread of cerebral pathology in ALS. We recommend application of the D50 model in studies linking clinical data with neuroimaging correlates.

Keywords: Amyotrophic lateral sclerosis; D50 model; Disease progression; Magnetic resonance imaging; Voxel-Based Morphometry.


Conflict of interest statement

Declaration of Competing Interest The authors have no conflicts of interest to declare.

Figures

Fig 1
Fig. 1
The D50 disease progression model: demonstration of principles and derived parameters. (A) Simulated disease curves of 3 ALS patients, with fast (circles), intermediate (triangles) and slow (squares) progression. Based on regularly obtained ALSFRS-R scores throughout the disease, the sigmoidal course is calculated. Resulting parameters: D50 = calculated time point when ALSFRS-R drops to 24, cFS = calculated functional state and cFL = calculated functional loss at the day of examination (for e.g. MRI acquisition). (B) Normalization with rD50, which describes individual disease course covered in reference to D50, allows for comparability between patients with vastly different disease aggressiveness and shows that patients proceed through similar Phases (I-IV) of functional decline. (C) Shows histograms of relevant variables for the current cohort of this study (top row) and all ALS patient data that is available in our center respectively. From left to right, the D50 values, number of obtained ALSFRS-R scores per patient, the minimum ALSFRS-R score and the maximum ALSFRS-R score obtained are noted; it illustrates, that the characteristics available for the VBM cohort well represent the regional ALS population. Abbreviations: ALSFRS-R: ALS Functional Rating Scale (Revised); D50: time until functionality drops to a half as estimated by the model; cFS: calculated functional state; cFL: calculated functional loss; MRI: Magnetic Resonance Imaging; rD50: relative D50.
Fig 2
Fig. 2
Between-group differences for patients and healthy controls. VBM between-group comparisons of patients (n = 85) and controls (n = 62) revealed GM density decreases (upper 3 glass-brain images, red-labeled in 3D-pictures) mainly outside the motor areas, i.e. within the bilateral frontal and temporal lobes. Observed WM density decreases in ALS patients (lower 3 glass-brain images, blue-labeled in 3D-pictures) encompassed major parts of the frontal structures and parietal projections underlying the motoric and somatosensoric cortices and extended throughout the brainstem. (TFCE; FWE corrected p < 0.001; nuisance co-variates: age, gender, total intracranial volume) Abbreviations: GM: Gray Matter; TFCE: Threshold-Free Cluster Enhancement; FWE: Family-Wise Error; VBM: Voxel-Based Morphometry; WM: White Matter.
Fig 3
Fig. 3
Comparisons across disease phases. VBM sub-group analyses of patients in disease Phases I (rD50 < 0.25, n = 34) and II (rD50 = 0.25–0.5, n = 48) at the time of MRI acquisition. (A) In Phase I GM density decreases were observed for inferior-frontal and temporal areas in contrast to healthy controls. (B) The Phase II patients showed an extended pattern of GM and WM atrophy as compared to healthy controls. (C) The direct comparison of both phases indicated that pathology spreads beyond the motor system, including frontal, temporal and occipital GM areas. The WM density decreases were even more extensive and emphasized in subparietal projections. (TFCE; FWE corrected p < 0.001; nuisance co-variates: age, gender, total intracranial volume, onset-type, D50) Abbreviations: GM: Gray Matter; MRI: Magnetic Resonance Imaging; TFCE: Threshold-Free Cluster Enhancement; FWE: Family-Wise Error; VBM: Voxel-Based Morphometry; WM; White Matter.
Fig 4
Fig. 4
WM density decreases are associated with increased disease aggressiveness. A) VBM subgroup analyses of patients with high aggressive (D50 < 30 months, n = 44) vs. low aggressive ALS (D50 >= 30 months, n = 41). High aggressiveness was associated with widespread WM volume-loss. The GM density was not influenced by disease aggressiveness. (TFCE; FWE corrected p < 0.001; nuisance co-variates: age, gender, total intracranial volume, onset-type, rD50). B) Voxel-wise regression revealed a negative correlation between WM density and cFL at the time of MRI acquisition, which was located in parts of the left inferior longitudinal and fronto-occipital fasciculus. (TFCE; FWE corrected p < 0.025; nuisance co-variate: total intracranial volume). Abbreviations: GM: Gray Matter; cFL: calculated functional loss; TFCE: Threshold-Free Cluster Enhancement; FWE: Family-Wise Error; MRI: Magnetic Resonance Imaging; VBM: Voxel-Based Morphometry; WM: White Matter.

Similar articles

Cited by

References

    1. Abdulla S., Machts J., Kaufmann J., Patrick K., Kollewe K., Dengler R., Heinze H.J., Petri S., Vielhaber S., Nestor P.J. Hippocampal degeneration in patients with amyotrophic lateral sclerosis. Neurobiol. Aging. 2014;35:2639–2645. - PubMed
    1. Abrahams S., Newton J., Niven E., Foley J., Bak T.H. Screening for cognition and behaviour changes in ALS. Amyotroph. Lateral Scler. Frontotemporal Degener. 2014;15:9–14. - PubMed
    1. Acosta-Cabronero J., Machts J., Schreiber S., Abdulla S., Kollewe K., Petri S., Spotorno N., Kaufmann J., Heinze H.J., Dengler R., Vielhaber S., Nestor P.J. Quantitative susceptibility MRI to detect brain iron in amyotrophic lateral sclerosis. Radiology. 2018;289:195–203. - PMC - PubMed
    1. Agosta F., Gorno-Tempini M.L., Pagani E., Sala S., Caputo D., Perini M., Bartolomei I., Fruguglietti M.E., Filippi M. Longitudinal assessment of grey matter contraction in amyotrophic lateral sclerosis: a tensor based morphometry study. Amyotroph. Lateral Scler. 2009;10:168–174. - PubMed
    1. Agosta F., Pagani E., Rocca M.A., Caputo D., Perini M., Salvi F., Prelle A., Filippi M. Voxel-based morphometry study of brain volumetry and diffusivity in amyotrophic lateral sclerosis patients with mild disability. Hum. Brain Mapp. 2007;28:1430–1438. - PMC - PubMed

Publication types