. 2020 Feb:30:101413.
doi: 10.1016/j.redox.2019.101413. Epub 2019 Dec 26.

AR ubiquitination induced by the curcumin analog suppresses growth of temozolomide-resistant glioblastoma through disrupting GPX4-Mediated redox homeostasis

Affiliations

AR ubiquitination induced by the curcumin analog suppresses growth of temozolomide-resistant glioblastoma through disrupting GPX4-Mediated redox homeostasis

Tzu-Chi Chen et al. Redox Biol. 2020 Feb.

Abstract

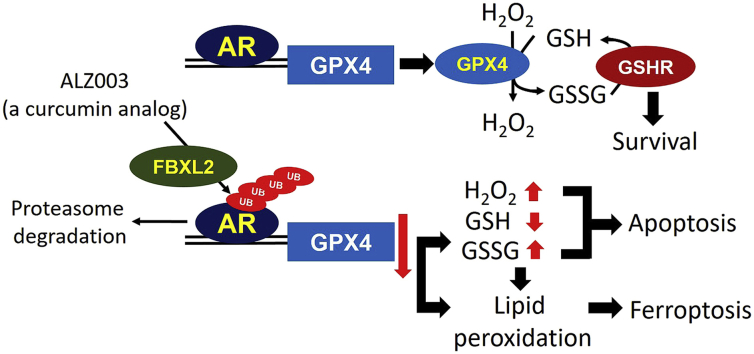
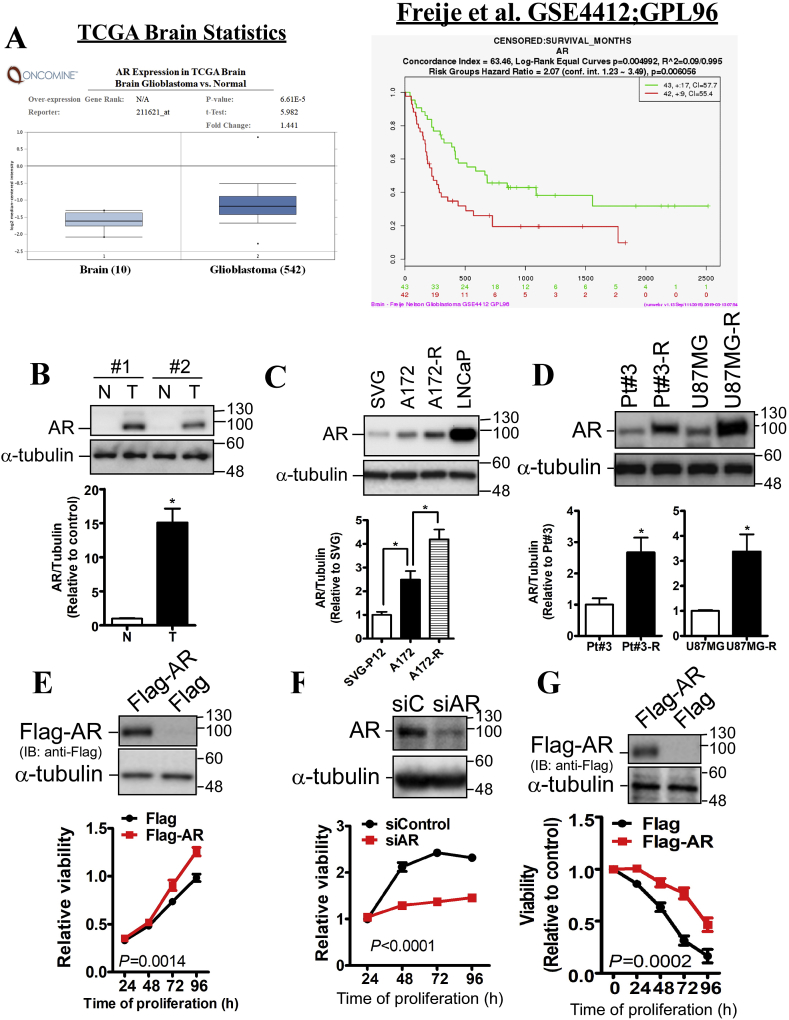
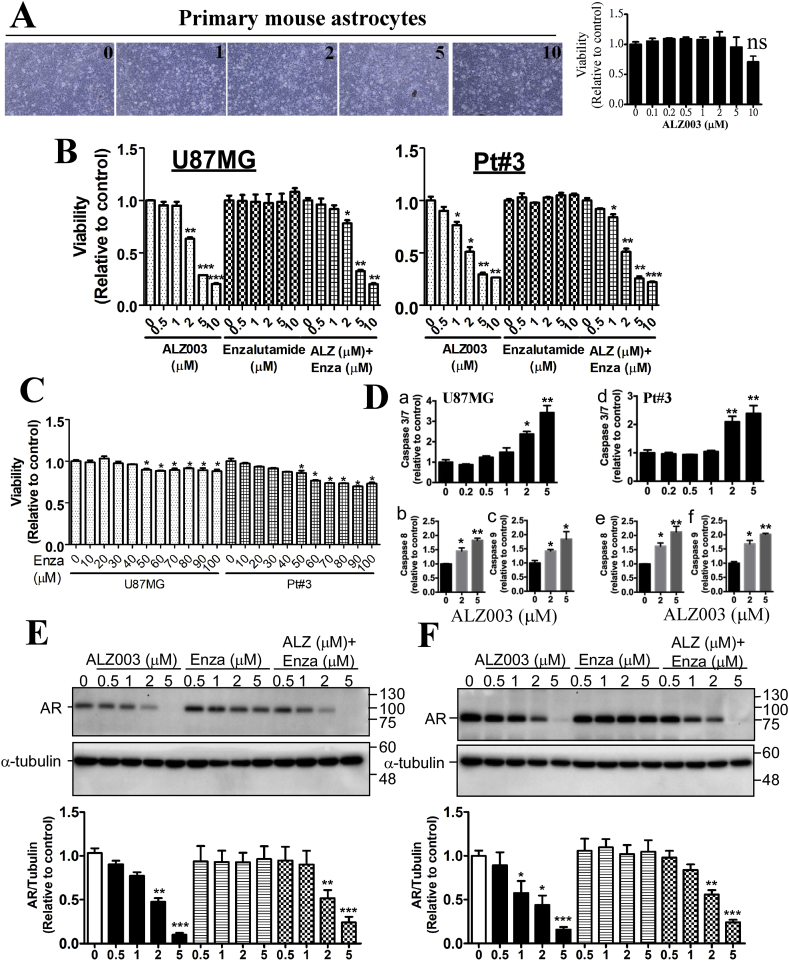
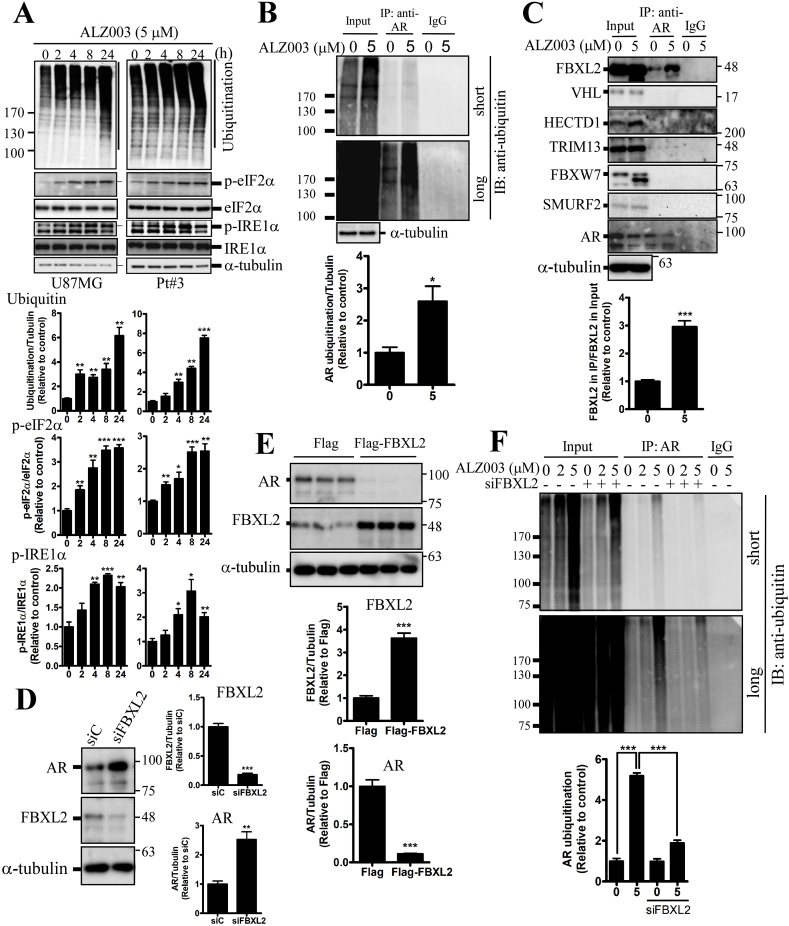
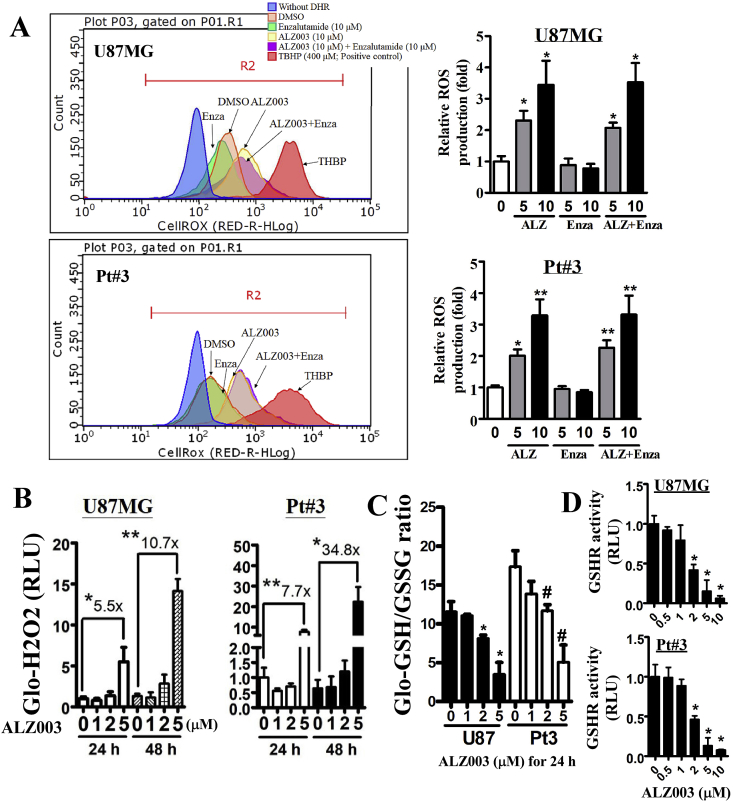
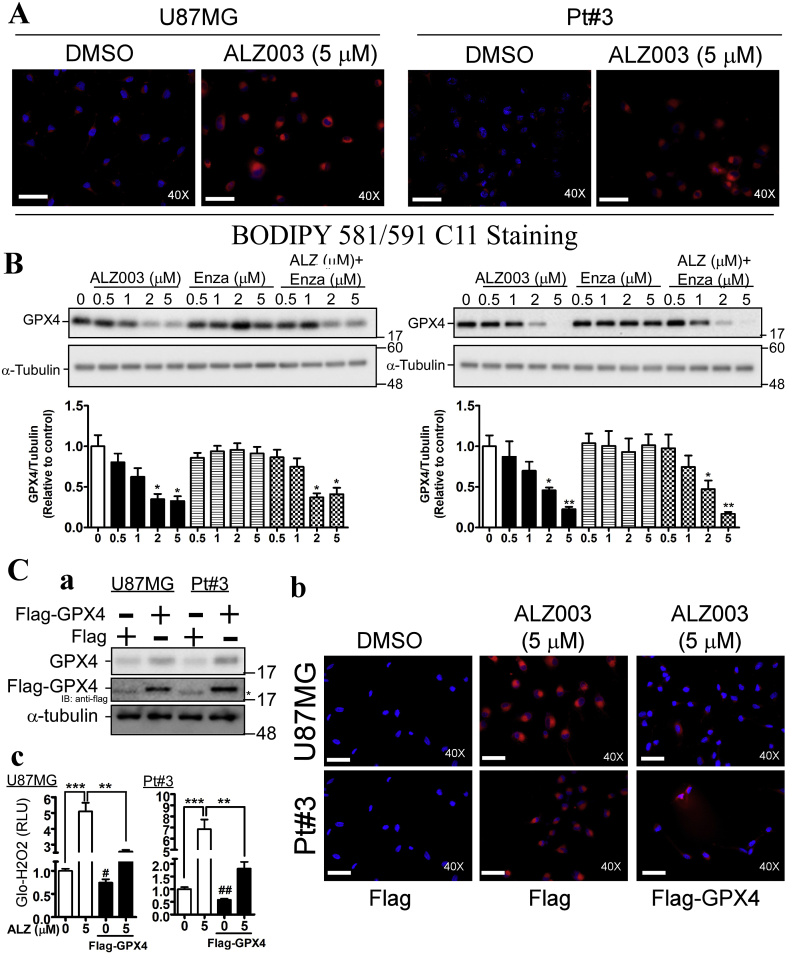
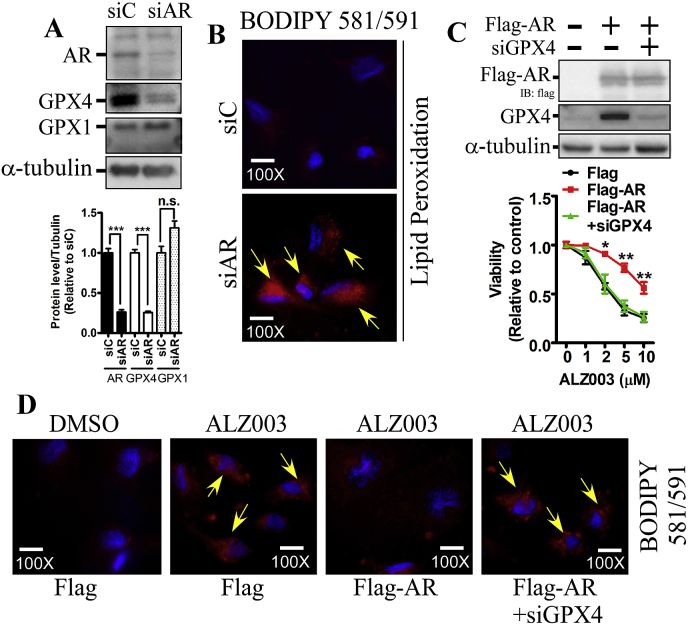
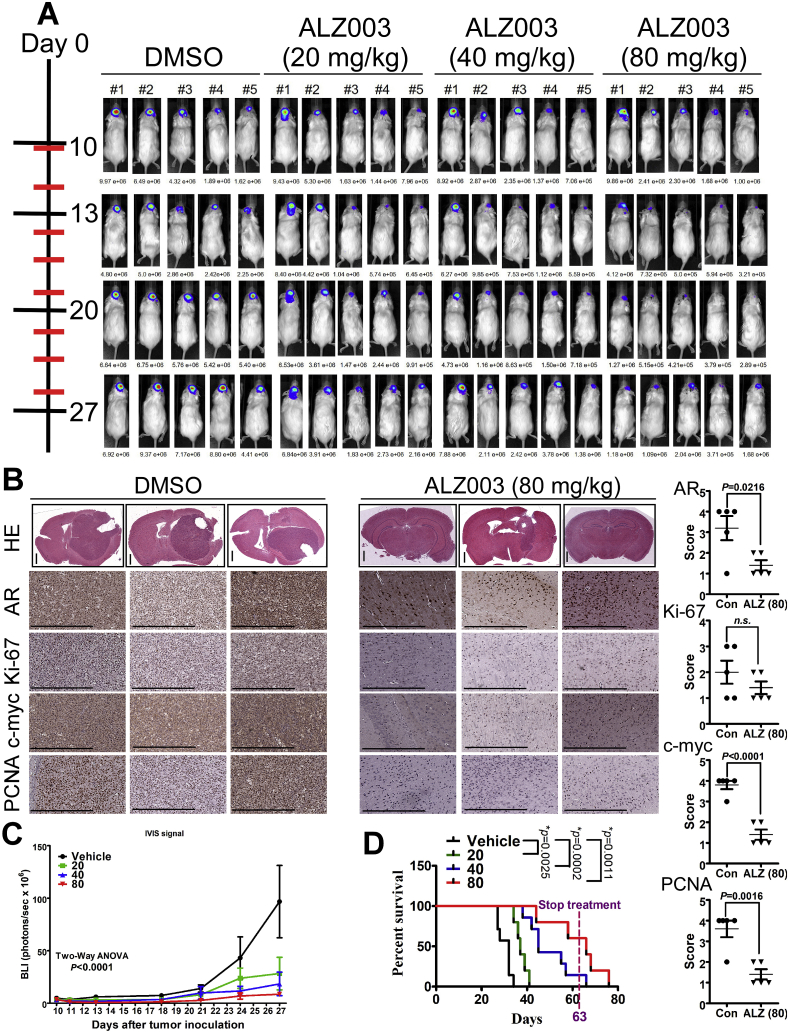
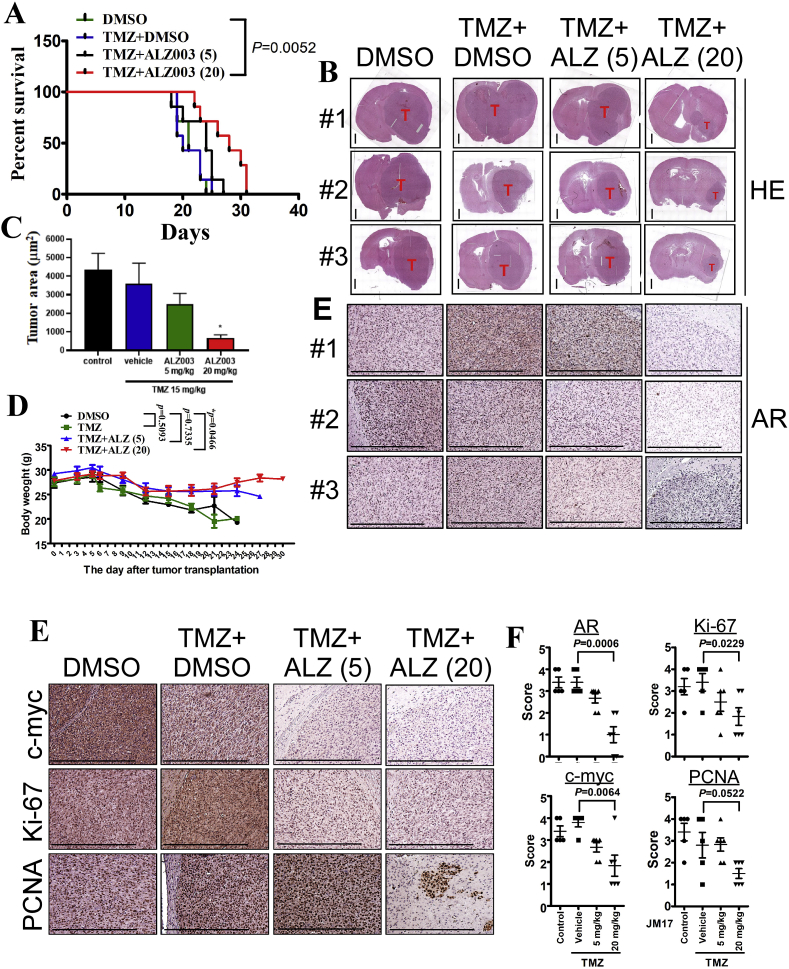
Drug resistance is the main obstacle in the improvement of chemotherapeutic efficacy in glioblastoma. Previously, we showed that dehydroepiandrosterone (DHEA), one kind of androgen/neurosteroid, potentiates glioblastoma to acquire resistance through attenuating DNA damage. Androgen receptor (AR) activated by DHEA or other types of androgen was reported to promote drug resistance in prostate cancer. However, in DHEA-enriched microenvironment, the role of AR in acquiring resistance of glioblastoma remains unknown. In this study, we found that AR expression is significantly correlated with poor prognosis, and AR obviously induced the resistance to temozolomide (TMZ) treatment. Herein, we observed that ALZ003, a curcumin analog, induces FBXL2-mediated AR ubiquitination, leading to degradation. Importantly, ALZ003 significantly inhibited the survival of TMZ-sensitive and -resistant glioblastoma in vitro and in vivo. The accumulation of reactive oxygen species (ROS), lipid peroxidation and suppression of glutathione peroxidase (GPX) 4, which are characteristics of ferroptosis, were observed in glioblastoma cell after treatment of ALZ003. Furthermore, overexpression of AR prevented ferroptosis in the presence of GPX4. To evaluate the therapeutic effect in vivo, we transplanted TMZ-sensitive or -resistant U87MG cells into mouse brain followed by intravenous administration with ALZ003. In addition to inhibiting the growth of glioblastoma, ALZ003 significantly extended the survival period of transplanted mice, and significantly decreased AR expression in the tumor area. Taken together, AR potentiates TMZ resistance for glioblastoma, and ALZ003-mediated AR ubiquitination might open a new insight into therapeutic strategy for TMZ resistant glioblastoma.

Keywords: ALZ003; AR; GPX4; Glioblastoma.


Conflict of interest statement

Declaration of competing interest TCC, CHY and HC are employed by Allianz Pharmascience Ltd. when this collaborative study was conducted.

Figures

Image 1
Graphical abstract
Fig. 1
Fig. 1
The correlation of AR expression with prognosis and drug resistance in glioblastoma. A. Bioinformatics analysis for AR in glioblastoma. The mRNA expression of AR in normal brain and glioblastoma tissues was compared in the TCGA dataset using the Oncomine website. The correlation of AR mRNA expression with prognosis was acquired from GSE4412 released by Freije et al. using the SurvExpress website. P-value was indicated. B. The protein level of AR in human specimens was analyzed using western blotting. N: normal brain tissue; T: glioblastoma tissue. The results of two paired specimens were quantitated. Data were expressed as mean ± s.e.m. (*p < 0.05). C, D. The expression of AR in multiple cell glioblastoma cell lines and a prostate cancer cell line, LNCaP (positive control). SVG p12 (SVG) is an immortalized fetal glial cell line. Experiments were performed three times independently, and data were expressed as mean ± s.e.m. (*p < 0.05). E. After transfection with Flag-AR or siRNA-mediated AR knockdown (F) for 2 days, U87MG-R cells viability was estimated by MTT assay. G. After transfection with Flag-AR for 24 h, U87MG cells were treated with 100 μM TMZ for the indicated interval. Viability was estimated by MTT assay. Experiments were performed three times independently, and data were expressed as mean ± s.e.m. The significant difference between control and knockdown/overexpression groups was analyzed using two-way ANOVA. P-value was indicated. The cell lysates were subjected to western blotting to confirm Flag-AR expression and AR knockdown.
Fig. 2
Fig. 2
Effect of ALZ003 on glioblastoma and AR expression. A. Primary mouse astrocytes were treated with ALZ003 for 48 h, and then cell viability was determined by MTT assay. Left: representative images of astrocytes. Right: cell viability. Experiments were performed three times independently, and data were expressed as mean ± s.e.m. B, C. After treatment for 48 h, cell viability was estimated by MTT assay. Experiments were performed three times independently, and data were expressed as mean ± s.e.m. P-value was determined by Student's t-test. D. The cultured media from U87MG and Pt#3 with or without ALZ003 treatment for 48 h was analyzed by Caspase 3/7, 8 and 9-Glo activity kits. Experiments were performed three times independently, and data were expressed as mean ± s.e.m. (*p < 0.05, **p < 0.01). After treatment for 24 h, whole cell lysates of U87MG (E) or Pt#3 (F) were prepared and analyzed by western blotting using the anti-AR antibody. Lower panel is the quantitated results. Experiments were performed three times independently, and data were expressed as mean ± s.e.m. (*p < 0.05, **p < 0.01).
Fig. 3
Fig. 3
FBXL2 plays a role in ALZ003-induced AR ubiquitination. A. Effect of ALZ003 on protein ubiquitination and ER stress. After treatment for indicated time points, cell lysates were prepared and subjected to western blotting using the indicated antibody. Lower panel is the quantitated results. Experiments were performed three times independently, and data were expressed as mean ± s.e.m. P-value was determined by Student's t-test with the Control group. (*p < 0.05, **p < 0.01, ***p < 0.001). B. After treatment for 24 h, cell lysates of U87MG were immunoprecipitated using the anti-AR antibody, and the immune complex was analyzed by western blotting using the anti-ubiquitin antibody. Lower panel is the quantitated results, and the ubiquitin signal ranged from 100 kDa to the top of membrane was quantified. Experiments were performed three times independently, and data were expressed as mean ± s.e.m. (*p < 0.05). C. The association of AR with the ubiquitin E3 ligase. AR-precipitated immune complex was analyzed by western blotting. Experiments were performed three times independently, and data were expressed as mean ± s.e.m. (***p < 0.001). D. Effect of FBXL2 on AR expression. After transfection with Flag-FBXL2 for 24 h or FBXL2 knockdown (E) for 3 days (Left), AR expression was estimated. Experiments were performed three times independently, and data were expressed as mean ± s.e.m. (**p < 0.01, ***p < 0.001). E. After FBXL2 knockdown for 48 h, U87MG cells were treated with ALZ003 for 24 h. AR-precipitated immune complex was analyzed by western blotting using the anti-ubiquitin antibody. Experiments were performed three times independently, and data were expressed as mean ± s.e.m. (***p < 0.001).
Fig. 4
Fig. 4
ALZ003 increases ROS and lipid peroxidation through decreasing GPX4 expression. A. After treatment for 24 h, U87MG cells were harvested for analyzing ROS production using DHR123. The number is the mean of fluorescence representing the level of ROS. Right panel is the quantitative result. Experiments were performed three times independently, and data were expressed as mean ± s.e.m. (*p < 0.05, **p < 0.01). Additionally, cells were analyzed for the H2O2 level (B), GSH/GSSG ratio (C) and GSHR activity (D). C. *p and #p means the significant difference between control with treatment in U87MG and Pt#3, respectively. (*p, #p < 0.05, **p < 0.01).
Fig. 5
Fig. 5
ALZ003 induces lipid peroxidation through decreasing GPX4 expression. A. After 24 h treatment, lipid peroxidation was estimated by staining cells with BODIPY 581/591C11 reagent. Immunofluorescent signal representing peroxidase lipid was photographed by fluorescent microscope under 40X magnification. The scale bar represented 0.1 mm. After treatment for 24 h, GPX4 expression in U87MG (B) and Pt#3 (C) cells was analyzed. Experiments were performed three times independently, and data were expressed as mean ± s.e.m. P-value was determined by Student's t-test compared with the Control group. (*p < 0.05, **p < 0.01). C. Effect of GPX4 on ALZ003-induced lipid peroxidation. (a). Overexpression of Flag-GPX4. *Star represents the non-specific band. After transfection for 24 h, cells were treated with ALZ003 for 24 h. Subsequently cells were subjected to BODIPY staining (b) and H2O2-Glo analysis (c) (**p < 0.01, ***p < 0.001; #p < 0.05, ##p < 0.01 compared with the group without treatment and overexpression.) Immunofluorescent signal representing peroxidase lipid was photographed by fluorescent microscope under 40X magnification. The scale bar represented 0.1 mm.
Fig. 6
Fig. 6
AR regulates lipid peroxidation through GPX4. A. Effect of AR knockdown on GPX4 expression. Lower panel is the quantitated results. Experiments were performed three times independently, and data were expressed as mean ± s.e.m. P-value was determined by Student's t-test. (***p < 0.001). B. AR knockdown induces strong lipid peroxidation photographed under 100X magnification in U87MG cells. Yellow arrows indicate lipid peroxidation. The scale bar represented 0.04 mm. C. After GPX4 knockdown for 2 days followed by transfection with Flag-AR for 1 day, U87MG cells were treated with 5 μM ALZ003 for 24 h. Viability was analyzed by MTT assay. Experiments were performed three times independently, and data were expressed as mean ± s.e.m. (*p < 0.05, **p < 0.01). Follow (C), lipid peroxidation was analyzed by BODIPY staining. (For interpretation of the references to colour in this figure legend, the reader is referred to the Web version of this article.)
Fig. 7
Fig. 7
Therapeutic effect of ALZ003 on the growth of glioblastoma in vivo. A. Luciferase-expressed U87MG cells (2 × 105) were intracranially transplanted into brains of nude mice. After 10 days, luciferase activity representing tumor size was monitored by IVIS200 system on Days 10, 13, 20 and 27. Experimental mice were administrated intravenously with ALZ003 three times per week. Left: The time line for IVIS200 evaluation (black line) and drug injection (red line). B. The mouse brain was paraffin embedded and subjected to histological analysis. Left panel: Brain slides were stained by hematoxylin and eosin or stained using indicated antibodies. Stained slides were photographed by microscope with 20X magnification. The scale bar for HE staining of whole brain slice is 1 mm, and that for other IHC images is 0.5 mm. Right: The IHC signal was quantitated by 4 Scores as described in Materials and Methods. P-value is indicated and “n.s.” means “not significant”. C. The statistical analysis for luciferase activity analyzed by two-way ANOVA (***p < 0.0001). D. The comparison of survival period was performed using Log-Rank Test. P-value for each paired comparison was indicated. ALZ003 administration was terminated on Day 63. (For interpretation of the references to colour in this figure legend, the reader is referred to the Web version of this article.)
Fig. 8
Fig. 8
Therapeutic effect of ALZ003 on the growth of TMZ-resistant glioblastoma in vivo. A. After intracranial transplantation with TMZ-resistant U87MG cells for 10 days, mice were orally and intravenously administrated with TMZ (15 mg/kg) and ALZ003 three times per week, respectively. The date of death was recorded and analyzed by Log-Rank Test. (**p = 0.0052). B. The mouse brains were paraffin embedded and subject to slides preparation followed by hematoxylin- and eosin-staining. Tumor in each slide was indicated. The scale bar for HE staining of whole brain slice is 1 mm, and that for other IHC images is 0.5 mm. C. The area of tumor was quantitated by the Image J software. The difference with the control group was analyzed using Student's t-test (*p < 0.05). D. The alteration in body weight of transplanted mice during the process of experiment. The difference with DMSO group was analyzed using two-way ANOVA. P-value was indicated. E, F. The slides were immunostained using the antibody targeting AR, c-myc, Ki-67 or PCNA. The scale bar represents 0.5 mm. F. The intensity of the interested protein was quantified using Score definition. The comparison was performed using Student's t-test. P-value was indicated.

References

    1. Stupp R., Mason W.P., van den Bent M.J., Weller M., Fisher B., Taphoorn M.J., Belanger K., Brandes A.A., Marosi C., Bogdahn U., Curschmann J., Janzer R.C., Ludwin S.K., Gorlia T., Allgeier A., Lacombe D., Cairncross J.G., Eisenhauer E., Mirimanoff R.O., European Organisation for R., Treatment of Cancer Brain T., Radiotherapy G., National Cancer Institute of Canada Clinical Trials G. Radiotherapy plus concomitant and adjuvant temozolomide for glioblastoma. N. Engl. J. Med. 2005;352(10):987–996. - PubMed
    1. Crona D.J., Whang Y.E. Androgen receptor-dependent and -independent mechanisms involved in prostate cancer therapy resistance. Cancers (Basel) 2017;9(6):E67. pii. - PMC - PubMed
    1. Li P., Chen J., Miyamoto H. Androgen receptor signaling in bladder cancer. Cancers (Basel) 2017;9(2):E20. pii. - PMC - PubMed
    1. Narayanan R., Dalton J.T. Androgen receptor: a complex therapeutic target for breast cancer. Cancers (Basel) 2016;8(12):E108. pii. - PMC - PubMed
    1. Dalin M.G., Watson P.A., Ho A.L., Morris L.G. Androgen receptor signaling in salivary gland cancer. Cancers (Basel) 2017;9(2):E17. pii. - PMC - PubMed

Publication types

MeSH terms