

Genome-wide redistribution of 24-nt siRNAs in rice gametes
- PMID: 31896557
- PMCID: PMC7050532
- DOI: 10.1101/gr.253674.119
Genome-wide redistribution of 24-nt siRNAs in rice gametes
Abstract
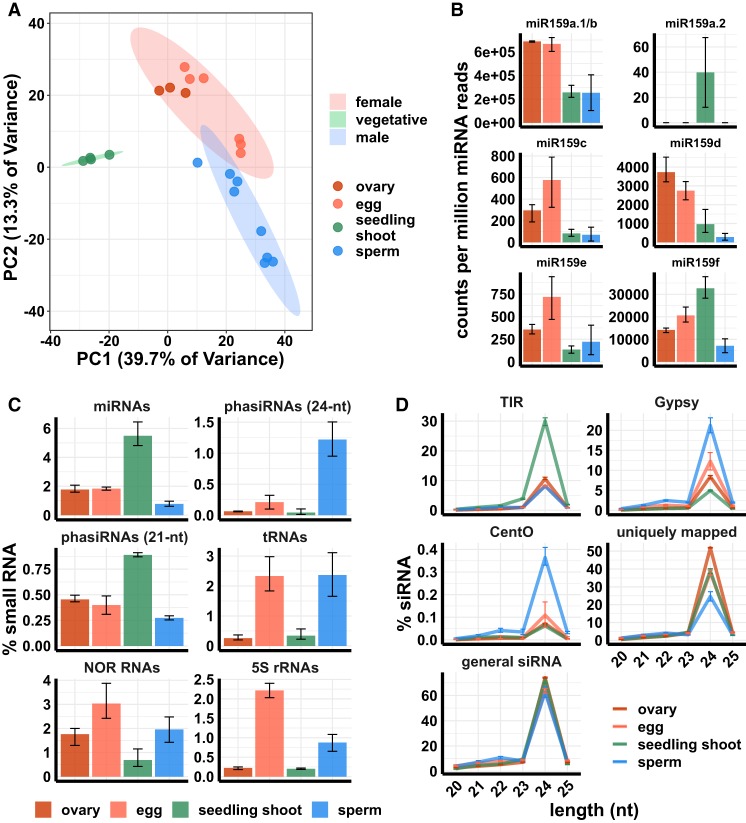
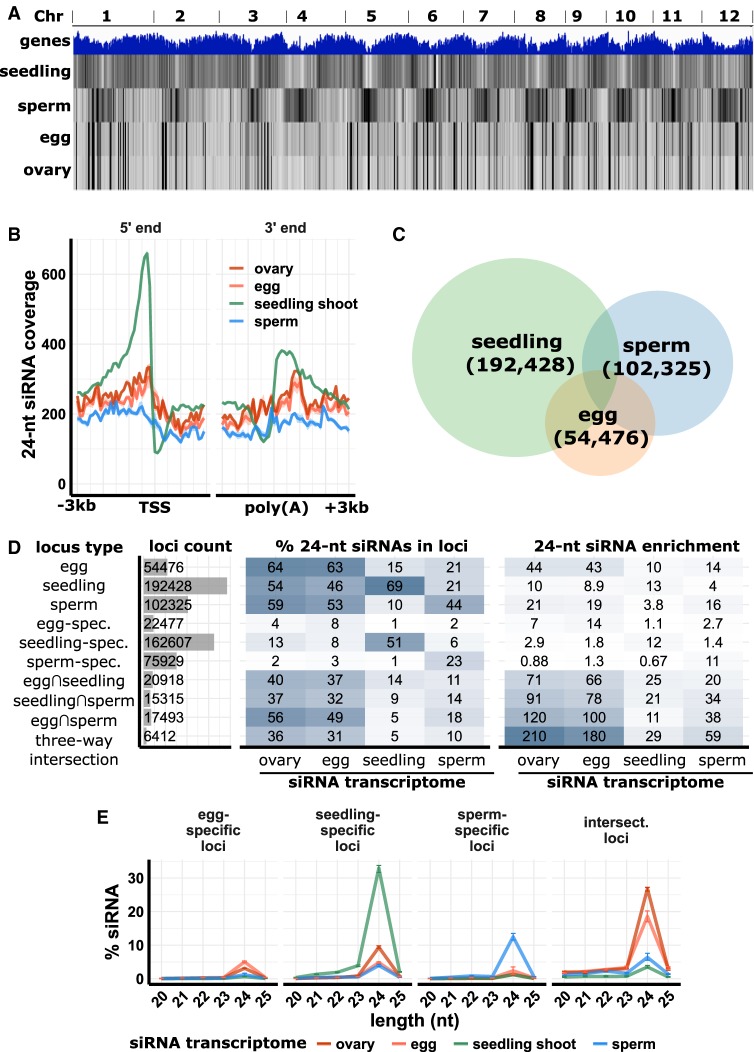
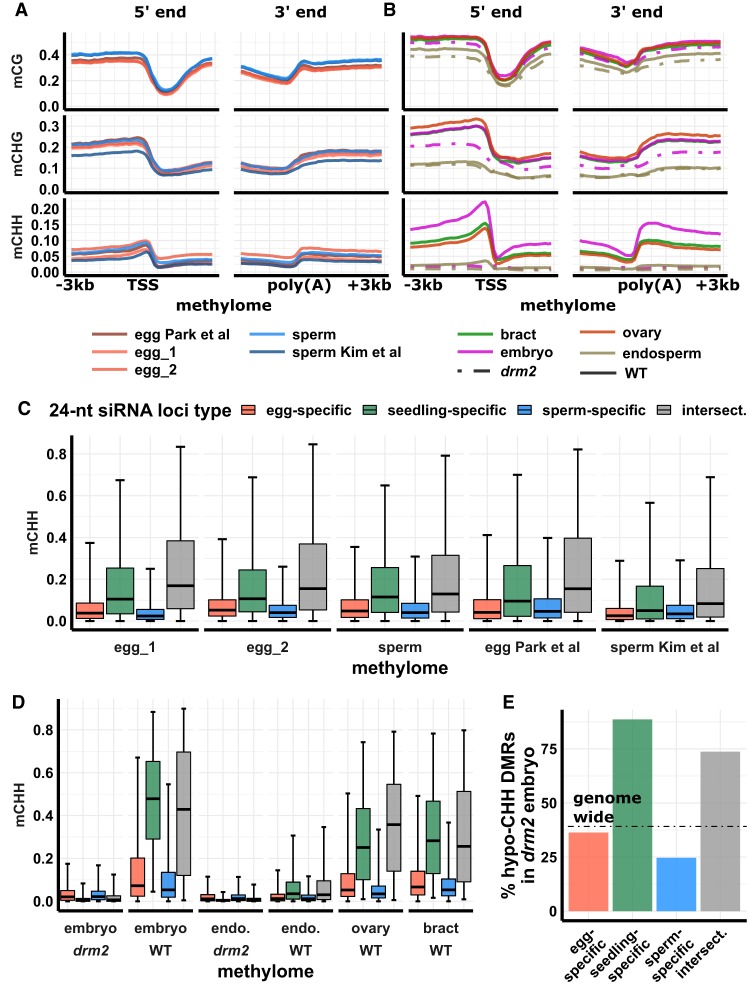
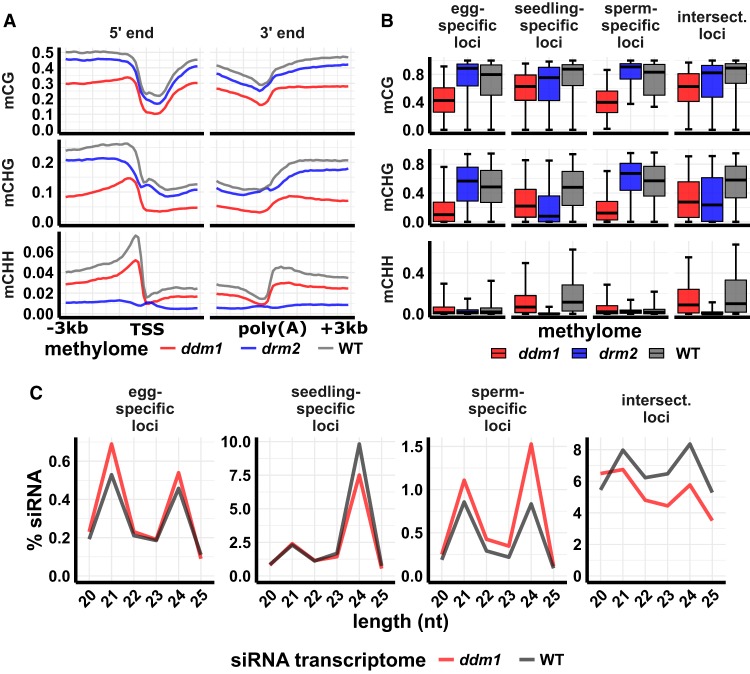
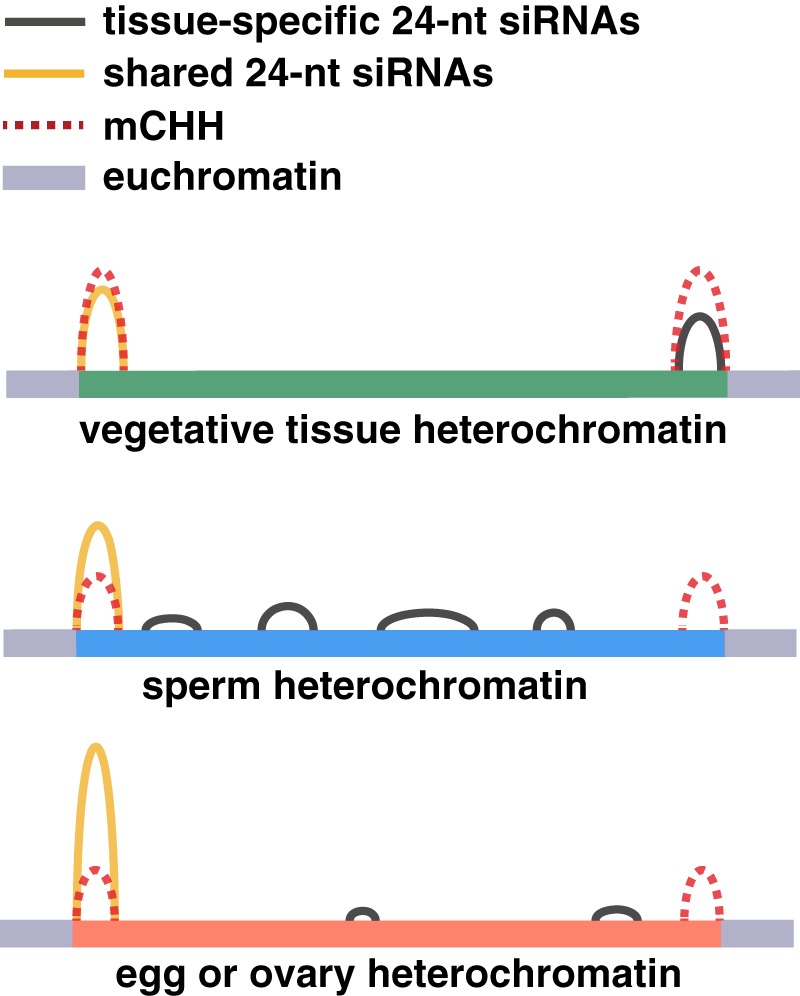
Gametes constitute a critical stage of the plant life cycle during which the genome undergoes reprogramming in preparation for embryogenesis. Here, we examined genome-wide distributions of small RNAs in the sperm and egg cells of rice. We found that 24-nt siRNAs, which are a hallmark of RNA-directed DNA methylation (RdDM) in plants, were depleted from heterochromatin boundaries in both gametes relative to vegetative tissues, reminiscent of siRNA patterns in DDM1-type nucleosome remodeler mutants. In sperm cells, 24-nt siRNAs were spread across heterochromatic regions, while in egg cells, 24-nt siRNAs were concentrated at a smaller number of heterochromatic loci throughout the genome, especially at loci which also produced siRNAs in other tissues. In both gametes, patterns of CHH methylation, typically a strong indicator of RdDM, were similar to vegetative tissues, although lower in magnitude. These findings indicate that the small RNA transcriptome undergoes large-scale redistribution in both male and female gametes, which is not correlated with recruitment of DNA methyltransferases in gametes and suggestive of unexplored regulatory activities of gamete small RNAs.
© 2020 Li et al.; Published by Cold Spring Harbor Laboratory Press.
Figures
Similar articles
-
Resetting of the 24-nt siRNA landscape in rice zygotes.Genome Res. 2022 Feb;32(2):309-323. doi: 10.1101/gr.275981.121. Epub 2021 Dec 23. Genome Res. 2022. PMID: 34949668 Free PMC article.
-
Redistribution of CHH Methylation and Small Interfering RNAs across the Genome of Tomato ddm1 Mutants.Plant Cell. 2018 Jul;30(7):1628-1644. doi: 10.1105/tpc.18.00167. Epub 2018 Jun 6. Plant Cell. 2018. PMID: 29875274 Free PMC article.
-
Genome-wide identification of endogenous RNA-directed DNA methylation loci associated with abundant 21-nucleotide siRNAs in Arabidopsis.Sci Rep. 2016 Oct 27;6:36247. doi: 10.1038/srep36247. Sci Rep. 2016. PMID: 27786269 Free PMC article.
-
Small RNAs and regulation of transposons in plants.Genes Genet Syst. 2013;88(1):3-7. doi: 10.1266/ggs.88.3. Genes Genet Syst. 2013. PMID: 23676705 Review.
-
Small RNAs and transposon silencing in plants.Dev Growth Differ. 2012 Jan;54(1):100-7. doi: 10.1111/j.1440-169X.2011.01309.x. Epub 2011 Dec 12. Dev Growth Differ. 2012. PMID: 22150226 Review.
Cited by
-
PhasiRNAnalyzer: an integrated analyser for plant phased siRNAs.RNA Biol. 2021 Nov;18(11):1622-1629. doi: 10.1080/15476286.2021.1879543. Epub 2021 Feb 4. RNA Biol. 2021. PMID: 33541212 Free PMC article.
-
Low cell number ChIP-seq reveals chromatin state-based regulation of gene transcription in the rice male meiocytes.Plant Biotechnol J. 2022 Dec;20(12):2236-2238. doi: 10.1111/pbi.13921. Epub 2022 Sep 22. Plant Biotechnol J. 2022. PMID: 36056565 Free PMC article. No abstract available.
-
Polyploidy-associated paramutation in Arabidopsis is determined by small RNAs, temperature, and allele structure.PLoS Genet. 2021 Mar 9;17(3):e1009444. doi: 10.1371/journal.pgen.1009444. eCollection 2021 Mar. PLoS Genet. 2021. PMID: 33690630 Free PMC article.
-
The Rise and Fall of Billionaire siRNAs during Reproductive Development in Rice.Plants (Basel). 2022 Jul 28;11(15):1957. doi: 10.3390/plants11151957. Plants (Basel). 2022. PMID: 35956435 Free PMC article.
-
Epigenetic gene regulation in plants and its potential applications in crop improvement.Nat Rev Mol Cell Biol. 2025 Jan;26(1):51-67. doi: 10.1038/s41580-024-00769-1. Epub 2024 Aug 27. Nat Rev Mol Cell Biol. 2025. PMID: 39192154 Review.
References
-
- Anderson SN, Johnson CS, Jones DS, Conrad LJ, Gou X, Russell SD, Sundaresan V. 2013. Transcriptomes of isolated Oryza sativa gametes characterized by deep sequencing: evidence for distinct sex-dependent chromatin and epigenetic states before fertilization. Plant J 76: 729–741. 10.1111/tpj.12336 - DOI - PubMed
-
- Anderson SN, Johnson CS, Chesnut J, Jones DS, Khanday I, Woodhouse M, Li C, Conrad LJ, Russell SD, Sundaresan V. 2017. The zygotic transition is initiated in unicellular plant zygotes with asymmetric activation of parental genomes. Dev Cell 43: 349–358.e4. 10.1016/j.devcel.2017.10.005 - DOI - PubMed
Publication types
MeSH terms
Substances
LinkOut - more resources
Full Text Sources
Research Materials