. 2020 Mar;26(3):324-344.
doi: 10.1261/rna.073247.119. Epub 2020 Jan 2.

Genome-wide analysis identifies cis-acting elements regulating mRNA polyadenylation and translation during vertebrate oocyte maturation

Affiliations

Genome-wide analysis identifies cis-acting elements regulating mRNA polyadenylation and translation during vertebrate oocyte maturation

Fei Yang et al. RNA. 2020 Mar.

Abstract

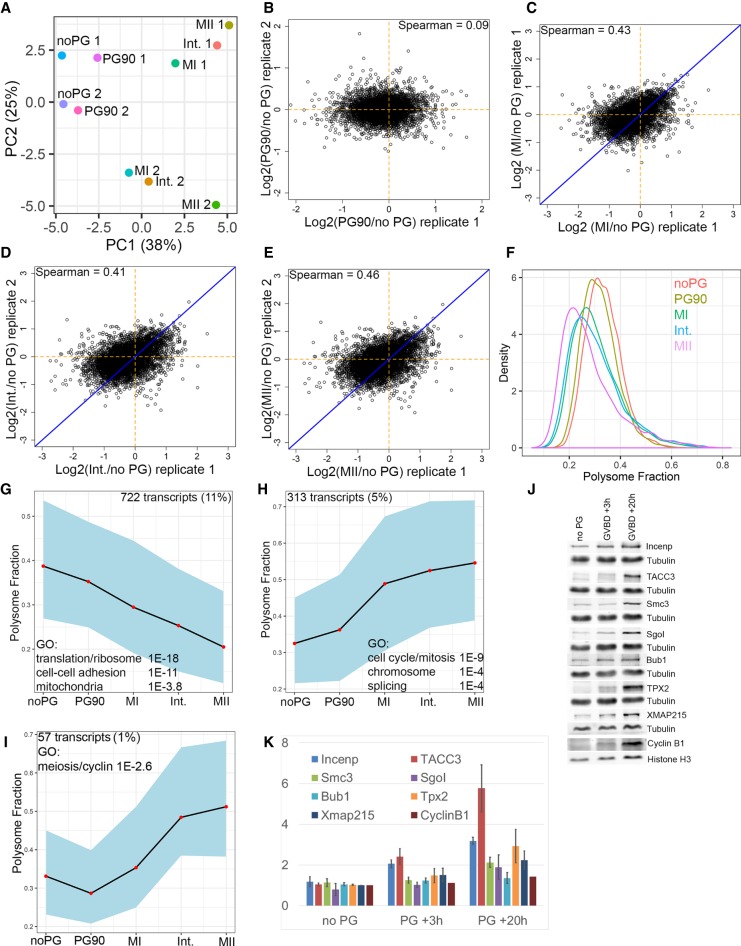
Most cells change patterns of gene expression through transcriptional regulation. In contrast, oocytes are transcriptionally silent and regulate mRNA poly(A) tail length to control protein production. However, the genome-wide relationship of poly(A) tail changes to mRNA translation during vertebrate oocyte maturation is not known. We used Tail-seq and polyribosome analysis to measure poly(A) tail and translational changes during oocyte maturation in Xenopus laevis We identified large-scale poly(A) and translational changes during oocyte maturation, with poly(A) tail length changes preceding translational changes. Proteins important for completion of the meiotic divisions and early development exhibited increased polyadenylation and translation during oocyte maturation. A family of U-rich sequence elements was enriched near the polyadenylation signal of polyadenylated and translationally activated mRNAs. We propose that changes in mRNA polyadenylation are a conserved mechanism regulating protein expression during vertebrate oocyte maturation and that these changes are controlled by a spatial code of cis-acting sequence elements.

Keywords: oocyte; polyadenylation; translation.


Figures

FIGURE 1.
FIGURE 1.
Measurement of poly(A) tail changes during oocyte maturation. (A) Synthetic spike sequences containing various lengths of A homopolymers were sequenced using an Illumina miSeq. Cumulative distribution plot shows the poly(A) lengths as determined by the Illumina base-calling software. (B) A custom algorithm was developed to more accurately determine the length of poly(A) sequences from raw Illumina sequencing files. Cumulative distribution plot shows the distribution of poly(A) lengths determined by our custom software on the same sequencing data presented in A. (C) Histone H1 kinase assays of oocytes as they progress through meiotic maturation. Red asterisk indicates time points that were used for Tail-seq and polysome analysis. (D) Tail-seq measurements from two biological replicates were analyzed using principal components analysis. PCA plot shows the relationship between different time points and different biological replicates. (E) Histogram showing measured poly(A) tail lengths at five time points spanning meiotic maturation. Curves are the average of two replicates. (F) Average measured poly(A) tail lengths for mRNAs previously reported to be polyadenylated during oocyte maturation. In X. laevis many genes have paralogs which are indicated by a .L and .S designation. (G) PAT assay was used to analyze poly(A) tail length of the indicated transcripts during oocyte maturation. Similar results were observed in an additional biological replicate (not shown). Poly(A) tail predictions from our Tail-seq data are indicated beside the gene name. (HJ) Scatterplots comparing poly(A) tail lengths measured by Tail-seq and the PAT assay at MI, Interkinesis, and MII. (K) STEM cluster of transcripts exhibiting increased polyadenylation during oocyte maturation. Enriched GO terms are indicated on the plot. (L) STEM cluster of deadenylated transcripts and enriched GO terms.
FIGURE 2.
FIGURE 2.
RNA degradation during oocyte maturation. RNA-seq reads from polysome gradients were pooled to create “total RNA” samples for analysis of transcript stability during oocyte maturation. (AD) Scatterplots comparing two biological replicates of changes in RNA abundance during oocyte maturation. (E) STEM software was used to identify clusters of transcripts that were up- or down-regulated during oocyte maturation. One cluster of degraded transcripts was identified. GO terms enriched in this set of transcripts are indicated on plot. (F) Scatterplot comparing change in RNA stability for degraded transcripts (from E) to normalized measured poly(A) tail length. (G) Q-RT-PCR was used to measure the stability of nine transcripts predicted to be degraded from two additional biological replicates. We also tested several transcripts that were predicted to be increased during oocyte maturation and were unable to confirm any changes in transcript levels. Error bars indicate standard deviation after normalization to an unchanged transcript. (H) Comparison of RNA-seq abundance of mRNAs captured by oligo(dT) or Cap-capture from Blower et al. (2013). Transcripts are colored by ratio of FPKM between dT and Cap-capture libraries. (I) Violin plots of poly(A) tail length for each class of transcripts from H. CAP/dT ratios are indicated below the plot. P-values are the result of a Wilcoxon rank-sum test.
FIGURE 3.
FIGURE 3.
Translational changes during oocyte maturation. (A) Extracts from oocytes at different stages of maturation were separated on sucrose gradients and the fraction of mRNA associated with polysomes was calculated. PCA analysis and plot shows the relationship between different oocyte stages and biological replicates. (BE) Scatterplots comparing changes in mRNA polysome fraction between replicate extracts. Spearman correlation coefficients are indicated on the plots. (F) Histogram plot showing the fraction of mRNA associated with polysomes at different stages of oocyte maturation. (G) STEM cluster of translationally repressed mRNAs and associated GO terms. (H) STEM cluster of translationally activated mRNAs and associated GO terms. (I) STEM cluster of slowly translationally activated mRNAs and associated GO terms. (J) Western blots of candidate proteins predicted to be translationally activated during oocyte maturation. (K) Quantitation of western blots from two biological replicates.
FIGURE 4.
FIGURE 4.
Correlation between transcript polyadenylation and translation. (AD) Scatterplots of the change in polyadenylation compared to the change of the fraction of mRNA present on polysomes. (E) Spearman correlation coefficients between changes in polyadenylation and changes in mRNA fraction on polysomes. (F) Spearman correlation coefficients of raw poly(A) tail length and raw polysome percentage measurements. (G) The translation behavior of deadenylated transcripts (from Fig. 1H) was examined using STEM software. All deadenylated transcripts exhibited translational repression. (H,I) The translation behavior of adenylated transcripts (From Fig. 1G) was examined using STEM software. Adenylated transcripts were either translationally activated (H) or repressed (I). (J) Violin plots of the raw poly(A) tail lengths of polyadenylated transcripts that were translationally activated (up arrow) or repressed (down arrow). (K) Violin plots of the fold change in poly(A) tail length of adenylated transcripts that were translationally activated (up arrow) or repressed (down arrow). Indicated P-values are the result of a Wilcoxon rank-sum test.
FIGURE 5.
FIGURE 5.
PAS-seq analysis of the X. laevis oocyte transcriptome. (A) PAS-seq was used to identify PASs in X. laevis oocytes. Pie chart shows the fraction of PASs mapping to each type of transcript feature. (B) Histogram of the number of PASs per gene. (C) Histogram of the average number of nucleotides from the 3′ most base of the polyadenylation signal (AAUAAA, AUUAAA) to the measured end of the transcript. (D,E) Genome browser views of PAS-seq reads compared to three genes. PAS calls are listed below each gene as thin bars.
FIGURE 6.
FIGURE 6.
Primary sequence motifs are enriched in polyadenylated and translationally activated transcripts. (A) 3′UTRs lengths were measured from clusters of mRNAs exhibiting various polyadenylation and translation behavior. P-values are the result of a Wilcoxon rank sum test. (BE) The density of all hexamers was calculated in the 3′UTRs of various sets of transcripts (polyadenylated [B], deadenylated [C], translationally activated [D], translationally repressed [E]) and in all transcripts. Cumulative distribution plots show the enrichment of various hexamers in different subsets of transcripts compared to all transcripts. (F,G) Hexamer enrichment was calculated in the 3′UTRs of polyadenylated transcripts that were translationally activated (F) or translationally repressed (G). Translationally activated transcripts exhibit a higher density of U-rich sequence elements. (H) The positions of the top 13 U-rich elements (from B) were compared to the 3′-most polyadenylation signal for all transcripts (black line) and adenylated transcripts. (I) The relative density of U-rich sequences compared to the 3′-most polyadenylation signal for translationally activated transcripts. (J) Scatterplot of poly(A) tail length (at MII) and the number of U-rich hexamers in the entire 3′UTR for translationally activated (red) or repressed (blue) mRNAs. (K) Same plot as in J except that U-rich element density is only compared in the 100 nt 5′ of the PAS sequence. (L) Violin plot of U-rich element density in the 100 nt 5′ of the PAS sequence in translationally activated and repressed mRNAs. P-value is the result of a Wilcoxon rank-sum test.
FIGURE 7.
FIGURE 7.
(A) Schematic diagram of Spc25.L 3′UTR with positions of U-rich hexamers and PAS indicated. (B) Normalized translation activity at noPG of Firefly luciferase fused to WT or mutant Spc25.L 3′UTR sequences. (C) Relative translation activation GVBD/noPG for WT and mutant Spc25.L 3′UTR sequences.
FIGURE 8.
FIGURE 8.
Model for control of polyadenylation and translation by U-rich sequence elements and 3′UTR length.

References

    1. Afroz T, Skrisovska L, Belloc E, Guillen-Boixet J, Mendez R, Allain FH. 2014. A fly trap mechanism provides sequence-specific RNA recognition by CPEB proteins. Genes Dev 28: 1498–1514. 10.1101/gad.241133.114 - DOI - PMC - PubMed
    1. Bajak EZ, Hagedorn CH. 2008. Efficient 5′ cap-dependent RNA purification: use in identifying and studying subsets of RNA. Methods Mol Biol 419: 147–160. 10.1007/978-1-59745-033-1_10 - DOI - PubMed
    1. Beilharz TH, Preiss T. 2007. Widespread use of poly(A) tail length control to accentuate expression of the yeast transcriptome. RNA 13: 982–997. 10.1261/rna.569407 - DOI - PMC - PubMed
    1. Blower MD, Jambhekar A, Schwarz DS, Toombs JA. 2013. Combining different mRNA capture methods to analyze the transcriptome: analysis of the Xenopus laevis transcriptome. PLoS One 8: e77700 10.1371/journal.pone.0077700 - DOI - PMC - PubMed
    1. Chang H, Lim J, Ha M, Kim VN. 2014. TAIL-seq: genome-wide determination of poly(A) tail length and 3′ end modifications. Mol Cell 53: 1044–1052. 10.1016/j.molcel.2014.02.007 - DOI - PubMed

Publication types

MeSH terms