. 2020 Feb 14;295(7):1829-1842.
doi: 10.1074/jbc.RA119.010729. Epub 2020 Jan 2.

Unique metabolite preferences of the drug transporters OAT1 and OAT3 analyzed by machine learning

Affiliations

Unique metabolite preferences of the drug transporters OAT1 and OAT3 analyzed by machine learning

Anisha K Nigam et al. J Biol Chem. .

Abstract

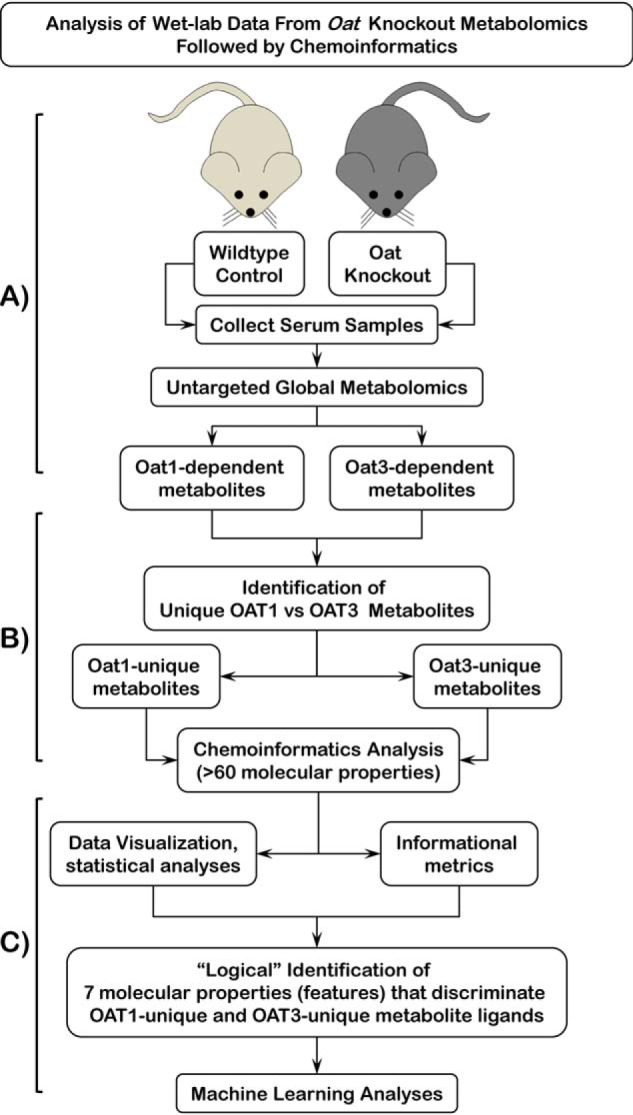
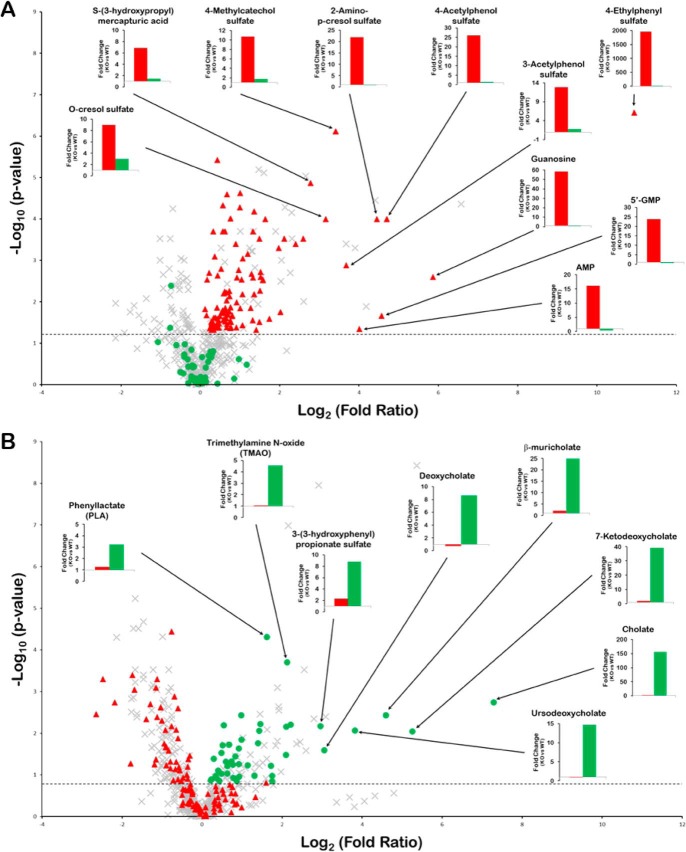
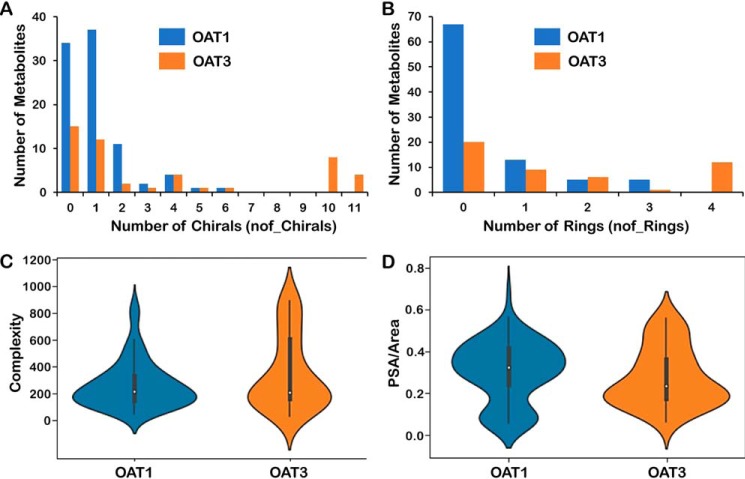
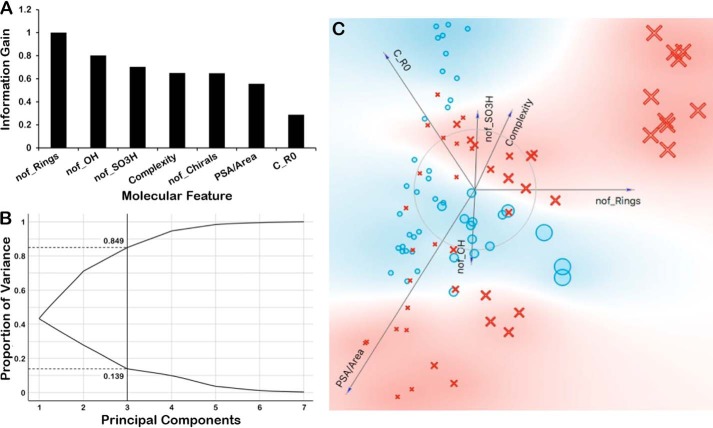
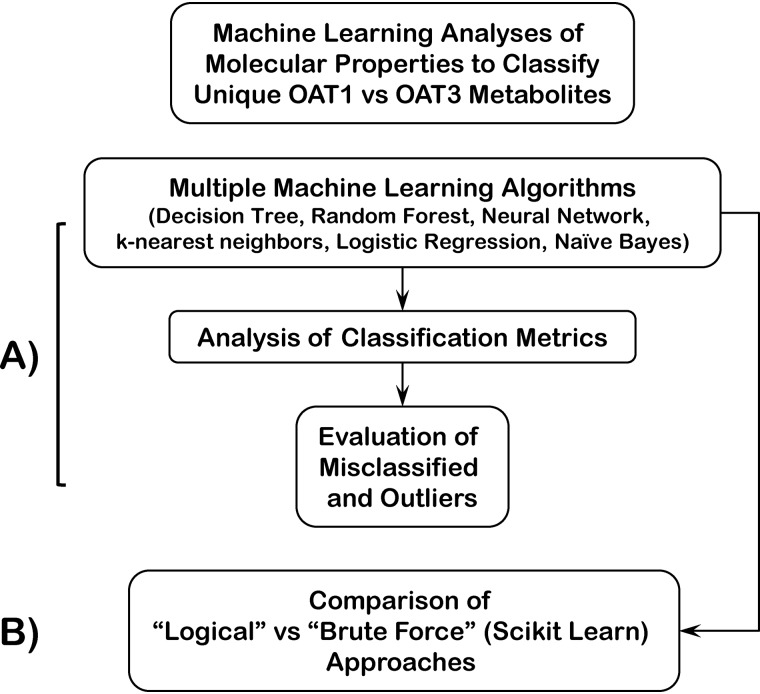
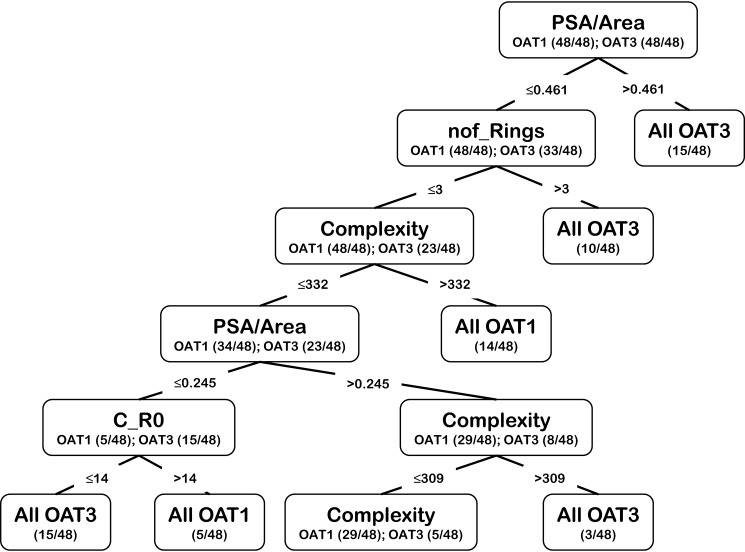
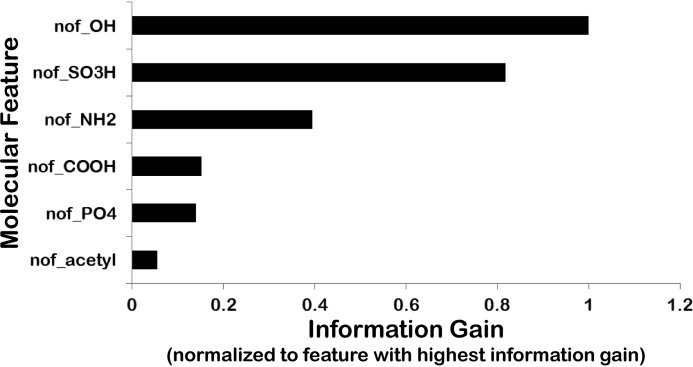
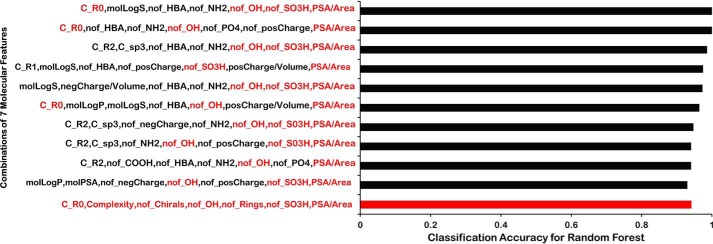
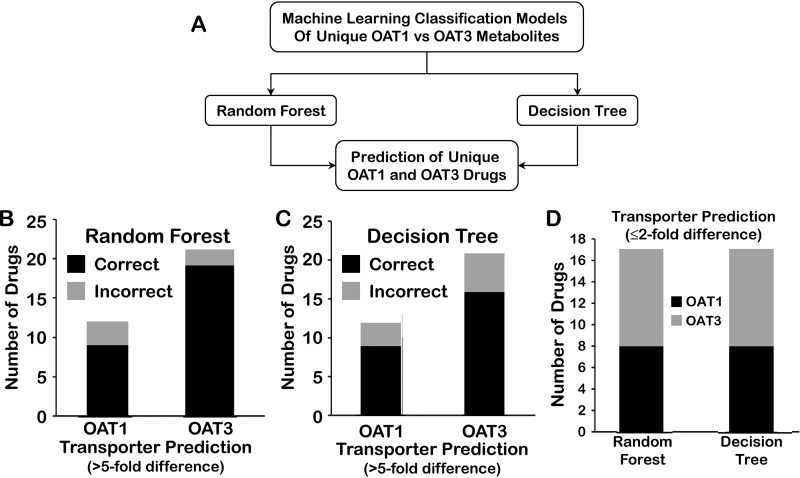
The multispecific organic anion transporters, OAT1 (SLC22A6) and OAT3 (SLC22A8), the main kidney elimination pathways for many common drugs, are often considered to have largely-redundant roles. However, whereas examination of metabolomics data from Oat-knockout mice (Oat1 and Oat3KO) revealed considerable overlap, over a hundred metabolites were increased in the plasma of one or the other of these knockout mice. Many of these relatively unique metabolites are components of distinct biochemical and signaling pathways, including those involving amino acids, lipids, bile acids, and uremic toxins. Cheminformatics, together with a "logical" statistical and machine learning-based approach, identified a number of molecular features distinguishing these unique endogenous substrates. Compared with OAT1, OAT3 tends to interact with more complex substrates possessing more rings and chiral centers. An independent "brute force" approach, analyzing all possible combinations of molecular features, supported the logical approach. Together, the results suggest the potential molecular basis by which OAT1 and OAT3 modulate distinct metabolic and signaling pathways in vivo As suggested by the Remote Sensing and Signaling Theory, the analysis provides a potential mechanism by which "multispecific" kidney proximal tubule transporters exert distinct physiological effects. Furthermore, a strong metabolite-based machine-learning classifier was able to successfully predict unique OAT1 versus OAT3 drugs; this suggests the feasibility of drug design based on knockout metabolomics of drug transporters. The approach can be applied to other SLC and ATP-binding cassette drug transporters to define their nonredundant physiological roles and for analyzing the potential impact of drug-metabolite interactions.

Keywords: SLC22A6; SLC22A8; cheminformatics; kidney; machine-learning; metabolomics; mouse; multidrug transporter; organic anion transporter; transporter.


Conflict of interest statement

R. A. is a founder of Molsoft LLC. The terms of this arrangement have been reviewed and approved by the University of California, San Diego, in accordance with its conflict of interest policies

Figures

Figure 1.
Figure 1.
Schematic of workflow for “logical” identification of molecular properties for discrimination of unique OAT1 and OAT3 metabolites. A, OAs ultimately excreted by the kidney are cleared from the blood by the SLC transporters, OAT1 and OAT3, located in the basolateral membranes of proximal tubule cells of the kidney. Deletion of either of these transporters results in the plasma accumulation of OAs. Serum, obtained from WT and OatKOs, was subjected to untargeted, global LC-MS metabolomics analyses. B, resulting metabolomics data were used to identify Oat1 and Oat3 metabolites uniquely accumulating in each knockout mouse. Cheminformatics methods were used to identify over 60 molecular properties/features of the metabolites. C, data visualization and statistical analysis in Orange and Python libraries (Pandas, Matplotlib, Seaborn, and SQLAlchemy) of over 60 molecular properties for Oat1 and Oat3 unique metabolites were used to logically narrow down to a set of seven molecular properties to be used for machine-learning approaches to identify a set of features that classifies metabolites as uniquely Oat1 or uniquely Oat3.
Figure 2.
Figure 2.
Unique metabolites for the Oat1KO and Oat3KO. Volcano plots displaying metabolomics data derived from the analysis of the serum obtained from Oat1KO (KO versus WT) (A) and Oat3KO (KO versus WT) (B). The negative logarithm of the p value for each metabolite is plotted against the logarithm to the base 2 of the fold-change (KO versus WT). Each point in the plot represents a metabolite; the red triangles indicate those metabolites accumulating in the serum of the Oat1KO (p ≤0.05; dotted horizontal line), but not the Oat3KO; the green circles indicate metabolites accumulating in the Oat3KO (generally p ≤0.1 (dotted horizontal line) and see under “Experimental procedures”), but not the Oat1KO; the gray crosses indicate those metabolites either unchanged or that show similar changes in both knockout animals. The bar graphs in each volcano plot show the fold-change for the indicated metabolites in either the Oat1KO (red bars) or Oat3KO (green bars).
Figure 3.
Figure 3.
Comparison of unique Oat1 and unique Oat3 molecular properties. A, distribution plot of a number of chirals (OAT1, blue; OAT3, red). B, distribution plot of a number of rings (OAT1, blue; OAT3, red). C, violin plot of complexity. D, violin plot of polar surface area over molecular area. From these plots, one can see that OAT1-unique metabolites are generally smaller molecules with less complexity and fewer chiral centers and less ringed structures, whereas the OAT3-unique metabolites generally are larger and more complex molecules with more chiral centers and more ringed structures. See Table S1 for the full list of metabolites and Table S2 for the full list of molecular properties.
Figure 4.
Figure 4.
Ranking of molecular properties according to information gain and other metrics indicate their likely high importance. A, bar graph of the ranking of molecular properties according to information gain in order to tease out importance of some molecular properties. The information gain for each molecular feature was normalized to the feature displaying the greatest gain (nof_Rings). B, principal component analysis reveals that first three components account for ∼90% of the variance. C, FreeViz visualization of various molecular properties and their importance in separating out OAT1 versus OAT3. In the FreeViz graphical representation, the magnitude of each vector indicates the relative importance of each molecular feature as determined by the FreeViz algorithm, whereas the direction of each vector indicates the relative preference of that feature for OAT1 (blue background) or OAT3 (red background). In the representation, the blue circles depict the OAT1-unique metabolites, and the red crosses depict the OAT3-unique metabolites. The size of each symbol corresponds to the number of rings. For example, the large red crosses in the upper right-hand portion of the representation are OAT3-unique metabolites that have a large number of rings.
Figure 5.
Figure 5.
Schematic of workflow for machine-learning analyses of molecular properties to classify unique OAT1 versus OAT3 metabolites. A, machine learning in Orange and Python SciKit-Learn library using seven chosen molecular properties (features) ultimately focusing on random forests and decision trees. Analysis of accuracy score, AUC, confusion matrix, misclassified instances, and outliers was performed. B, brute force approach was used in parallel to identify seven molecular properties using Python SciKit-Learn library.
Figure 6.
Figure 6.
Example of a decision tree using the seven chosen molecular properties to classify unique OAT1 versus unique OAT3 metabolites. An example of a decision tree generated using the seven molecular features used to classify the metabolites.
Figure 7.
Figure 7.
Importance of phase I and phase II modifications by drug-metabolizing enzymes as molecular properties. Bar graph showing various DME modifications ranked according to information gain (normalized to the DME modification displaying the greatest information gain (nof_OH)). The number of hydroxyls (nof_OH) and number of sulfates (nof_SO3H) are clearly the two highest-ranked attributes contributing to the classification.
Figure 8.
Figure 8.
Brute force random forest analysis. Bar graph shows the CA for a random forest classification using a brute-force approach. The CA is shown for each of the top 10 instances for each combination of seven molecular features in the brute-force approach. The bottom bar (red) shows the CA for the set of logically identified seven molecular features used in the machine-learning approach described in the text. These seven molecular features are also highlighted in each of the 10 sets (red text) to indicate their presence in the various combinations of molecular features showing the greatest classification accuracy.
Figure 9.
Figure 9.
Prediction of unique OAT1 and OAT3 drugs. A, ability of a strong machine-learning model for classification of unique Oat1 and unique Oat3 metabolites to predict unique Oat1 and unique Oat3 small molecule drugs was analyzed. B–D, seven molecular features that were found to perform well in the classification of metabolites as either OAT1-unique or OAT3-unique were tested for their ability to correctly classify drugs known to interact with either OAT1 or OAT3 with reasonable specificity in random forest and decision tree approaches. Random forest (B) and decision tree (C) classification models were used to predict OAT1 and OAT3 drugs with ≥5-fold (B and C) or ≤2-fold (D) preferential affinities for OAT1 or OAT3. Consideration of drugs with a ≥5-fold preferential affinity for either OAT1 or OAT3 resulted in predictions of the unique metabolite-based random forest or decision tree models with ≥75% accuracy for unique OAT1 and OAT3 drugs, whereas ≤2-fold preferential affinity had around 50% accuracy.

Similar articles

Cited by

References

    1. Lopez-Nieto C. E., You G., Bush K. T., Barros E. J., Beier D. R., and Nigam S. K. (1997) Molecular cloning and characterization of NKT, a gene product related to the organic cation transporter family that is almost exclusively expressed in the kidney. J. Biol. Chem. 272, 6471–6478 10.1074/jbc.272.10.6471 - DOI - PubMed
    1. Brady K. P., Dushkin H., Förnzler D., Koike T., Magner F., Her H., Gullans S., Segre G. V., Green R. M., and Beier D. R. (1999) A novel putative transporter map to the osteosclerosis (oc) mutation and is not expressed in the oc mutant mouse. Genomics 56, 254–261 10.1006/geno.1998.5722 - DOI - PubMed
    1. Emami Riedmaier A., Nies A. T., Schaeffeler E., and Schwab M. (2012) Organic anion transporters and their implications in pharmacotherapy. Pharmacol. Rev. 64, 421–449 10.1124/pr.111.004614 - DOI - PubMed
    1. Morrissey K. M., Stocker S. L., Wittwer M. B., Xu L., and Giacomini K. M. (2013) Renal transporters in drug development. Annu. Rev. Pharmacol. Toxicol. 53, 503–529 10.1146/annurev-pharmtox-011112-140317 - DOI - PubMed
    1. Nigam S. K. (2018) The SLC22 transporter family: a paradigm for the impact of drug transporters on metabolic pathways, signaling, and disease. Annu. Rev. Pharmacol. Toxicol. 58, 663–687 10.1146/annurev-pharmtox-010617-052713 - DOI - PMC - PubMed

Publication types

MeSH terms

Substances