. 2020 Feb 28;94(6):e01813-19.
doi: 10.1128/JVI.01813-19. Print 2020 Feb 28.

Phylogenetics, Genomic Recombination, and NSP2 Polymorphic Patterns of Porcine Reproductive and Respiratory Syndrome Virus in China and the United States in 2014-2018

Affiliations

Phylogenetics, Genomic Recombination, and NSP2 Polymorphic Patterns of Porcine Reproductive and Respiratory Syndrome Virus in China and the United States in 2014-2018

Fang Yu et al. J Virol. .

Abstract

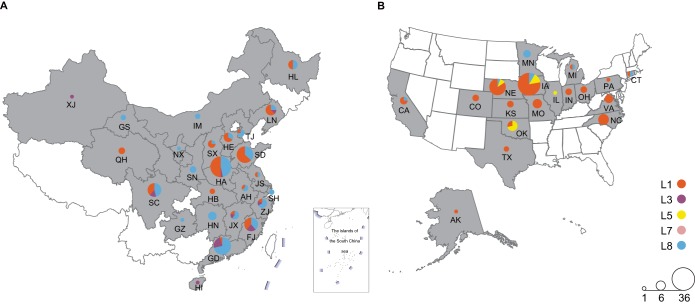
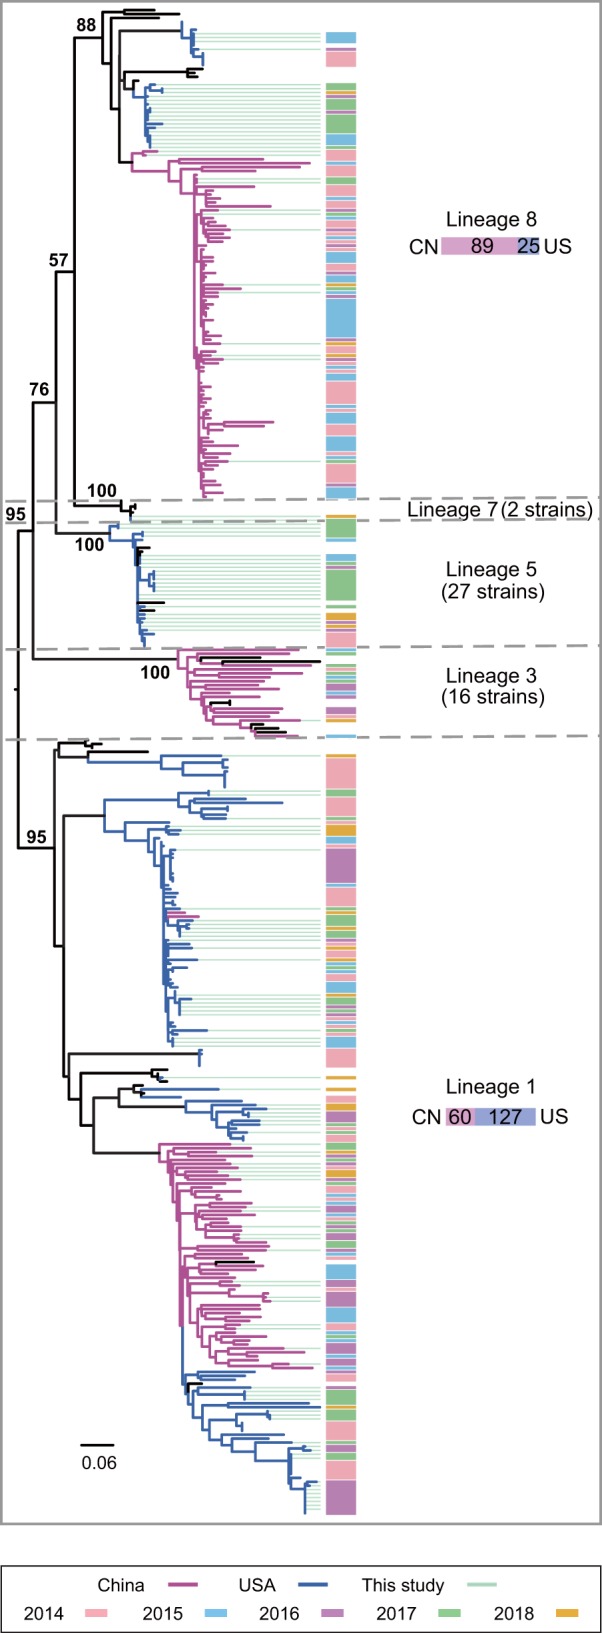
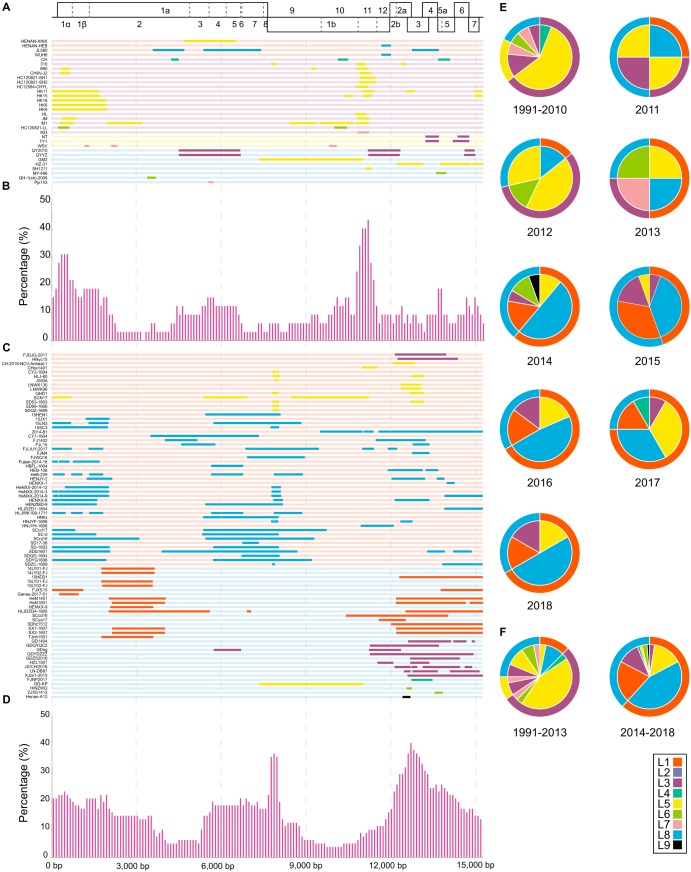
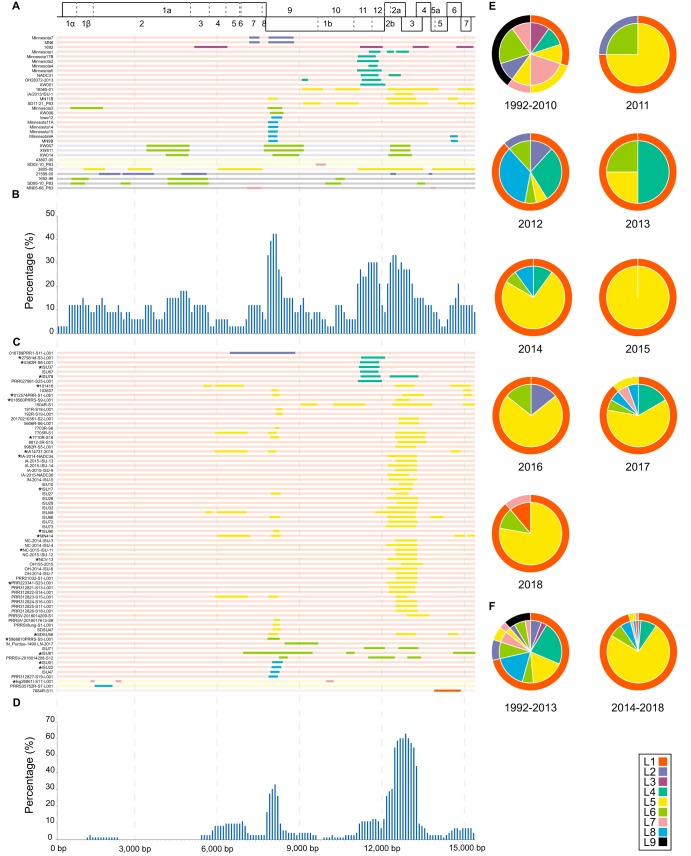
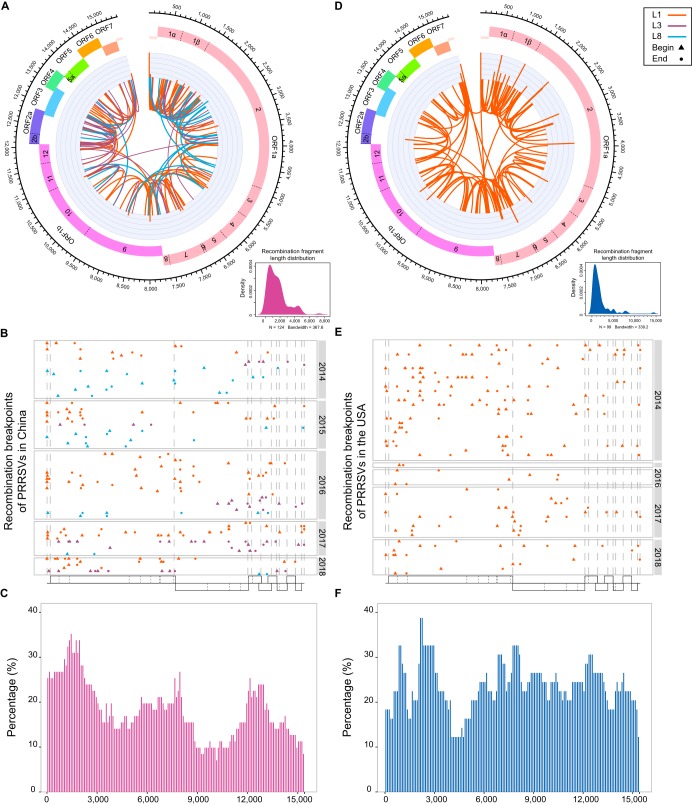
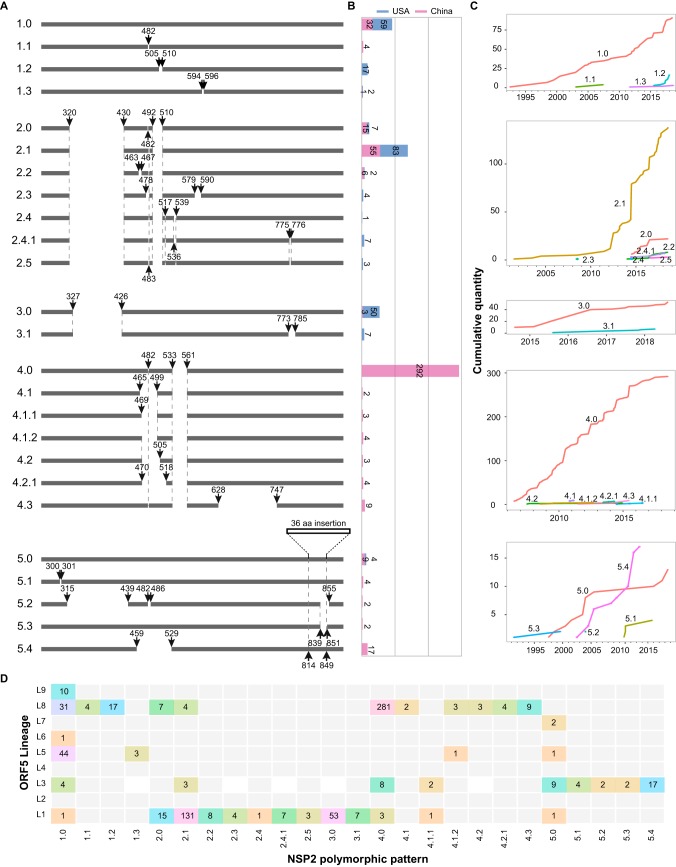
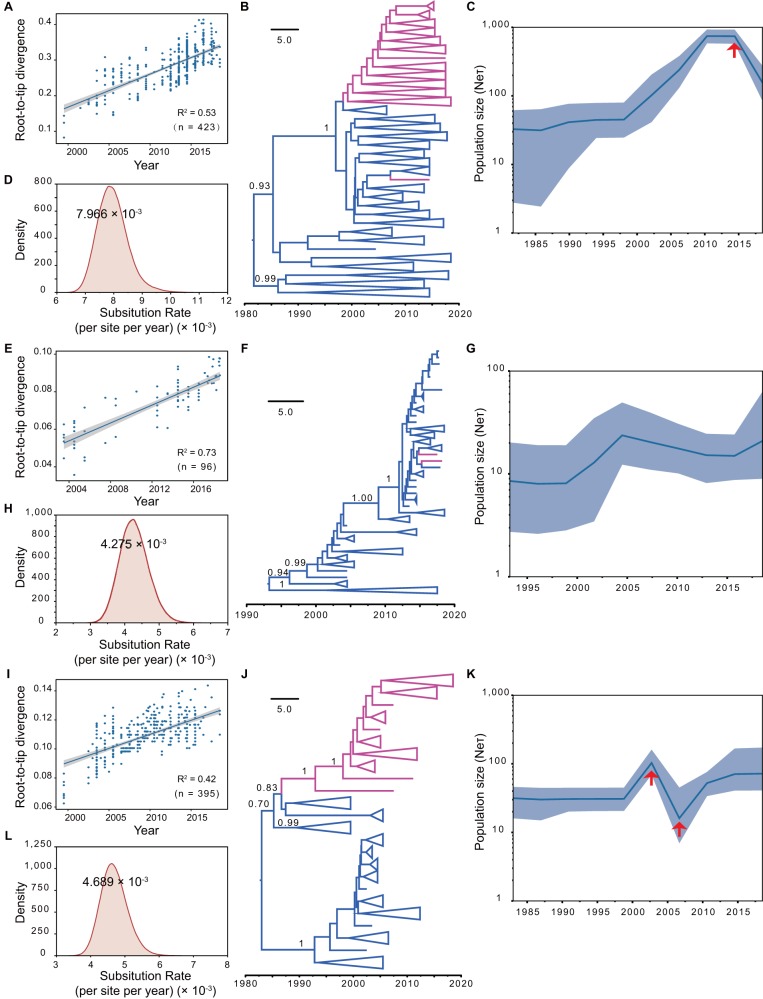
Porcine reproductive and respiratory syndrome virus (PRRSV), an important pathogen that affects the pig industry, is a highly genetically diverse RNA virus. However, the phylogenetic and genomic recombination properties of this virus have not been completely elucidated. In this study, comparative analyses of all available genomic sequences of North American (NA)-type PRRSVs (n = 355, including 138 PRRSV genomes sequenced in this study) in China and the United States during 2014-2018 revealed a high frequency of interlineage recombination hot spots in nonstructural protein 9 (NSP9) and the GP2 to GP3 regions. Lineage 1 (L1) PRRSV was found to be susceptible to recombination among PRRSVs both in China and the United States. The recombinant major parent between the 1991-2013 data and the 2014-2018 data showed a trend from complex to simple. The major recombination pattern changed from an L8 to L1 backbone during 2014-2018 for Chinese PRRSVs, whereas L1 was always the major backbone for US PRRSVs. Intralineage recombination hot spots were not as concentrated as interlineage recombination hot spots. In the two main clades with differential diversity in L1, NADC30-like PRRSVs are undergoing a decrease in population genetic diversity, NADC34-like PRRSVs have been relatively stable in population genetic diversity for years. Systematic analyses of insertion and deletion (indel) polymorphisms of NSP2 divided PRRSVs into 25 patterns, which could generate novel references for the classification of PRRSVs. The results of this study contribute to a deeper understanding of the recombination of PRRSVs and indicate the need for coordinated epidemiological investigations among countries.IMPORTANCE Porcine reproductive and respiratory syndrome (PRRS) is one of the most significant swine diseases. However, the phylogenetic and genomic recombination properties of the PRRS virus (PRRSV) have not been completely elucidated. In this study, we systematically compared differences in the lineage distribution, recombination, NSP2 polymorphisms, and evolutionary dynamics between North American (NA)-type PRRSVs in China and in the United States. Strikingly, we found high frequency of interlineage recombination hot spots in nonstructural protein 9 (NSP9) and in the GP2 to GP3 region. Also, intralineage recombination hot spots were scattered across the genome between Chinese and US strains. Furthermore, we proposed novel methods based on NSP2 indel patterns for the classification of PRRSVs. Evolutionary dynamics analysis revealed that NADC30-like PRRSVs are undergoing a decrease in population genetic diversity, suggesting that a dominant population may occur and cause an outbreak. Our findings offer important insights into the recombination of PRRSVs and suggest the need for coordinated international epidemiological investigations.

Keywords: deletion; interlineage; porcine reproductive and respiratory syndrome virus; recombination hotspots.


Figures

FIG 1
FIG 1
Geographical distribution of NA-type PRRSVs in China (A) and the United States (B). The different colors indicate the different lineages, and the sizes of the circles represent the numbers of PRRSVs. The number of strains of each lineage was counted, and their relative proportions are illustrated by pie charts in each province/state. Information for 25 provinces of China and 18 states of the United States are presented as follows. AH, Anhui (n = 3); FJ, Fujian (n = 13); GS, Gansu (n = 2); GD, Guangdong (n = 21); GZ, Guizhou (n = 1); HI, Hainan (n = 1); HE, Hebei (n = 6); HL, Heilongjiang (n = 6); HA, Henan (n = 30); HB, Hubei (n = 2); HN, Hunan (n = 5); IM, Inner Mongolia (n = 2); JS, Jiangsu (n =2); JX, Jiangxi (n = 6); LN, Liaoning (n = 7); NX, Ningxia (n = 1); QH, Qinghai (n = 3); SN, Shaanxi (n = 3); SD, Shandong (n = 19); SH, Shanghai (n = 2); SX, Shanxi (n = 4); SC, Sichuan (n = 13); TJ, Tianjin (n = 4); XJ, Xinjiang (n = 1); ZJ, Zhejiang (n = 5); AR, Arkansas (n = 1); CA, California (n = 4); CO, Colorado (n = 3); CT, Connecticut (n = 2); IL, Illinois (n = 1); ID, Indiana (n = 3); IA, Iowa (n = 36); KS, Kansas (n = 3); MI, Michigan (n = 2); MN, Minnesota (n = 4); MO, Missouri (n = 6); NE, Nebraska (n = 19); NC, North Carolina (n = 8); OH, Ohio (n = 3); OK, Oklahoma (n = 7); PA, Pennsylvania (n = 1); TX, Texas (n = 2); VA, Virginia (n = 5).
FIG 2
FIG 2
Phylogenetic tree based on ORF5 of PRRSVs. The branches in purple represent the Chinese strains and those in blue represent strains from the United States. Green lines behind the tree denote viruses sequenced in this study. The time of strain isolation is shown in different colored bars, as indicated in the legend.
FIG 3
FIG 3
Maps of parental lineages of genomes and interlineage recombination patterns in China from 1991 to 2018. (Top) Full-length genome structure, with reference to VR-2332, in which the positions and boundaries of the major ORFs and NSPs within ORF1a and ORF1b are shown. Gray vertical dashed lines spaced 3,000 bp apart were used to locate the recombination breakpoint positions and the x axis positions of the histograms. The different colors depict different PRRSVs lineages. (A) A map of parental lineages of genomes from 1991 to 2013. The name of each strain is displayed on the left, and the corresponding full-length genome of the major parent is displayed in different lineage colors on the right. The change in color of the major parent means that the fragment had been replaced by a minor parent, indicating the presence of a recombinant. (B) The proportions of recombinant genomes identified with minor parent sequences in China from 1991 to 2013. The x axis represents the PRRSV genome position, and the y axis represents the number of recombinations that occurred at a specific site in proportion to the total number of recombinants in a sliding window (per 100 nucleotide bases) centered on that position in the x axis. (C) A map of parental lineages of genomes from 2014 to 2018. (D) The proportions of recombinant genomes identified with minor parent sequences in China during 2014–2018. (E) Major and minor parental strain contributors in recombinants observed during various time periods in 1991–2018. The major parent is shown on the outer ring, and the corresponding minor parent is shown in the pie chart. (F) Major and minor parental strain contributors in recombinants observed between 1991–2013 and 2014–2018.
FIG 4
FIG 4
Maps of parental lineages of genomes and interlineage recombination patterns in the United States from 1992 to 2018. (Top) Full-length genome structure, with reference to VR-2332, in which the positions and boundaries of the major ORFs and NSPs within ORF1a and ORF1b are shown. Gray vertical dashed lines spaced 3,000 bp apart were used to locate the recombination breakpoint positions and the x axis positions of the histograms. The different colors depict different PRRSV lineages. (A) A map of parental lineages of genomes from 1992 to 2013. The name of each strain is displayed on the left, and the corresponding full-length genome of the major parent is displayed in different lineage colors on the right. The change in color of the major parent means that the fragment had been replaced by a minor parent, indicating the presence of a recombinant. (B) The proportions of recombinant genomes identified with minor parent sequences in the United States from 1992 to 2013. The x axis represents the PRRSV genome position, and the y axis represents the number of recombinations that occurred at a specific site in proportion to the total number of recombinants in a sliding window (per 100 nucleotide bases) centered on that position in the x axis. (C) A map of parental lineages of genomes from 2014 to 2018. The following groups were considered the same recombination events, and only the earliest strain of each group after exclusion of the same recombination events is displayed with an asterisk: 1, 27981kf-S3-L001 and PRR027982-S26-L001; 2, 5382R-S6-L001, 5381R-S5-L001, and 5383R-S7-L001; 3, ISU37, ISU39, and ISU40; 4, ISU78, ISU94, ISU95, ISU96, and ISU97; 5, 101416, 109560, and 21675; 6, 012574PRR-S1-L001 and 012574VI-S2-L001; 7, 018560PRRS-S9-L001, 018561PRRS-S10-L001, 1923R-S1-L001, 1924R-S2-L001, and 9337R-S4-L001; 8, 7710R-S18, 0752R-S4, and 7498-S10; 9, IA14737-2016, 014737Fib-S5-L001, 014737lu1A-S1-L001, 014737lu2A-S2-L001, 014737luB-S3-L001, 014737luC-S4-L001, 014737Ton-S6-L001, br42321BC-S13-L001, and PRR41505-S4-L001; 10, IA-2014-NADC34, IA-2014-ISU-8, IA-2015-ISU-10, and IA-2015-NADC35; 11, ISU17 and ISU18; 12, ISU90 and ISU91; 13, MN414, PRR027983-S27-L001, and PRR027984-S28-L001; 14, NC-2015-ISU-11 and 2385R-S13; 15, NCV-13, brian27950-S16-L001, NCV-16, NCV-17, NCV-21, NCV-23, NCV-24, NCV-25, and NCV-26; 16, PRR223341-S23-L001 and PRR223343-S24-L001; 17, SDSU58 and SDSU62; 18, 5988810PRRS-S5-L001 and 52335PRRS-S10-L001; 19, ISU81, ISU82, ISU84, ISU86, and ISU87; 20, ISU01, ISU04, ISU05, ISU06, and ISU07; 21, ISU22, ISU23, ISU24, and ISU25; 22, Ing26861I-S17-L001 and Ing26862I-S18-L001. (D) The proportions of recombinant genomes identified with minor parent sequences in the United States from 2014 to 2018. (E) Major and minor parental strain contributors in recombinants observed during various time periods in 1992–2018. The major parent is shown on the outer ring, and the corresponding minor parent is shown in the pie chart. (F) Major and minor parental strain contributors in recombinants observed between 1992–2013 and 2014–2018.
FIG 5
FIG 5
Comparison of intralineage recombination between China and the United States in 2014–2018. Different lineages are shown in different colors, consistent with the previous description. The genome positions represent positions in the full-length genome alignment related to the VR-2332 strain. (A to C) Intralineage recombinations of Chinese PRRSVs. (D to F) Intralineage recombinations of PRRSVs in the United States. (A and D) Overview of intralineage recombinations. Linkages represent recombination events, connecting the beginning and the ending position of each event; histograms represent recombination breakpoints that occurred more than once; the density map in the lower right corner represents the size distribution of the recombinant fragment. (B and E) Breakpoint distributions of intralineage recombinations in each year. Each box represents a different year; breakpoints on each horizontal line originate from one recombinant, and recombination breakpoints are shown as different shapes, with the starting position as a triangle and the ending position as a dot. The vertical dotted lines in the dot diagrams represent the starting and ending positions of ORFs, which correspond to the genome bar charts below. (C and F) Bar charts showing the proportions of recombinant genomes identified with minor parent sequences in China and in the United States from 2014 to 2018. The x axis represents the PRRSV genome position, and the y axis represents the number of recombinations that occurred at a specific site in proportion to the total number of recombinants in a sliding window (per 100 nucleotide bases) centered on that position in the x axis.
FIG 6
FIG 6
Insertion and deletion patterns of NSP2 in PRRSV. (A) Systematic classification of NSP2 polymorphic patterns. There are 5 large patterns and 25 subdivided groups, and the location of each NSP2 indel pattern is marked. The positions marked in the figure represent positions of the NSP2 amino acid sequence and refer to the position of VR-2332. (B) Strain numbers of each pattern and comparison between China and the United States. Bars in blue represent the numbers of US strains, and the bars in red represent the numbers of Chinese strains. (C) Cumulative curve of each pattern over time. The x axis represents the year, the y axis represents the total number of strains up to that year, and each pattern is shown in a different color and marked on the graph. (D) Relationship between ORF5 lineage and NSP2 polymorphic pattern. The horizontal axis shows the 25 polymorphic patterns of NSP2 defined in panel A, the vertical axis shows the 9 phylogenetic lineages of ORF5 described by Shi et al. (11), and the numbers in the heat map identify the numbers of strains.
FIG 7
FIG 7
Bayesian spatiotemporal speculation of linage 1 and lineage 8 PRRSVs. (A to D) BEAST analysis of NADC30-like PRRSVs. (E to H) BEAST analysis of NADC34-like PRRSVs. (I to L) BEAST analysis of lineage 8. (A, E, and I) Root-to-tip correlations of time sequences of ORF5. (B, F, and J) The time-resolved trees of each lineage. Red branches represent Chinese strains and blue branches show strains from the United States. (C, G, and K) Bayesian skyline population dynamic analysis. The red arrows indicate the point at which the size and genetic diversity of the population changed significantly. (D, H, and L) BEAST calculations of nucleotide substitution rates.

Similar articles

Cited by

References

    1. Collins JE, Benfield DA, Christianson WT, Harris L, Hennings JC, Shaw DP, Goyal SM, McCullough S, Morrison RB, Joo HS. 1992. Isolation of swine infertility and respiratory syndrome virus (isolate ATCC VR-2332) in North America and experimental reproduction of the disease in gnotobiotic pigs. J Vet Diagn Invest 4:117–126. doi:10.1177/104063879200400201. - DOI - PubMed
    1. Neumann EJ, Kliebenstein JB, Johnson CD, Mabry JW, Bush EJ, Seitzinger AH, Green AL, Zimmerman JJ. 2005. Assessment of the economic impact of porcine reproductive and respiratory syndrome on swine production in the United States. J Am Vet Med Assoc 227:385–392. doi:10.2460/javma.2005.227.385. - DOI - PubMed
    1. Tian K, Yu X, Zhao T, Feng Y, Cao Z, Wang C, Hu Y, Chen X, Hu D, Tian X, Liu D, Zhang S, Deng X, Ding Y, Yang L, Zhang Y, Xiao H, Qiao M, Wang B, Hou L, Wang X, Yang X, Kang L, Sun M, Jin P, Wang S, Kitamura Y, Yan J, Gao GF. 2007. Emergence of fatal PRRSV variants: unparalleled outbreaks of atypical PRRS in China and molecular dissection of the unique hallmark. PLoS One 2:e526. doi:10.1371/journal.pone.0000526. - DOI - PMC - PubMed
    1. Johnson CR, Griggs TF, Gnanandarajah J, Murtaugh MP. 2011. Novel structural protein in porcine reproductive and respiratory syndrome virus encoded by an alternative ORF5 present in all arteriviruses. J Gen Virol 92:1107–1116. doi:10.1099/vir.0.030213-0. - DOI - PMC - PubMed
    1. Snijder EJ, van Tol H, Roos N, Pedersen KW. 2001. Non-structural proteins 2 and 3 interact to modify host cell membranes during the formation of the arterivirus replication complex. J Gen Virol 82:985–994. doi:10.1099/0022-1317-82-5-985. - DOI - PubMed

Publication types

MeSH terms

LinkOut - more resources