. 2020 Feb 12;40(7):1453-1482.
doi: 10.1523/JNEUROSCI.0993-19.2019. Epub 2020 Jan 2.

Microglia Actively Remodel Adult Hippocampal Neurogenesis through the Phagocytosis Secretome

Affiliations

Microglia Actively Remodel Adult Hippocampal Neurogenesis through the Phagocytosis Secretome

Irune Diaz-Aparicio et al. J Neurosci. .

Abstract

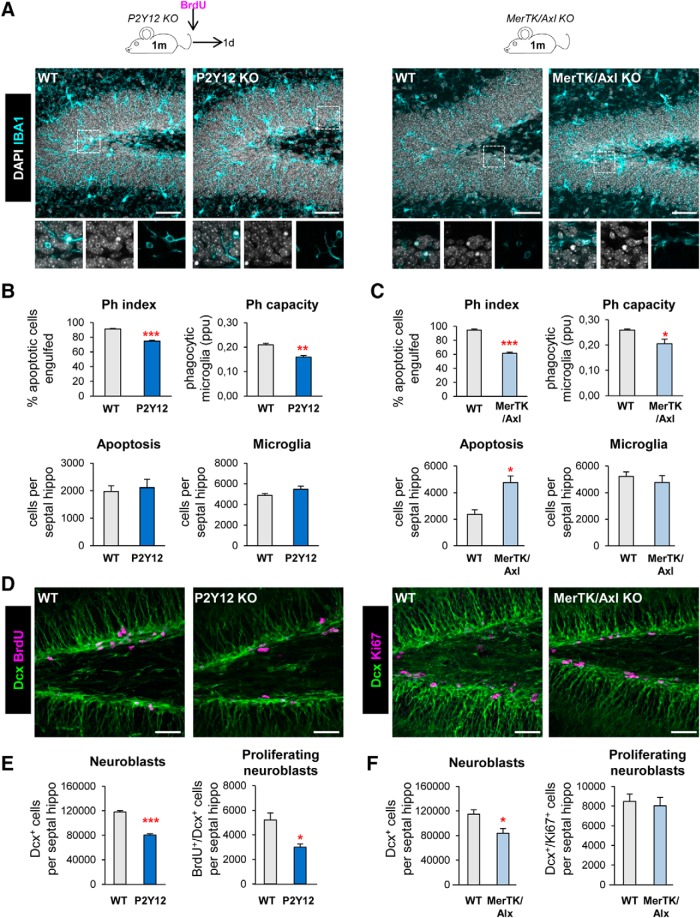
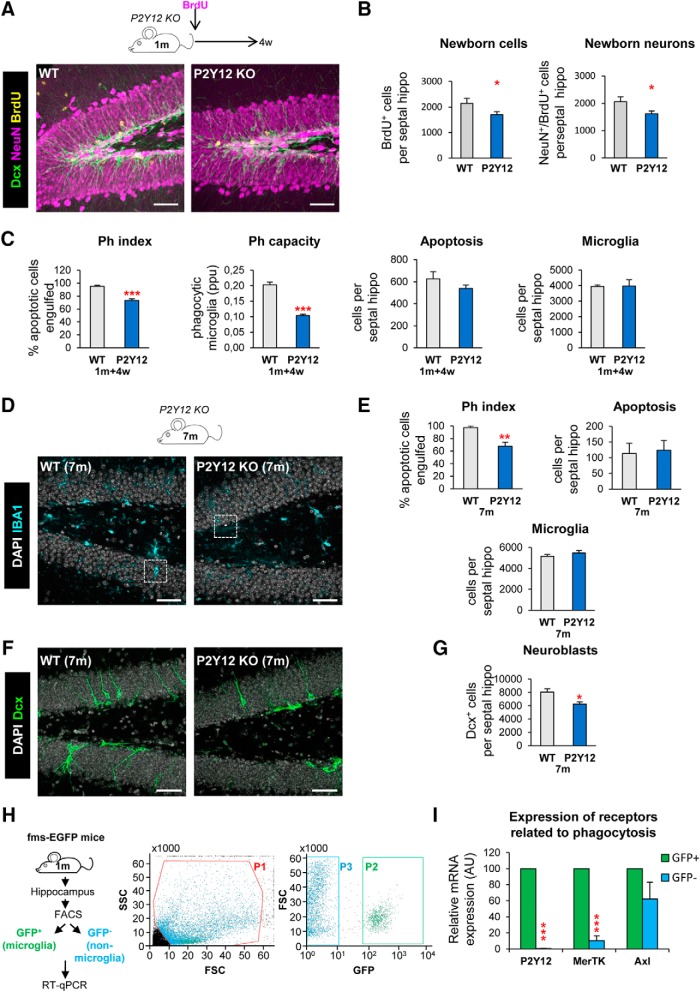
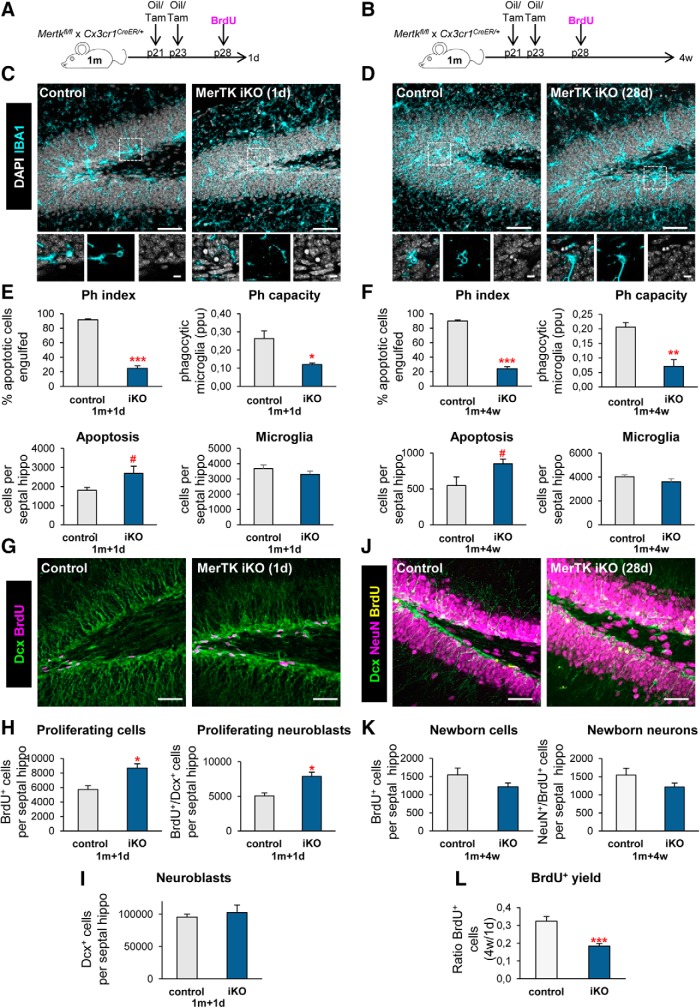
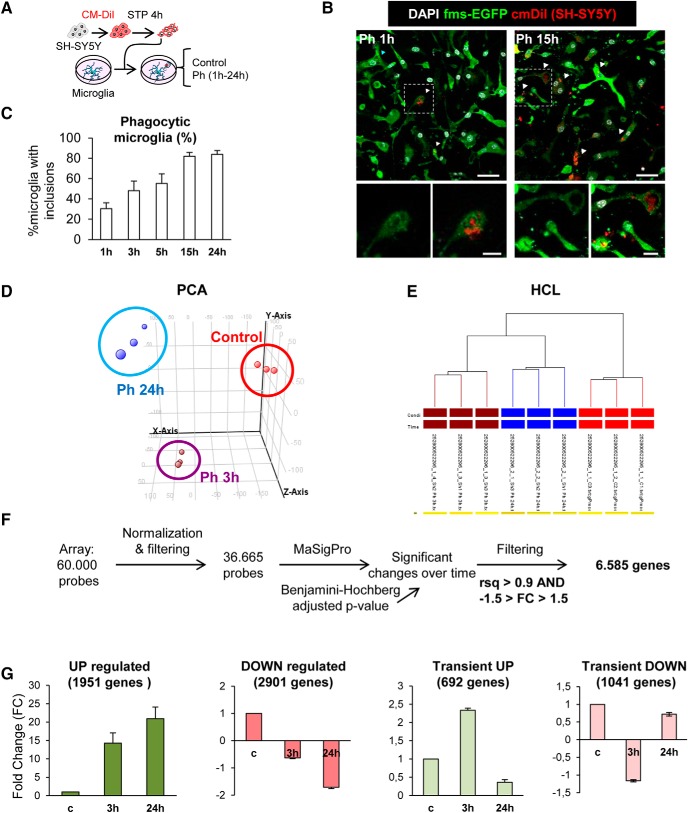
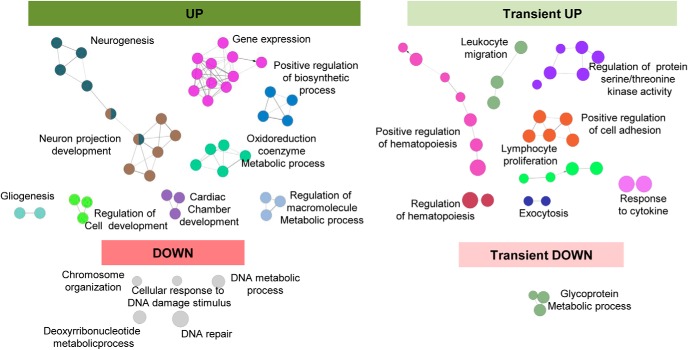
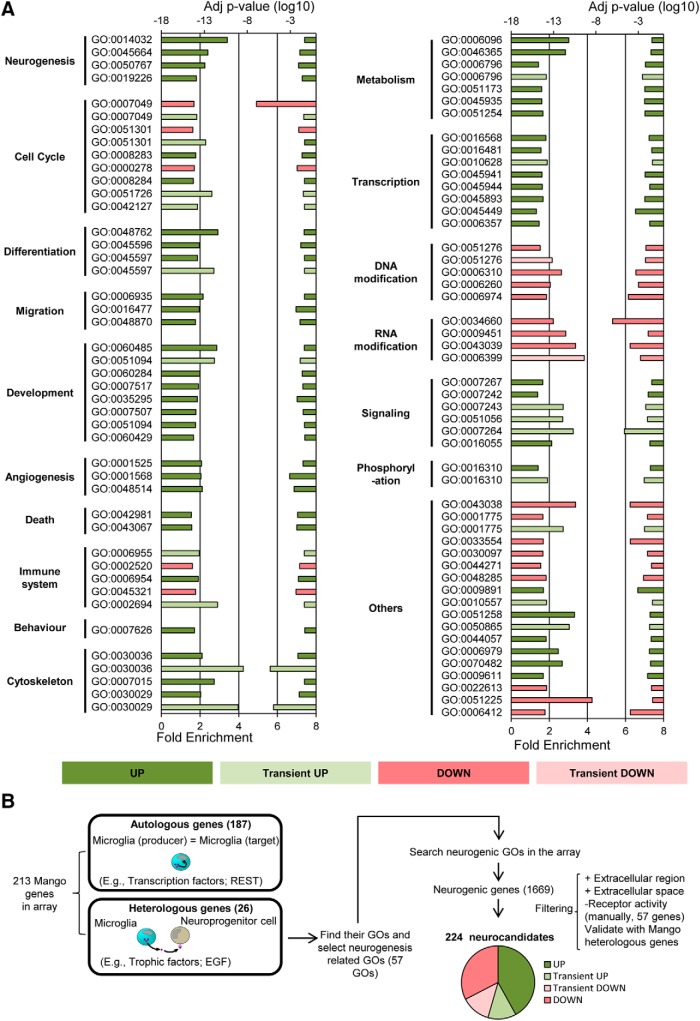
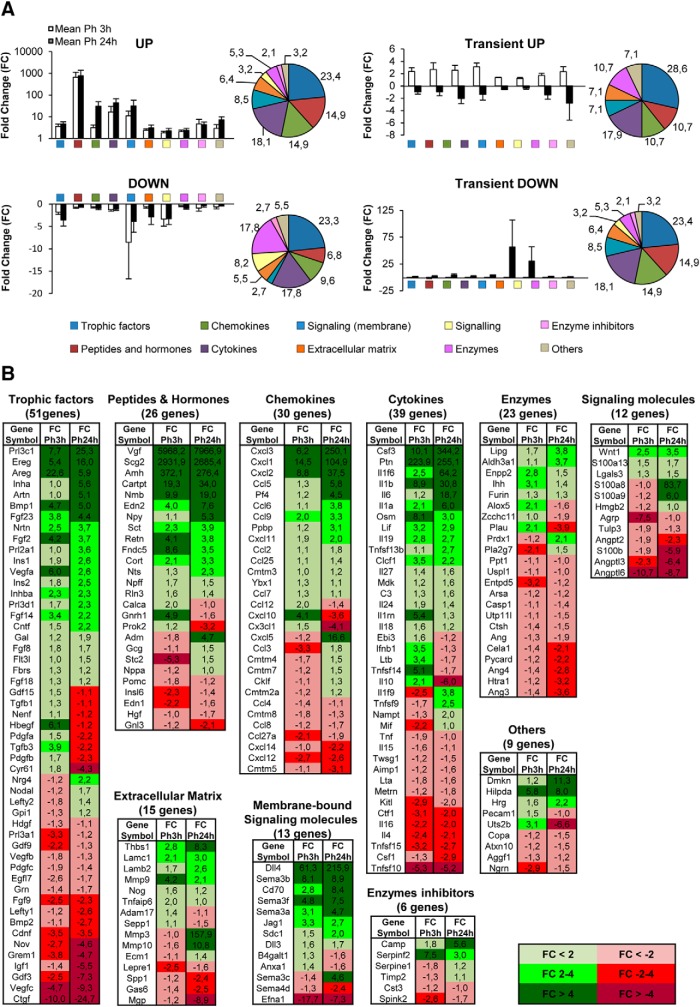
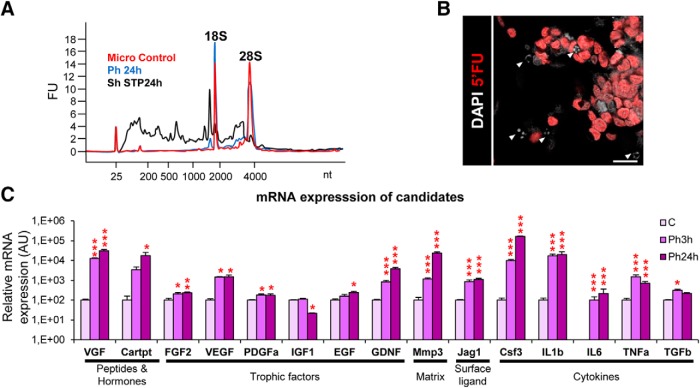
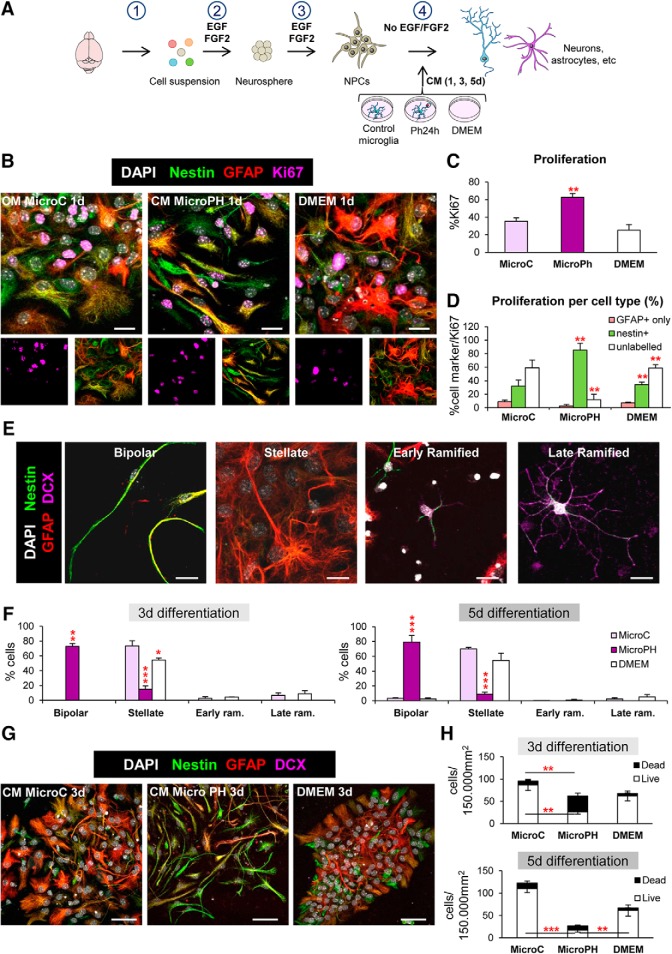
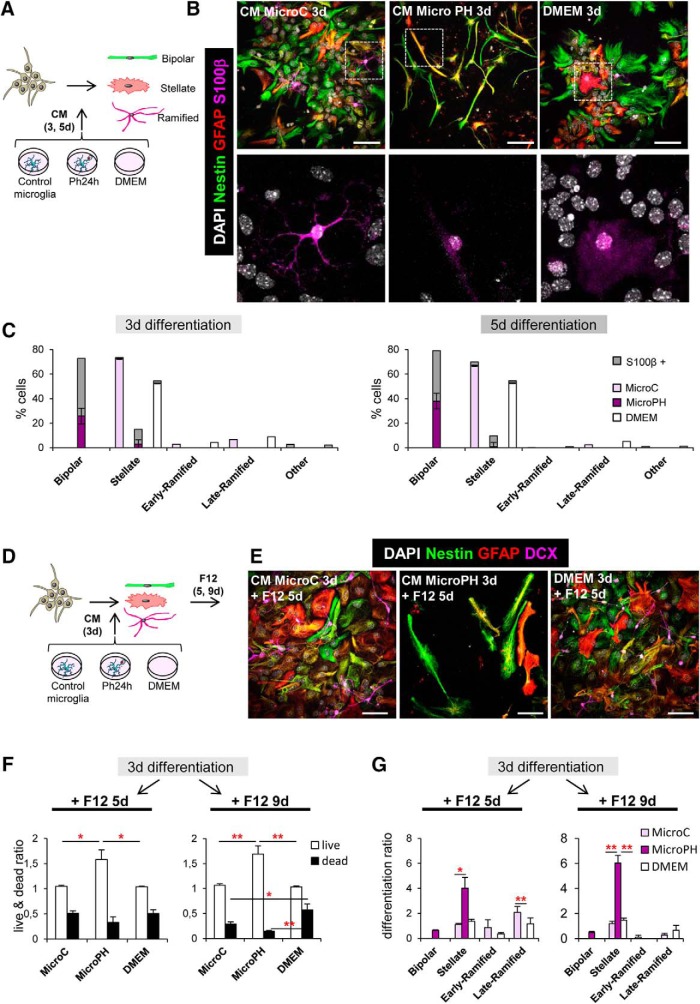
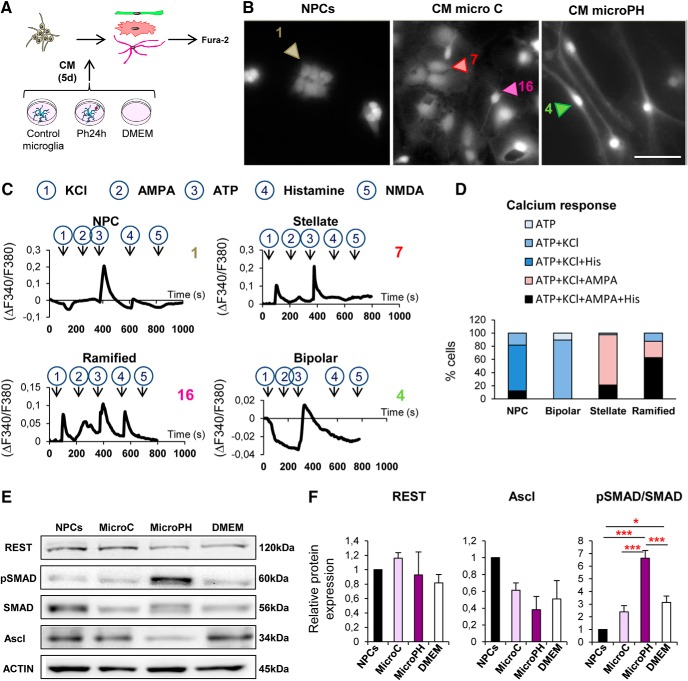
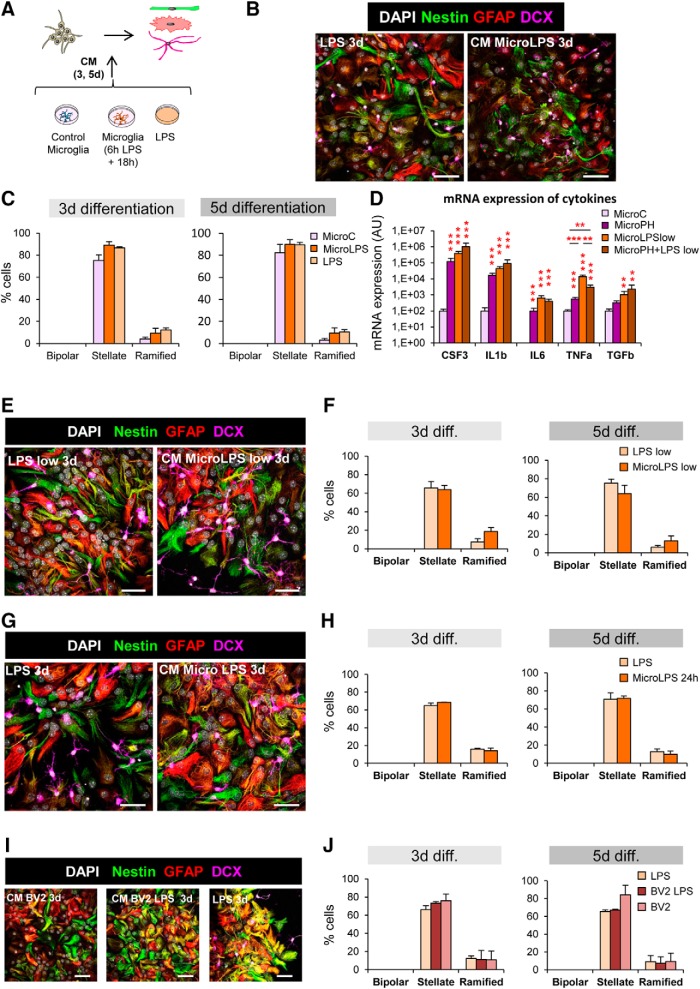
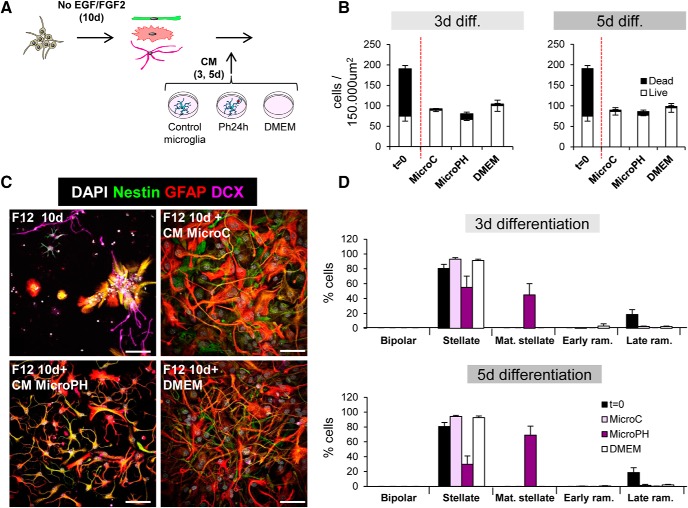
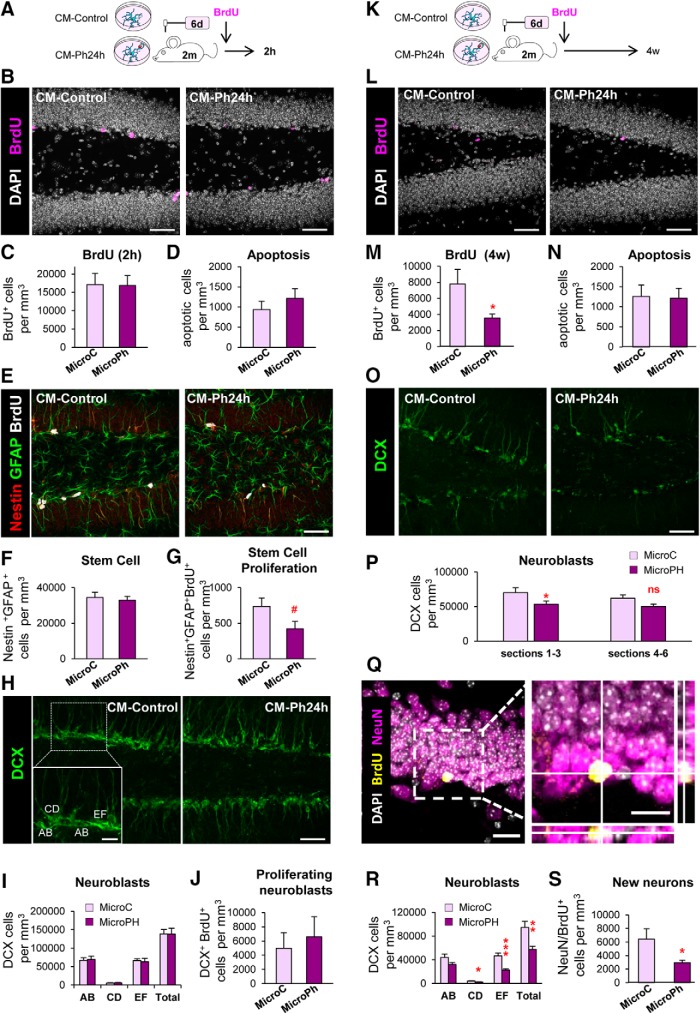
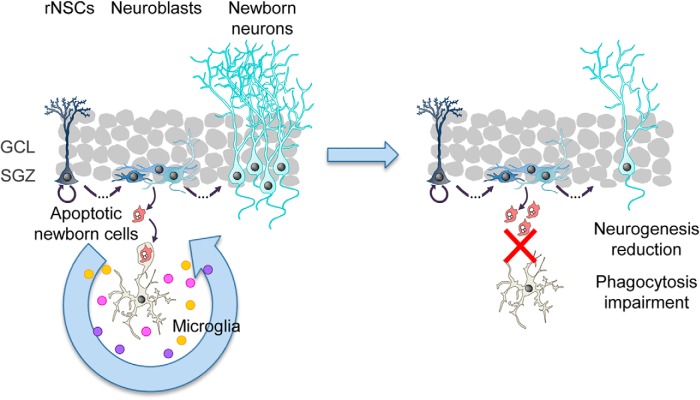
During adult hippocampal neurogenesis, most newborn cells undergo apoptosis and are rapidly phagocytosed by resident microglia to prevent the spillover of intracellular contents. Here, we propose that phagocytosis is not merely passive corpse removal but has an active role in maintaining neurogenesis. First, we found that neurogenesis was disrupted in male and female mice chronically deficient for two phagocytosis pathways: the purinergic receptor P2Y12, and the tyrosine kinases of the TAM family Mer tyrosine kinase (MerTK)/Axl. In contrast, neurogenesis was transiently increased in mice in which MerTK expression was conditionally downregulated. Next, we performed a transcriptomic analysis of the changes induced by phagocytosis in microglia in vitro and identified genes involved in metabolism, chromatin remodeling, and neurogenesis-related functions. Finally, we discovered that the secretome of phagocytic microglia limits the production of new neurons both in vivo and in vitro Our data suggest that microglia act as a sensor of local cell death, modulating the balance between proliferation and survival in the neurogenic niche through the phagocytosis secretome, thereby supporting the long-term maintenance of adult hippocampal neurogenesis.SIGNIFICANCE STATEMENT Microglia are the brain professional phagocytes and, in the adult hippocampal neurogenic niche, they remove newborn cells naturally undergoing apoptosis. Here we show that phagocytosis of apoptotic cells triggers a coordinated transcriptional program that alters their secretome, limiting neurogenesis both in vivo and in vitro In addition, chronic phagocytosis disruption in mice deficient for receptors P2Y12 and MerTK/Axl reduces adult hippocampal neurogenesis. In contrast, inducible MerTK downregulation transiently increases neurogenesis, suggesting that microglial phagocytosis provides a negative feedback loop that is necessary for the long-term maintenance of adult hippocampal neurogenesis. Therefore, we speculate that the effects of promoting engulfment/degradation of cell debris may go beyond merely removing corpses to actively promoting regeneration in development, aging, and neurodegenerative diseases.

Keywords: MerTK/Axl; P2Y12; adult neurogenesis; microglia; phagocytosis; secretome.


Figures

Figure 1.
Figure 1.
Chronic microglial phagocytosis impairment reduces adult hippocampal neurogenesis. A, Representative maximum projection of confocal z-stack of P2Y12 and MerTK/Axl KO mice immunofluorescence in the mouse hippocampal DG at 1 month (1 m). Microglia were labeled with Iba1 (cyan) and apoptotic nuclei were detected by pyknosis/karyorrhexis (white, DAPI). B, C, Percentage of apoptotic cells engulfed (Ph index), weighted average of the percentage of microglia with phagocytic pouches (Ph capacity), apoptotic cells and microglia per septal hippocampus in P2Y12 KO mice (B) and MerTK/Axl KO mice (C). D, Representative confocal z-stack of P2Y12 and MerTK/Axl KO mice immunofluorescence in the mouse hippocampal DG at 1 m. Neuroblasts were labeled with DCX (green) and proliferation was labeled with either BrdU (150 mg/kg, 24 h) or Ki67 (magenta). E, Neuroblast and neuroblast proliferation in 1-month-old P2Y12 KO mice. F, Neuroblast and neuroblast proliferation in 1-month-old MerTK/Axl KO mice. Scale bars: A, D, 50 μm (inserts, 10 μm); A, left, z = 20 μm; A, right, z = 17 μm; D, left, z = 7 μm; D, right, z = 10 μm. N = 3–4 mice (B, C, E, F). Error bars represent mean ± SEM. *p < 0.05, **p < 0.01, ***p < 0.001 by Student's t test. Only significant effects are shown. Values of statistics used are shown in Table 2.
Figure 2.
Figure 2.
Chronic microglial phagocytosis impairment reduces adult hippocampal neurogenesis in the long term. A, Representative confocal z-stack of P2Y12 KO mice immunofluorescence in the mouse hippocampal DG at 2 months. Neuroblasts were labeled with DCX (green), neurons were labeled with NeuN (magenta) and proliferation was labeled with BrdU (yellow; 4 weeks after BrdU injection). B, New cells and new neurons (NeuN+, BrdU+) in 2-month-old P2Y12 KO mice, 4 weeks after the BrdU injection. C, Percentage of apoptotic cells engulfed (Ph index), weighted average of the percentage of microglia with phagocytic pouches (Ph capacity), apoptotic cells and microglia per septal hippocampus in P2Y12 KO mice 4 weeks after BrdU injection (2m). D, Representative maximum projection of confocal z-stack of P2Y12 KO mice immunofluorescence in the mouse hippocampal DG at 7 months (7 m). Microglia were labeled with Iba1 (cyan) and apoptotic nuclei were detected by pyknosis/karyorrhexis (white, DAPI). E, Percentage of apoptotic cells engulfed (Ph index), number of apoptotic cells and microglia per septal hippocampus in 7-month-old P2Y12 KO mice. F, Representative confocal z-stack of P2Y12 KO mice immunofluorescence in the mouse hippocampal DG at 7 months. Neuroblasts were labeled with DCX (green). G, Number of neuroblasts per septal hippocampus in 7-month-old P2Y12 KO mice. H, Experimental design used to isolate microglia (GFP+) versus non-microglial cells (GFP) from 1-month-old fms-EGFP mice using flow cytometry. First, debris was excluded using the P1 gate in FSC versus SSC (left). Next, gates for GFP+ microglia cells (P2) and GFP non-microglial cells (P3) were defined based on the distribution of the fms-EGFP+ cells in EGFP versus FSC (right). I, Expression of P2Y12, MerTK, and Axl in microglia (GFP+) versus non-microglial cells (GFP) by real-time qPCR in FACS-sorted cells from fms-EGFP mice hippocampi. OAZ1 (ornithine decarboxylase antizyme 1) was selected as a reference gene. Scale bars: A, D, F, 50 μm; A, z = 20 μm; D, F, z = 17.5 μm. N = 5 mice (A). N = 4–6 mice (E, G), N = 3 independent experiments (H; each from 8 pooled hippocampi), *p < 0.05, **p < 0.01, ***p < 0.001 by Student's t test. Values of statistics used are shown in Table 2.
Figure 3.
Figure 3.
Acute microglial phagocytosis impairment transiently increases adult hippocampal neurogenesis. A, B, Experimental design in microglial-specific MerTK inducible KO mice, generated by crossing Mertkfl/fl and Cx3cr1CreER mice treated with tamoxifen (iKO) or corn oil (control) at P21 and P23 and injected with BrdU at p28 (100 mg/kg). Mice were killed at 1 d (A) or 4 weeks (B) after the BrdU injection. C, D, Representative maximum projection of confocal z-stack of MerTK iKO mice immunofluorescence in the mouse hippocampal DG at 1 d (C) and 4 weeks (D). Microglia were labeled with Iba1 (cyan) and apoptotic nuclei were detected by pyknosis/karyorrhexis (white, DAPI). E, F, Percentage of apoptotic cells engulfed (Ph index), weighted average of the percentage of microglia with phagocytic pouches (Ph capacity), apoptotic cells and microglia per septal hippocampus in MerTK iKO mice at 1 d (E) and 4 weeks (F). G, Representative confocal z-stack of MerTK iKO mice immunofluorescence in the mouse hippocampal DG at 1 d. Neuroblasts were labeled with DCX (green) and proliferation was detected with BrdU (magenta). H, Newborn cells (BrdU+) and newborn neuroblasts (DCX+, BrdU+) in MerTK iKO mice at 1 d post-BrdU. I, Neuroblasts (DCX+) in MerTK iKO mice at 1 d post-BrdU. J, Representative confocal z-stack of MerTK iKO mice immunofluorescence in the mouse hippocampal DG at 4 weeks post-BrdU. Neuroblasts were labeled with DCX (green), neurons were labeled with NeuN (magenta) and proliferation was labeled with BrdU (yellow). K, Newborn cells (BrdU+) and newborn neurons (NeuN+, BrdU+) in MerTK iKO mice at 4 weeks post-BrdU. L, BrdU+ yield was calculated as a ratio of the BrdU+ cells at 4 weeks over the average BrdU+ cells of each group at 1 d after injection. Scale bars: C, D, G, J, 50 μm (insets, 10 μm); C, D, z = 16.1 μm; G, z = 7 mm; J, z = 23.1 μm. N = 3 mice (E, H, I), N = 4–6 mice (F, K, L). Error bars represent mean ± SEM. #p = 0.096 (E), #p = 0.062 (F), *p < 0.05, **p < 0.01, ***p < 0.001 by Student's t test. Only significant effects are shown. Values of statistics used are shown in Table 3.
Figure 4.
Figure 4.
Phagocytosis assay with a human neural cell line (SH-SY5Y). A, Experimental design of the phagocytosis assay. B, Representative confocal microscopy images of primary microglia (GFP; green) fed with SH-SY5Y, which were previously labeled with CM-DiI (red) and treated with STP (4 h, 3μM) for the induction of apoptosis (pyknosis/karyorrhexis; DAPI, white). Arrowheads, phagocytosed apoptotic SH-SY5Y cells. C, Percentage of microglia with CM-DiI and/or DAPI inclusions along a time course. Only fully closed pouches with particles within were identified as phagocytosis. D, PCA of the different replica of the samples: Control microglia, Ph3h, and Ph24h. E, Hierarchical clustering (HCL) of the different replica of the samples control microglia (blue), Ph3h (brown), and Ph24h (red). F, Representation of the strategy followed to screen genes from the gene array. G, FC mean of the genes classified under the UP, DOWN, transient UP, and transient DOWN regulation patterns. Scale bars: B, 30 μm (inserts, 10 μm). N = 3 independent experiments (CG).
Figure 5.
Figure 5.
Functional analysis of phagocytic microglia using ClueGO. Charts show the interactions among the significantly different functions for the four main expression patterns. Biological functions are visualized as colored nodes linked to related groups based on their κ score level. The node size reflects the enrichment significance of the term and functionally related groups are linked. Non-grouped terms are shown in gray.
Figure 6.
Figure 6.
Functional analysis of phagocytic microglia using DAVID and MANGO. A, Functional analysis of phagocytic microglia using DAVID software. Left axis represents the fold enrichment of each biological function and right axis represents the adjusted p value of each GO term. Key for the GO terms: GO:0014032, neural crest cell development; GO:0045664, regulation of neuron differentiation; GO:0050767, regulation of neurogenesis; GO:0019226, transmission of nerve impulse; GO:0007049, cell cycle; GO:0051301, cell division; GO:0008283, cell proliferation; GO:0000278, mitotic cell cycle; GO:0008284, positive regulation of cell proliferation; GO:0051726, regulation of cell cycle; GO:0042127, regulation of cell proliferation; GO:0048762, mesenchymal cell differentiation; GO:0045596, negative regulation of cell differentiation; GO:0045597, positive regulation of cell differentiation; GO:0006935, chemotaxis; GO:0016477, cell migration; GO:0048870, cell motility; GO:0060485, mesenchyme development; GO:0051094, positive regulation of developmental process; GO:0060284, regulation of cell development; GO:0007517, muscle organ development; GO:0035295, tube development; GO:0007507, heart development; GO:0051094, positive regulation of developmental process; GO:0060429, epithelium development; GO:0001525, angiogenesis; GO:0001568, blood vessel development; GO:0048514, blood vessel morphogenesis; GO:0042981, regulation of apoptosis; GO:0043067, regulation of programmed cell death; GO:0006955, immune response; GO:0002520, immune system development; GO:0006954, inflammatory response; GO:0045321, leukocyte activation; GO:0002694, regulation of leukocyte activation; GO:0007626, locomotory behavior; GO:0030036, actin cytoskeleton organization; GO:0007015, actin filament organization; GO:0030029, actin filament-based process; GO:0006096, glycolysis; GO:0046365, monosaccharide catabolic process; GO:0006796, phosphate metabolic process; GO:0006796, phosphate metabolic process; GO:0051173, positive regulation of nitrogen compound metabolic process; GO:0045935, positive regulation of nucleobase, nucleoside, nucleotide and nucleic acid metabolic process; GO:0051254, positive regulation of RNA metabolic process; GO:0016568, chromatin modification; GO:0016481, negative regulation of transcription; GO:0010628, positive regulation of gene expression; GO:0045941, positive regulation of transcription; GO:0045944, positive regulation of transcription from RNA polymerase II promoter; GO:0045893, positive regulation of transcription, DNA-dependent; GO:0045449, regulation of transcription; GO:0006357, regulation of transcription from RNA polymerase II promoter; GO:0051276, chromosome organization; GO:0006310, DNA recombination; GO:0006260, DNA replication; GO:0006974, response to DNA damage stimulus; GO:0034660, ncRNA metabolic process; GO:0009451, RNA modification; GO:0043039, tRNA aminoacylation; GO:0006399 tRNA metabolic process; GO:0007267, cell–cell signaling; GO:0007242, intracellular signaling cascade; GO:0007243, protein kinase cascade; GO:0051056, regulation of small GTPase-mediated signal transduction; GO:0007264, small GTPase-mediated signal transduction; GO:0016055, Wnt receptor signaling pathway; GO:0016310, phosphorylation; GO:0043038, amino acid activation; GO:0001775, cell activation; GO:0033554, cellular response to stress; GO:0030097, hemopoiesis; GO:0044271, nitrogen compound biosynthetic process; GO:0048285, organelle fission; GO:0009891, positive regulation of biosynthetic process; GO:0010557, positive regulation of macromolecule biosynthetic process; GO:0051258, protein polymerization; GO:0050865, regulation of cell activation; GO:0044057, regulation of system process; GO:0006979, response to oxidative stress; GO:0070482, response to oxygen levels; GO:0009611, response to wounding; GO:0022613, ribonucleoprotein complex biogenesis; GO:0051225, spindle assembly; GO:0006412, translation. Left axis represents the fold enrichment of each biological function and right axis represents the adjusted p value of each GO term. Only statistically significant changes are shown. B, Diagram depicting the strategy followed to search for potential modulators of neurogenesis produced by phagocytic microglia in the arrays. The filtering started by differentiating the heterologous and autologous genes in the MANGO database. Then, GO terms related to neurogenesis were selected for the heterologous MANGO genes. Afterward, the molecules that presented the neurogenic GO terms were searched in the array. Finally, the candidate genes were filtered only to select those that appeared extracellularly (heterologous genes), and genes with receptor activity were manually discarded.
Figure 7.
Figure 7.
Phagocytosis-related candidates include trophic factors and peptides and hormones. A, Classification of the 224 potential modulators of neurogenesis. “Trophic factor” was the category with the highest percentage of genes in every regulatory pattern, however, the category “Peptides and hormones” included genes with the highest FC changes in the UP regulation pattern. B, The 224 candidates classified by their identity and FC.
Figure 8.
Figure 8.
Validation of transcriptional changes induced by phagocytosis. A, Electropherogram obtained by a bioanalyzer comparing the RNA profile (nt, nucleotides) of control and phagocytic microglia as well as apoptotic SH-SY5Y (treated with 3μM STP for 24 h). B, Representative confocal images of FU+ active transcription sites of SH-SY5Y cells treated with STP (3μM, 4 h) for apoptosis induction. Nuclei were labeled with DAPI (white), cell death was detected by pyknosis/karyorrhexis (white, DAPI; arrowheads), and transcription sites were detected by FU (red). C, mRNA expression levels of the candidates selected for validation by real-time qPCR. N = 4 independent experiments. HPRT was selected as a reference gene. Scale bar, 20 μm. N = 4 independent experiments (F). Error bars represent mean ± SEM. *p < 0.05, **p < 0.01, ***p < 0.001 by Holm–Sidak post hoc test of (after one-way ANOVA was significant at p < 0.05). Only significant effects are shown. Values of statistics used are shown in Table 4.
Figure 9.
Figure 9.
Effect of phagocytic microglia secreted factors on neurogenesis in vitro. A, Experimental design of the in vitro neurogenesis assay: (1) brain disaggregation; (2) neurosphere proliferation; (3) dissociation, plating, and proliferation of NPCs for 48 h; (4) differentiation in the presence of conditioned media (CM) from control microglia (microC) or 24 h phagocytic microglia (microPh). B, Representative confocal microscopy images of NPCs treated with CM microC or microPH after 1 d. DMEM was used as control. C, Percentage of cells labeled with Ki67 over total cells labeled with DAPI. D, Percentage of different cell markers over total Ki67 population: nestin+ (with or without GFAP), GFAP only, or unlabeled. E, Representative confocal microscopy images of the different morphologies observed in the neurogenesis assay images. F, Percentage of the different cell types found after 3 and 5 d treatment with CM microC or microPH. Early/late ram refers to early/late ramified cells. G, Representative confocal microscopy images of NPCs treated with CM microC or microPH after 3 d. H, Density of live and dead cells (determined by pyknosis/karyorrhexis) after CM treatment for 3 and 5 d. Scale bars: B, 50 μm; E, 9 μm; B, z = 11.9 μm; G, z = 20 μm. N = 3 independent experiments (C, D, F, H). Error bars represent mean ± SEM. Two-way ANOVA (treatment × cell types, D) and three-way ANOVA (treatment × cell types × time, F; and treatment × life × time, H) showed interactions between the different factors and thus the data were split into several one-way ANOVAs. *p < 0.05, **p < 0.01, ***p < 0.001 by Holm–Sidak post hoc test versus MicroC group (after one-way ANOVA was significant at p < 0.05). Values of statistics used are shown in Table 5.
Figure 10.
Figure 10.
Characterization of CM cell types by S100β and multipotency assays. A, Experimental design of the in vitro neurogenesis assay for S100β staining. B, Representative confocal microscopy images of NPCs treated with CM microC or microPH. DMEM was used as control. C, Percentage of expression of S100β in the different cell types found after 3 and 5 d treatment with CM microC or microPH. The category “Other” refers to cells with strong S100β expression, no GFAP and a ramified morphology suggest that they may be oligodendrocytes (Hachem et al., 2005). D, Experimental design of the in vitro multipotency assay. E, Representative confocal microscopy images of NPCs treated with CM microC, microPH or DMEM followed by 5 d of DMEM/F12. F, Ratio of live/dead cell density over the cells at 3 d after each treatment. G, Differentiation ratio of each phenotype after 3 d treatment with CM microC or microPH followed by 5 or 9 d DMEM/F12. Scale bars: B, E, 20 μm (inserts in B, 10 μm); B, F, z = 9 μm. N = 3 independent experiments (C, F, G). Error bars represent mean ± SEM. *p < 0.05, **p < 0.01. Values of statistics used are shown in Table 7.
Figure 11.
Figure 11.
Characterization of CM cell types by calcium imaging and late survival/differentiation assays. A, Experimental design of the in vitro calcium imaging assay. NPCs were treated with CM microC or microPH for 5 d and the resulting stellate, ramified and bipolar cells were incubated and loaded with Fura-2 AM and afterward, cells were challenged with KCl, AMPA, ATP, histamine, and NMDA to measure their Ca+2 response. B, Representative epifluorescence microscopy images of neuroprogenitors treated with CM microC or microPH for 5 d. Freshly dissociated NPCs were used as control. C, Calcium responses to consecutive stimuli (KCl, AMPA, ATP, histamine, NMDA) determined as a ratio of Fura2 fluorescence of cells shown in B. D, Percentage of cell phenotypes responding to each stimulus (38 stellate cells, 8 ramified cells, 19 bipolar cells, and 33 NPCs; pooled from N = 2 independent experiments). The baseline was calculated as the mean of the first 60 s of recording for each cell. Only peaks that increase or decrease three times the SEM of the baseline were considered as a positive response. E, Representative blots showing relative levels of REST, Ascl, phospho-SMAD1/5/9, and SMAD1 in NPCs treated with CM microC or microPH for 3 d. F, Quantification of the relative expression of REST, Ascl and the ratio phospho-SMAD/total-SMAD in NPCs treated with CM microC or microPH for 3 d. β-actin was used as a loading control. Scale bar, 20 μm. N = 2 independent experiments (D, pooled cells), N = 3 independent experiments (F). Error bars represent mean ± SEM. *p < 0.05, ***p < 0.001 by Holm–Sidak post hoc test (after one-way ANOVA was significant at p < 0.05). Values of statistics used are shown in Table 8.
Figure 12.
Figure 12.
Effect of CM microLPS on neurogenesis in vitro. A, Experimental design of the in vitro neurogenesis assay. B, Representative confocal microscopy images of neuroprogenitors treated with CM MicroC, CM MicroLPS 6 h + 18 h (1 μg/ml) or LPS alone (1 μg/ml; 24 h). C, Percentage of cell types found after 3 or 5 d treatment with CM MicroC, CM MicroLPS (6 h + 18 h), LPS. The group “bipolar cells” is included for visualization purposes, but as this cell type was not found with any of the treatments, it was not included in the statistical analysis. Three-way ANOVA (treatment × life × time) showed interactions between the different factors and thus the data were split into several one-way ANOVAs, which showed no significant effect of the treatment. D, mRNA expression levels of selected cytokines by real-time qPCR in control microglia (microC), 24 h phagocytic microglia (microPH), as well as control and phagocytic microglia treated with LPS (150 ng/ml, 18 h). HPRT was selected as a reference gene. E, Representative confocal microscopy images of NPCs treated with CM from LPS treated microglia or LPS alone (low concentration: 150 ng/ml; 18 h). F, Quantification of the different cell types found after 3 or 5 d treatment with CM from LPS treated microglia or LPS. G, Representative confocal microscopy images of NPCs treated with CM MicroLPS or LPS (1 μg/ml; 24 h). H, Quantification of the different cell types found after 3 or 5 d treatment with CM MicroLPS or LPS (high concentration: 1 μg/ml; 24 h). I, Representative confocal microscopy images of neuroprogenitors treated with CM BV2, CM BV2 LPS high or LPS high (1 μg/ml; 24 h). J, Quantification of the different cell types found after 3 or 5 d treatment with CM BV2, CM BV2 LPS, or LPS. Scale bars: B, E, G, I, 20 μm, z = 6.3 μm. N = 3 independent experiments (C), N = 4 independent experiments (D), N = 2 independent experiments (F, H, J). Error bars represent mean ± SEM. **p < 0.01, ***p < 0.001 by Holm–Sidak post hoc test (after one-way ANOVA was significant at p < 0.05). Only significant effects are shown. Values of statistics used are shown in Table 8.
Figure 13.
Figure 13.
Effect of phagocytic microglia secreted factors on late neurogenesis in vitro. A, Experimental design of the in vitro late survival and differentiation assay. B, Density of live and dead cells found after 10 d of DMEM/F12 followed by 3–5 d of CM microC or microPH and DMEM. The number of cells before adding the CM (t = 0) is shown as a control. C, Representative confocal microscopy images of NPCs treated for 10d with DMEM/F12 followed by 3–5 d of CM microC, microPH, or DMEM. Top, Left, DMEM/F12 treatment of 10 d, before adding any CM. D, Percentage of cell types found after 10 d of DMEM/F12 followed by 3–5 d of CM microC or microPH and DMEM. The number of cells before adding the CM (t = 0) is shown as a control. Mat stellate designates stellate cells with mature (more branched) morphology, and early/late ram designates early/late ramified cells. Scale bars: 20 μm, z = 6.3 μm. N = 3 independent experiments (B, D). Three-way ANOVA (treatment × life × time, F) showed interactions between the different factors and thus the data were split into several one-way ANOVAs, which showed no significant effect of the treatment. Data in D could not be normalized because some cell categories were only present in particular treatments (i.e., the mature stellate phenotype only occurred in MicroPH groups). Error bars represent mean ± SEM. Values of statistics used are shown in Table 8.
Figure 14.
Figure 14.
Acute and long-term effects of phagocytic microglia secreted molecules on neurogenesis in vivo. A, Experimental design used for the administration of CM microC or microPH by osmotic pumps to 2-month-old fms-EGFP mice. B, Representative confocal images of cell proliferation after the CM treatments for 6 d. Cell nuclei were labeled with DAPI (white) and BrdU was used as a proliferative marker (magenta). C, BrdU+ cell density after CM microC or microPH treatment. D, Apoptotic cell density after CM microC or microPH treatment. E, Representative confocal images of stem cells labeled with nestin (red) and GFAP (green). F, Stem cell density after CM microC or microPH treatment. G, Proliferating stem cell (nestin+, GFAP+, BrdU+) density after CM microC or microPH treatment. H, Representative confocal images of neuroblast cell populations AB, CD, EF, and total neuroblasts. Neuroblast cells are labeled with DCX (green). I, Density of neuroblast types AB, CD, and EF. J, Proliferating neuroblasts (BrdU+, DCX+) density after treatment with CM microC or microPH. K, Experimental design used for the administration of CM microC or microPH by osmotic pumps to 2-month-old fms-EGFP mice. L, Representative confocal images of BrdU+ cells in the dentate gyrus. M, BrdU+ cell density after CM microC or microPH treatment. N, Apoptotic cell density after CM microC or microPH treatment. O, Representative confocal images of neuroblasts labeled with DCX (green). P, Density of total number of neuroblasts in Sections 1–3 closest to the injection site, and 4–6 further away. Q, Representative confocal images of a newborn neuron labeled with BrdU (yellow) and NeuN (magenta). R, Density of neuroblast types AB, CD, EF, and total neuroblasts. S, New neurons (NeuN+, BrdU+) density after CM microC or microPH treatment. Scale bars: B, L, E, O, H, 50 μm (insert in H, 20 μm); Q, 20 μm (insert, 10 μm); B, L, E, O, H, z = 12 μm; Q, z = 6 μm. N = 7–10 mice (BJ), N = 5–11 mice (LS). Error bars represent mean ± SEM. #p = 0.0649, *p < 0.05, **p < 0.01, ***p < 0.001 by Student's t test. Values of statistics used are shown in Table 9. ns, not significant.
Figure 15.
Figure 15.
Microglia provides a feedback loop that controls neurogenesis through the phagocytosis-secretome.

References

    1. Aarum J, Sandberg K, Haeberlein SL, Persson MA (2003) Migration and differentiation of neural precursor cells can be directed by microglia. Proc Natl Acad Sci U S A 100:15983–15988. 10.1073/pnas.2237050100 - DOI - PMC - PubMed
    1. Abiega O, Beccari S, Diaz-Aparicio I, Nadjar A, Layé S, Leyrolle Q, Gómez-Nicola D, Domercq M, Pérez-Samartín A, Sánchez-Zafra V, Paris I, Valero J, Savage JC, Hui CW, Tremblay MÈ, Deudero JJ, Brewster AL, Anderson AE, Zaldumbide L, Galbarriatu L, et al. (2016) Neuronal hyperactivity disturbs ATP microgradients, impairs microglial motility, and reduces phagocytic receptor expression triggering apoptosis/microglial phagocytosis uncoupling. PLoS Biol 14:e1002466. 10.1371/journal.pbio.1002466 - DOI - PMC - PubMed
    1. Alberdi E, Wyssenbach A, Alberdi M, Sánchez-Gómez MV, Cavaliere F, Rodríguez JJ, Verkhratsky A, Matute C (2013) Ca2+-dependent endoplasmic reticulum stress correlates with astrogliosis in oligomeric amyloid beta-treated astrocytes and in a model of Alzheimer's disease. Aging Cell 12:292–302. 10.1111/acel.12054 - DOI - PubMed
    1. Babu H, Claasen JH, Kannan S, Rünker AE, Palmer T, Kempermann G (2011) A protocol for isolation and enriched monolayer cultivation of neural precursor cells from mouse dentate gyrus. Front Neurosci 5:89. 10.3389/fnins.2011.00089 - DOI - PMC - PubMed
    1. Beccari S, Valero J, Maletic-Savatic M, Sierra A (2017) A simulation model of neuroprogenitor proliferation dynamics predicts age-related loss of hippocampal neurogenesis but not astrogenesis. Sci Rep 7:16528. 10.1038/s41598-017-16466-3 - DOI - PMC - PubMed

Publication types

MeSH terms