. 2020 Jan 2;11(1):63.
doi: 10.1038/s41467-019-13710-4.

Retinoic acid degradation shapes zonal development of vestibular organs and sensitivity to transient linear accelerations

Affiliations

Retinoic acid degradation shapes zonal development of vestibular organs and sensitivity to transient linear accelerations

Kazuya Ono et al. Nat Commun. .

Abstract

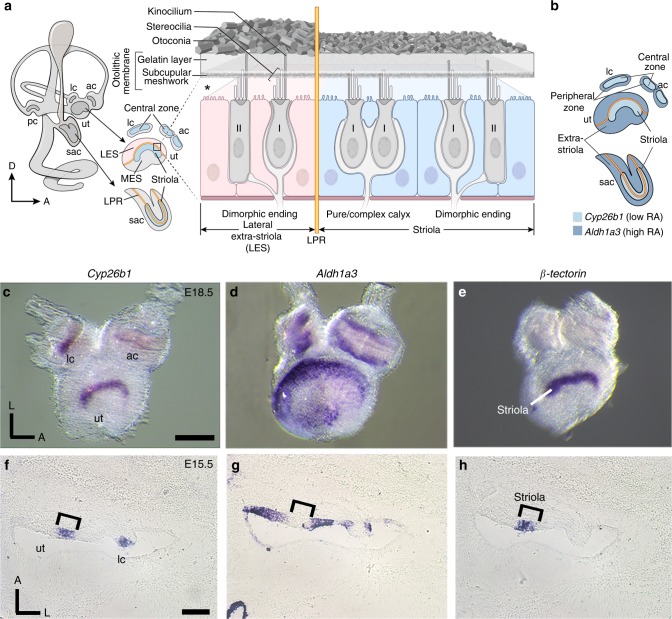
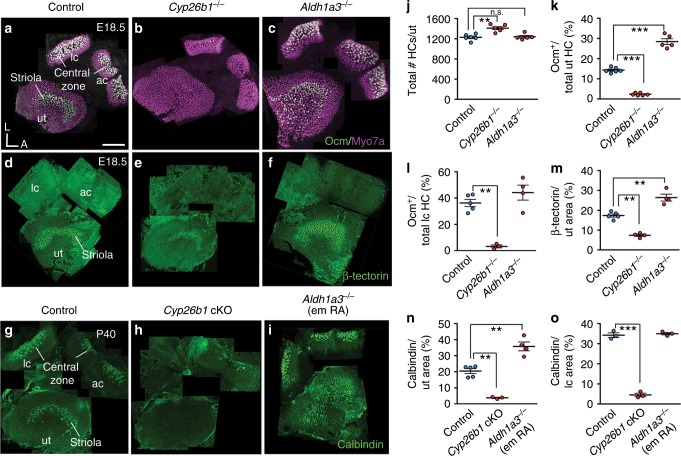
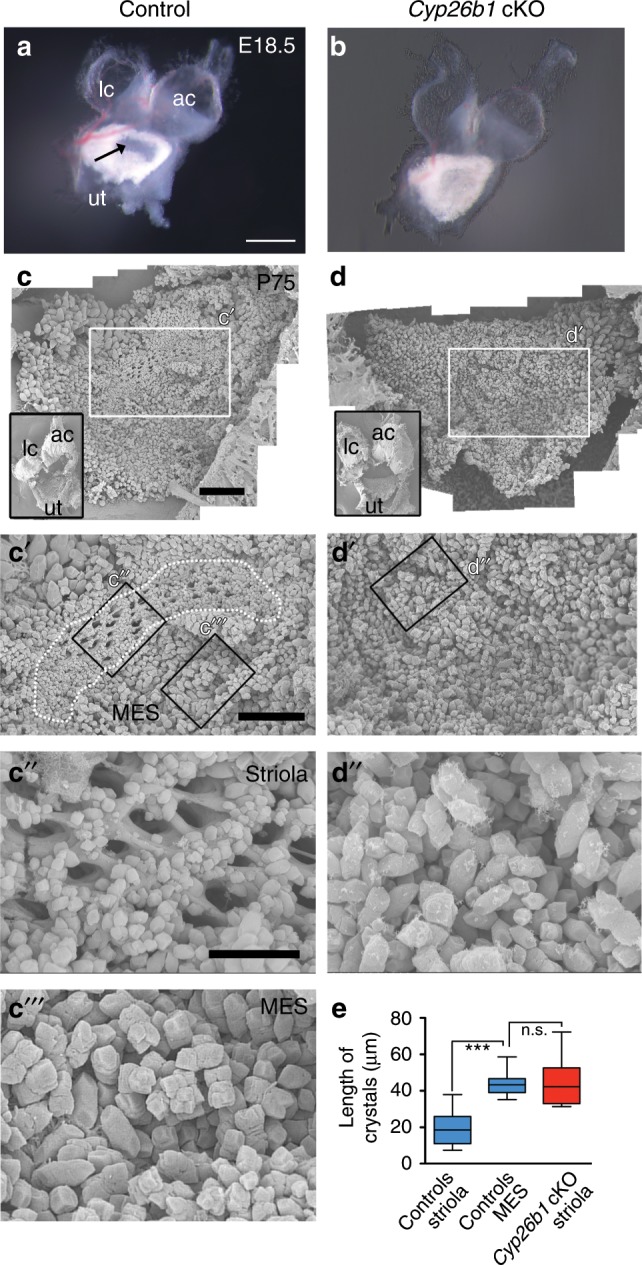
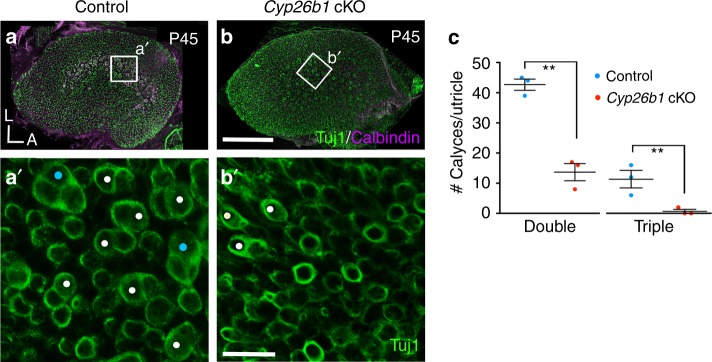
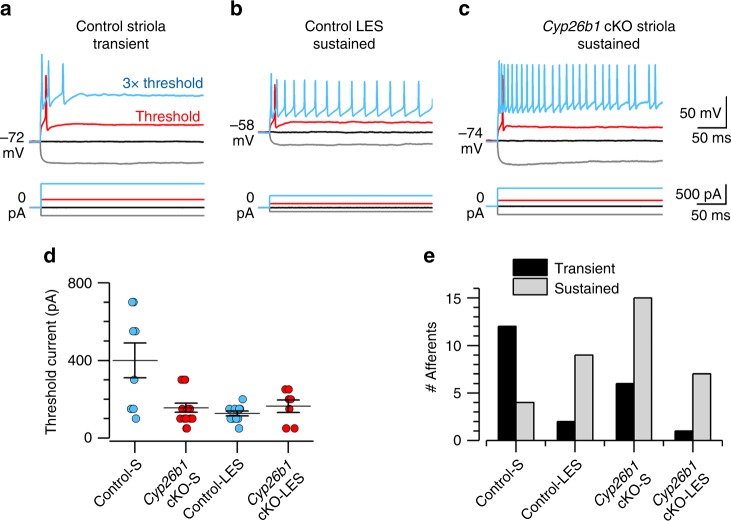
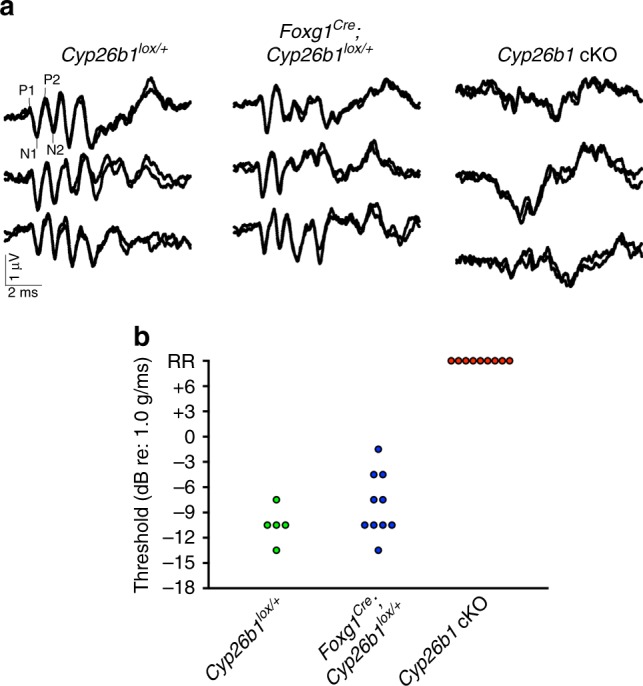
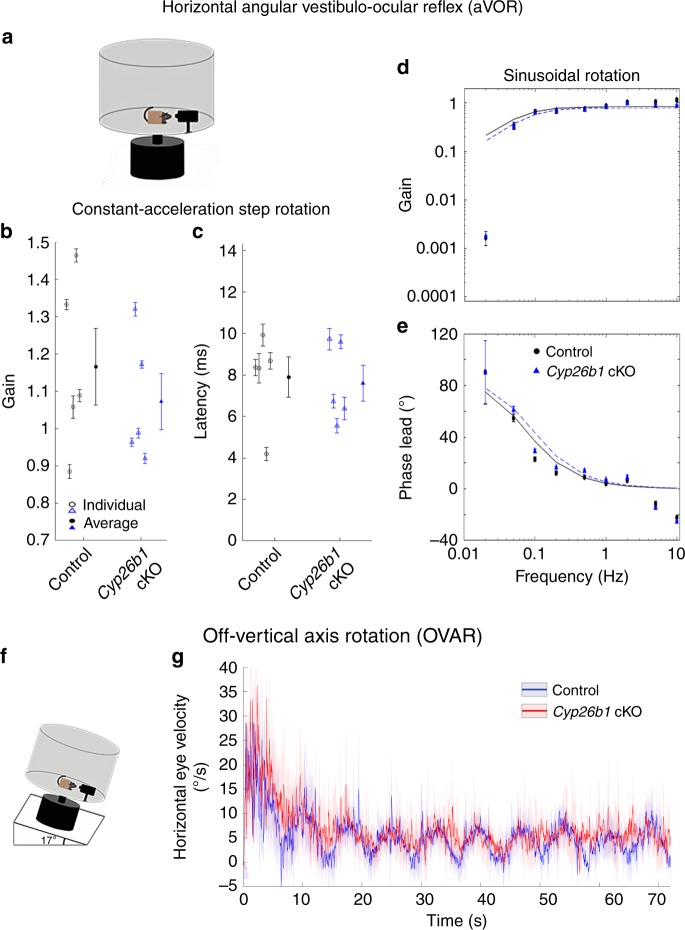
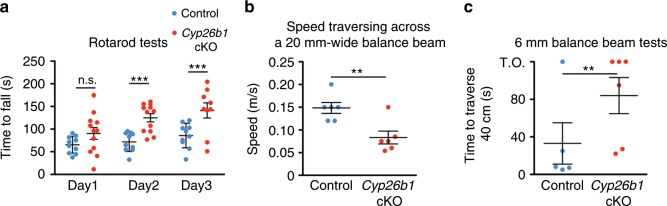
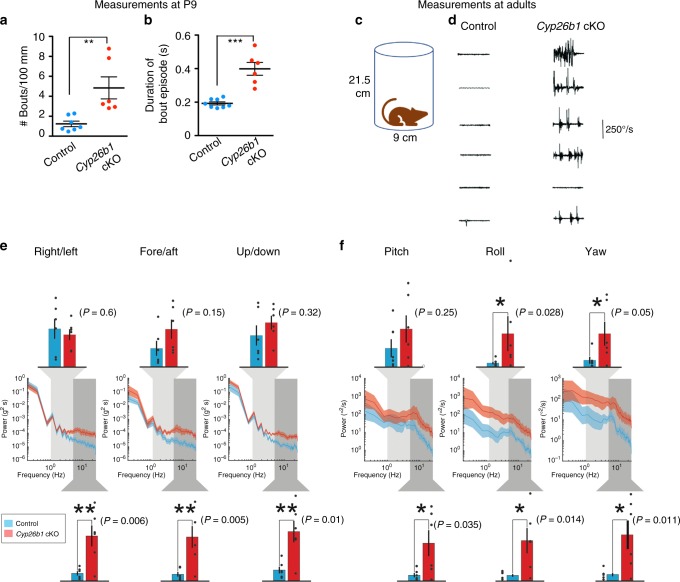
Each vestibular sensory epithelium in the inner ear is divided morphologically and physiologically into two zones, called the striola and extrastriola in otolith organ maculae, and the central and peripheral zones in semicircular canal cristae. We found that formation of striolar/central zones during embryogenesis requires Cytochrome P450 26b1 (Cyp26b1)-mediated degradation of retinoic acid (RA). In Cyp26b1 conditional knockout mice, formation of striolar/central zones is compromised, such that they resemble extrastriolar/peripheral zones in multiple features. Mutants have deficient vestibular evoked potential (VsEP) responses to jerk stimuli, head tremor and deficits in balance beam tests that are consistent with abnormal vestibular input, but normal vestibulo-ocular reflexes and apparently normal motor performance during swimming. Thus, degradation of RA during embryogenesis is required for formation of highly specialized regions of the vestibular sensory epithelia with specific functions in detecting head motions.


Conflict of interest statement

The authors have no competing interests.

Figures

Fig. 1
Fig. 1. Complementary expression patterns of Cyp26b1 and Aldh1a3.
a Schematic illustration of the inner ear and sectional view of the utricle (ut) across the striola and lateral extrastriola region (LES). Pear-shaped type I HCs are innervated by calyces and cylindrical-shaped type II HCs are innervated by bouton type endings. Pure/complex calyces are exclusively present in the striolar/central zone, whereas dimorphic nerve endings are found across the entire organ. Otoconia are smaller in size and less abundant in striola than extrastriola of the utricle. Asterisk indicates that the relationship between hair bundles and the otoconial membrane is not clear, but evidence suggests that hair bundles of striolar HCs are less firmly embedded in the otolithic membrane than their counterparts in the extrastriolar region,. Yellow line represents the line of polarity reversal (LPR), which separates each macula into two regions with opposite hair bundle orientations: 1) striola and MES (medial extrastriola): 2) LES. The striola of maculae and the central zone of anterior (ac) and lateral cristae (lc) are in blue color. The LPR is at the lateral edge of the striola in the ut but it bisects the striola in the saccule (sac). b Schematic summary of the expession pattern of Cyp26b1 (light blue) and Aldh1a3 (dark blue) described in ch. ce Whole-mount in situ hybridization analysis of Cyp26b1, Aldh1a3, and β-tectorin transcripts at E18.5 mouse ut, ac, and lc. Expression of Cyp26b1 (c) is restricted to the central zone of the two cristae and striola of the ut that is β-tectorin positive e, whereas Aldh1a3 (d) is predominantly expressed in the peripheral regions. fh Adjacent tissue sections at the levels of ut and lc at E15.5. f Cyp26b1 expression is concentrated in the supporting cell (SC) layer of the central zone of the lc and striola of the ut, comparable to the β-tectorin domain (h, bracket). g Aldh1a3 expression is largely complementary to Cyp26b1 (f) in each organ. Scale bars: 200 μm. RA, retinoic acid; D, dorsal; A, anterior; L, lateral; pc, posterior crista. a, b Drawn by NIH Medical Arts.
Fig. 2
Fig. 2. Disruption of RA signaling alters striolar/central zone formation.
a Oncomodulin (Ocm) is expressed in type I HCs in striolar/central zones, whereas all HCs are positive for Myosin7a of controls. b, c, j Total HC number is increased in Cyp26b1−/− (1394 ± 39, P = 0.014, n = 6), but unchanged in Aldh1a3−/− utricles (1285 ± 28, P = 0.419, n = 5), compared to controls (1229 ± 30, n = 6). b, c, k Percentages of Ocm+ HCs (14.3 ± 0.5 in controls, n = 6) are decreased in Cyp26b1−/− (2.3 ± 0.2, n = 6, p < 0.0001) and increased in Aldh1a3−/− utricles (28.4 ± 1.4, n = 5, P < 0.0001). b, c, l Percentages of Ocm+ HCs in lateral cristae (lc, 36.2 ± 2.7 in controls, n = 5) are reduced in Cyp26b1−/− (3.2 ± 1.1, n = 3, P = 0.0005), but unchanged in Aldh1a3−/− mutants (44.1 ± 5.6, n = 4, P = 0.302). d Anti-β-tectorin labels SCs in striolas of utricles. e, f, m β-tectorin+ domain, as % of total utricular macular area (17.4 ± 0.9 in controls, n = 5), is reduced in Cyp26b1−/− (7.4 ± 0.6, n = 4, P = 0.0002) and increased in Aldh1a3−/− (26.4 ± 1.7, n = 4, P = 0.0003) utricles. g Anti-calbindin labels calyceal nerve endings in striolar/central zones. h, i, n, o Expression and percentage of calbindin-positive area is reduced in utricles (3.8 ± 0.3, n = 3, P = 0.0005) and cristae (4.7 ± 1.4, n = 3, P < 0.0001) of Cyp26b1 cKO, but increased in utricles (36.0 ± 6.6, n = 4, P = 0.0006) and unchanged in cristae (34.4 ± 0.5, n = 3, P = 0.3021) of Aldh1a3−/− (em RA) mutants, compared to respective controls (n, 19.7 ± 1.7, n = 5; o, 34.2 ± 1.1, n = 3). Error bars: SEM. Significance was assessed by one-way ANOVA for all panels. A, anterior; L, lateral. **P < 0.01 and ***P < 0.001. n.s., not significant. Scale bar: 200 μm.
Fig. 3
Fig. 3. Loss of regional differences in the otoconia of Cyp26b1 cKO utricles.
a, b A dissected utricle (ut), anterior (ac), and lateral cristae (lc) of Foxg1Cre;Cyp26b1lox/+ control (a) and Cyp26b1 cKO (b) ears at E18.5. In control utricle, the striola region shows a clearance of the otoconia (arrow in a), which is missing in Cyp26b1 cKO utricles. ce SEM of otoconia in Foxg1Cre;Cyp26b1lox/+ controls (cc‴) and Cyp26b1 cKO (dd″) utricles at P75. Insets show low-power views of respective utricles. In controls (c′, c″, c‴), the striolar region (dotted outline) shows otoconia with smaller crystals (c″, e, 19.7 ± 1.5 μm, n = 22 crystals) and perforated holes in the subcupular meshwork layer (c″), whereas the medial extrastriolar region (MES) shows larger otoconia (c‴, e, 40.2 ± 2.2 μm, n = 23, P < 0.0001). There is no clear regional difference in the size of the otoconia in the Cyp26b1 cKO mutant utricle (d, d′), and the otoconia crystals in the presumptive striolar region are larger in size (d″, e, 42.9 ± 3.1 μm, n = 21), comparable to those found in MES of controls (c‴, P = 0.6509). The one-way ANOVA with multiple comparisons was applied. In the box plots, bounds of box span from 25 to 75% percentile, center line represents the median, and whiskers represent the minimum and maximum of the data points. ***P < 0.001. Scale bars: 200 μm for a, b, 300 μm for c, d, and c′, d′, and 100 μm for c″, c‴, d″. n.s., not significant.
Fig. 4
Fig. 4. Pure/complex calyces are reduced in Cyp26b1 cKO mice.
ac P45 whole-mount utricles from controls (a, a′) and Cyp26b1 cKO (b, b′) immunolabeled with anti-Tuj1 (green) and anti-calbindin (magenta) antibodies. a, b Maximum intensity projection of the entire utricle. a′, c Enlarged, single plane image of the rectangular region in control striola (a), showing the presence of large number of double (white circles, 42.6 ± 1.8 double calyces/utricle) and triple (cyan circles, 10.0 ± 2.0 triple/utricle, n = 3 utricles) calyces at the cell body level. b′, c Fewer double calyces (white circles, 13.6 ± 2.8 double calyces/utricle, P = 0.001, unpaired t test) and no triple calyx (0.6 ± 0.6 triple calyces/utricle, P = 0.006, n = 3) are found in the corresponding region of Cyp26b1 cKO mutants. Scale bars: 200 μm for a, b; 30 μm for a′, b′. **P < 0.01. A, anterior; L, lateral. Error bars: SEM.
Fig. 5
Fig. 5. Neural activity in the striola of Cyp26b1 cKO mice is extrastriolar-like.
ad Cyp26b1 cKO striolar afferents, like control extrastriolar afferents, were more excitable than control striolar afferents, as shown by their tendency to fire more spikes and by reduced current thresholds for spiking. ac Whole-cell current clamp records from patched calyces of a control striolar (Control-S) afferent (a), control lateral extrastriolar (Control-LES) afferent (b), and a Cyp26b1 cKO striolar (Cyp26b1 cKO-S) afferent (c). Five hundred-millisecond current steps were delivered in 50-pA increments from –200 pA to >1 nA relative to zero holding current; a subset is shown including the response at threshold current (red). Three times (3×) threshold current- (blue) evoked transient spiking in the control striolar afferent, but sustained spiking in the control-LES afferent and Cyp26b1 cKO-S afferent. d Mean threshold current to activate spikes was significantly higher in Control-S calyces than in all other categories—that is, the Cyp26b1 cKO-S calyces resembled Cyp26b1 cKO lateral extrastriolar (Cyp26b1 cKO-LES) calyces and Control-LES calyces. Two-way ANOVA showed main effects of genotype (control vs. Cyp26b1 cKO, F(1,41) = 6.1, P = 0.02), zone (striola vs. LES, F(1,41) = 10.0, P = 0.003) and their interaction (F(1,41) = 11.2, P = 0.002). Control-S afferents (400 ± 90 pA, n = 8) differed significantly from each other category, including control-LES afferents (127.3 ± 12 pA, n = 11; P = 0.0003, effect size 1.9) and Cyp26b1 cKO-S afferents (156.3 ± 23 pA, n = 16; P = 0.0005, effect size 1.6). Cyp26b1 cKO-S afferents did not differ from control-LES afferents (P = 0.94) or Cyp26b1 cKO-LES afferents (164 ± 32 pA, n = 7, P > 0.99). e Transient firing was more common than sustained firing in Control-S afferents; sustained firing was more common in Control-LES, Cyp26b1 cKO-S, and Cyp26b1 cKO-LES afferents. Error bars: SEM.
Fig. 6
Fig. 6. Absence of linear vestibular-evoked potential (VsEP) in Cyp26b1 cKO mice.
a Three representative VsEP waveforms for each genotype recorded at maximal jerk stimulus (+6 dB). In the Cyp26b1 cKO mutants, distinct peaks of P1–P2 and N1–N2 are not detectable. b Summary of thresholds for VsEP determined by various jerk magnitudes. There was no significant difference in VsEP thresholds between the Cyp26b1lox/+ (−10.5 ± 1.34 dB re: 1 g/ms, n = 5) and Foxg1Cre;Cyp26b1lox/+ heterozygotes (−8.1 ± 1.17 dB re: 1 g/ms; n = 10, P = 0.1026, unpaired t test). Cyp26b1 cKO mutants generated only a remnant response (RR).
Fig. 7
Fig. 7. Normal aVOR and OVAR responses in Cyp26b1 cKO mice.
a Schematic view of aVOR apparatus. Constant-acceleration step gain GA (b) and latency (c) for aVOR responses to whole-body, 3000°/s2 whole-body passive yaw rotations in darkness about an Earth-vertical axis through the head. Open markers denote individual mice; thick markers and lines show mean ± SEM. Gain (d) and phase lead (e) for yaw slow-phase aVOR responses to 0.02–10 Hz, 100°/s peak velocity sinusoidal, whole-body passive yaw rotations. Solid and dashed lines show first-order high-pass filter model fits to control and Cyp26b1 cKO mouse population data, respectively. The high variability of phase and 0.02 Hz and relatively poor fit to gain data at 0.02 Hz are due to the small amplitude of responses at that frequency. Differences between control and Cyp26b1 cKO mice were not significant for GA, latency, model gain, or model time constant (P < 0.05 for all comparisons, Mann–Whitney U test). f Schematic view of apparatus for off-vertical axis rotation (OVAR). Pitch of the table was maintained at 17°. g No significant difference in the eye velocity was observed between control and Cyp26b1 cKO mice during transient response (~20 s; amplitude: 43.8 ± 8.3 vs. 38.7 ± 7.4° (P = 0.66, unpaired t test), time constant: 4.1 ± 1.1 vs. 5.1 ± 2.3 s (P = 0.68, unpaired t test), when both semicircular canal and otolith organs are stimulated, and steady-state response (~20 s; amplitude: 5.3 ± 0.72 vs. 5.8 ± 0.75° (P = 0.64, unpaired t test), bias: 10.5 ± 1.3 vs. 8.5 ± 1.3 (P = 0.33, unpaired t test), time when only responses from otolith organs are expected to be measured.
Fig. 8
Fig. 8. Impaired coordination of Cyp26b1 cKO mice on balance beam.
a Quantification of rotarod tests. Each mouse was placed on a rotating rod, which accelerated from 5 to 40 r.p.m. over a 5-min period. Cyp26b1 cKO and Foxg1Cre;Cyp26b1lox/+ controls exhibited similar motor performance on day 1 of the trial (90.3 ± 15.9 s in mutants, n = 10, vs. 65.3 ± 6.5 s in controls, n = 10, P = 0.2573). Cyp26b1 cKO mutants were able to stay on rod longer than controls on the second day of testing (123.3 ± 11.0 s mutants vs. 71.7 ± 7.5 s controls, P = 0.0003) and third day (141.2 ± 17.8 s mutants vs. 85.7 ± 9.5 s controls, P = 0.0037). The two-way ANOVA with multiple comparisons was applied. b Quantification of speed to traverse 60 cm distance on a 20-mm-wide beam. Cyp26b1 cKO mutants moved slower (0.083 ± 0.014 m/s, n = 6) than controls (0.148 ± 0.011 m/s, n = 5, P = 0.0056, unpaired t test). c Quantification of time taken to cross 40 cm distance on a 6-mm-wide beam. Half of Cyp26b1 cKO mutants failed to traverse the beam in 2 min (3/6), whereas most of controls reached the endpoints within 30 s (4/5). By assigning 2 min for all the mice that failed to complete the 40 cm distance, Cyp26b1 cKO mutants moved slower (taking 84.0 ± 19.24 s to traverse the beam) than controls (33.0 ± 22.04 s for controls, P = 0.0099, unpaired t test). Error bars: SEM. **P < 0.01 and ***P < 0.001. TO, time out; n.s., not significant.
Fig. 9
Fig. 9. Increased head tremor in Cyp26b1 cKO mice.
a, b Quantification of head tremor for P9 pups. The number of bouts normalized over a 100 mm distance traveled (a) and average duration of each head-tremor episode over a 10-min period are shown (b). Cyp26b1 cKO pups showed more frequent (a, 4.8 ± 1.1 in mutants, n = 6, vs. 1.2 ± 0.2 in controls, n = 8, P = 0.0059) and longer duration (b, 398 ± 38 ms in mutants vs. 192 ± 9 ms in controls, n = 8, P < 0.0001) head tremor, compared to Foxg1Cre;Cyp26b1lox/+ controls. c Schematic of the apparatus for measuring head tremor of an adult mouse at rest with a miniture head motion sensor affixed on the top of the skull. d Cyp26b1 cKO showed characteristic head tremor (5/6), which were not present in controls. e, f Comparison of power spectra density of head movements in translational axes (e) and rotational axes (f) between controls (blue) and Cyp26b1 cKO mutants (red). Cyp26b1 cKO exhibit siginificantly higher power than controls at high frequencies (5–20 Hz, P = 0.006 for right/left, P = 0.005 for fore/aft, P = 0.01 for up/down, P = 0.035 for pitch, P = 0.014 for roll, and P = 0.011 for yaw axis, n = 6/group). Angular head velocity for yaw and roll axes of Cyp26b1 cKO also had significantly higher power for frequencies between 1 and 5 Hz (upper graphs, P = 0.05 for yaw and P = 0.028 for roll axis). Unpaired t test was applied for all panels. Error bars: SEM. *P < 0.05, **P < 0.01, and ***P < 0.001.

References

    1. Ahmed RM, Hannigan IP, MacDougall HG, Chan RC, Halmagyi GM. Gentamicin ototoxicity: a 23-year selected case series of 103 patients. Med. J. Aust. 2012;196:701–704. doi: 10.5694/mja11.10850. - DOI - PubMed
    1. Jones TA, Lee C, Gaines GC, Grant JW. On the high frequency transfer of mechanical stimuli from the surface of the head to the macular neuroepithelium of the mouse. J. Assoc. Res. Otolaryngol. 2015;16:189–204. doi: 10.1007/s10162-014-0501-9. - DOI - PMC - PubMed
    1. Eatock RA, Songer JE. Vestibular hair cells and afferents: two channels for head motion signals. Annu. Rev. Neurosci. 2011;34:501–534. doi: 10.1146/annurev-neuro-061010-113710. - DOI - PubMed
    1. Desai SS, Zeh C, Lysakowski A. Comparative morphology of rodent vestibular periphery. I. Saccular and utricular maculae. J. Neurophysiol. 2005;93:251–266. doi: 10.1152/jn.00746.2003. - DOI - PMC - PubMed
    1. Desai SS, Ali H, Lysakowski A. Comparative morphology of rodent vestibular periphery. II. Cristae ampullares. J. Neurophysiol. 2005;93:267–280. doi: 10.1152/jn.00747.2003. - DOI - PMC - PubMed

Publication types

MeSH terms

LinkOut - more resources