Review
. 2020 Feb;21(2):61-79.
doi: 10.1038/s41583-019-0250-1.

Tissue clearing and its applications in neuroscience

Affiliations
Review

Tissue clearing and its applications in neuroscience

Hiroki R Ueda et al. Nat Rev Neurosci. 2020 Feb.

Erratum in

Abstract

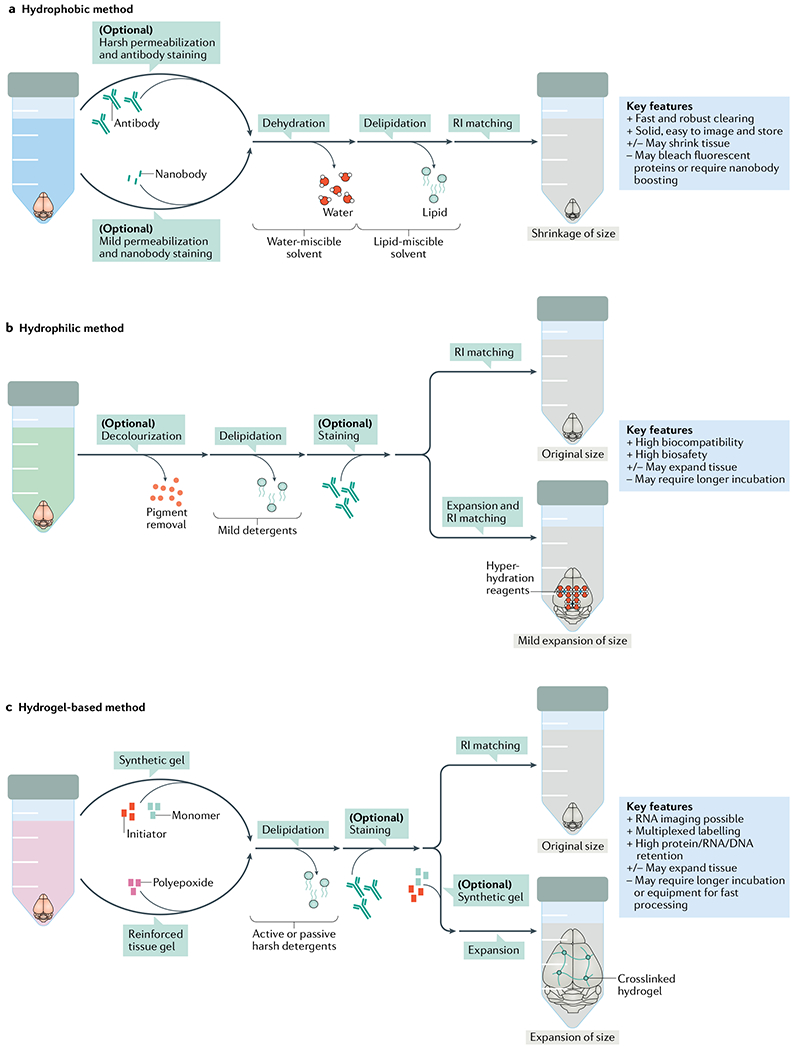
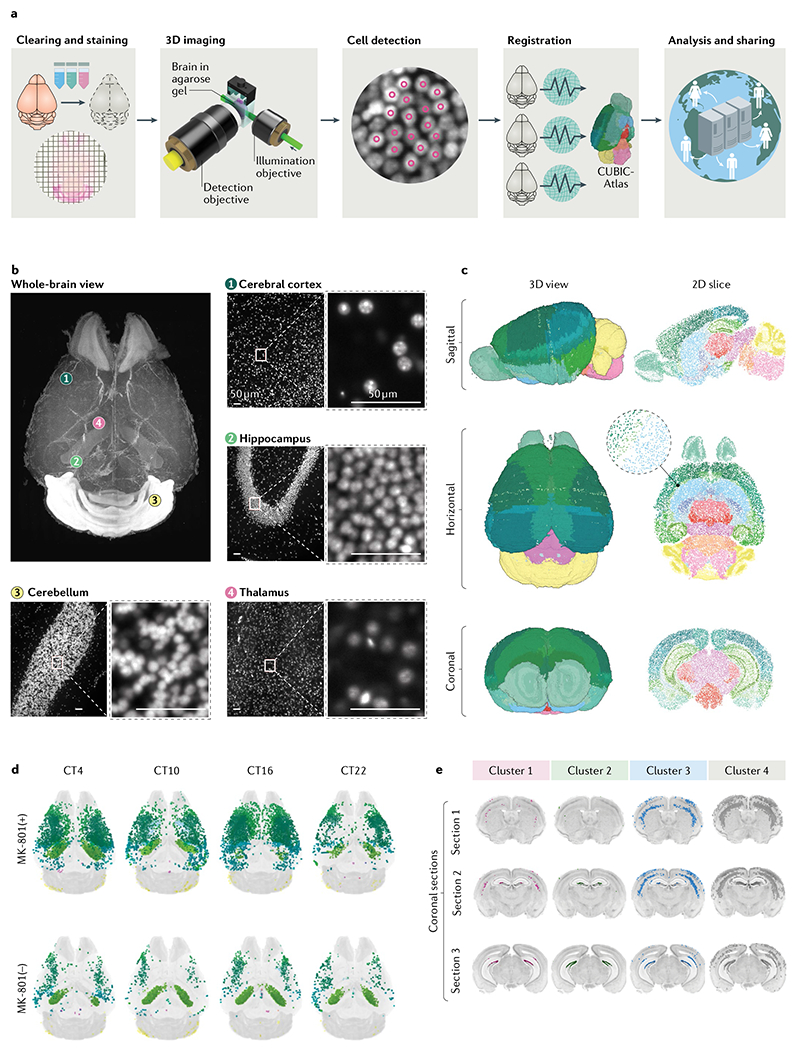
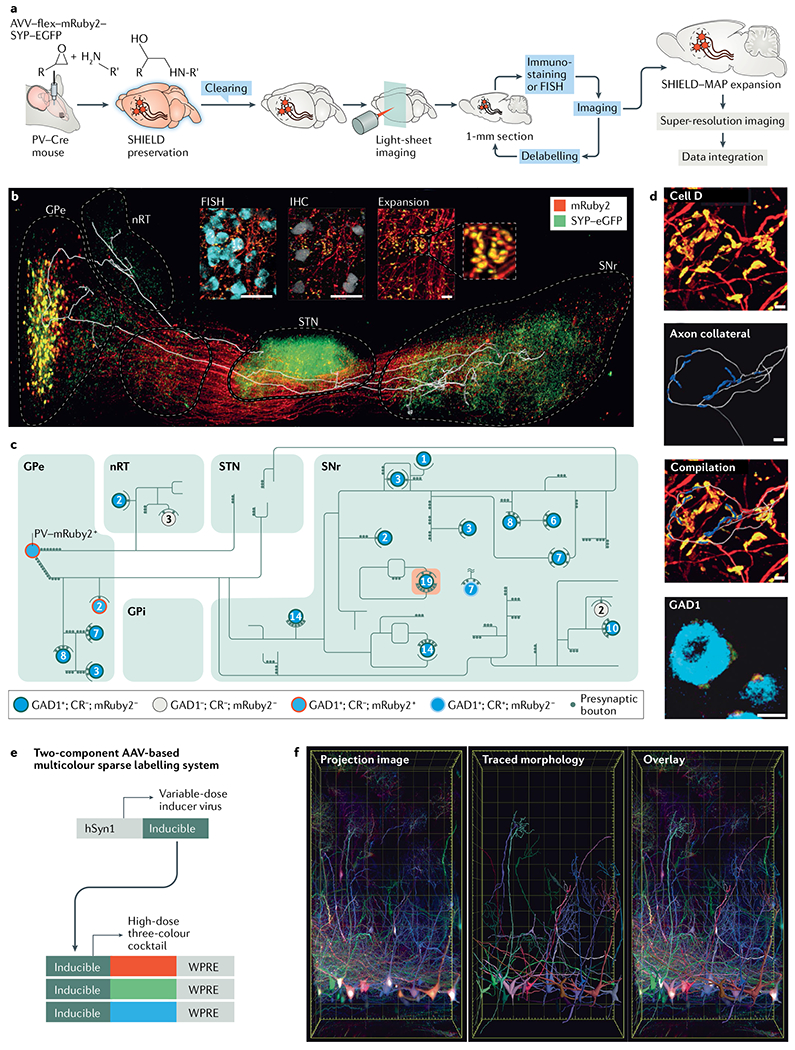
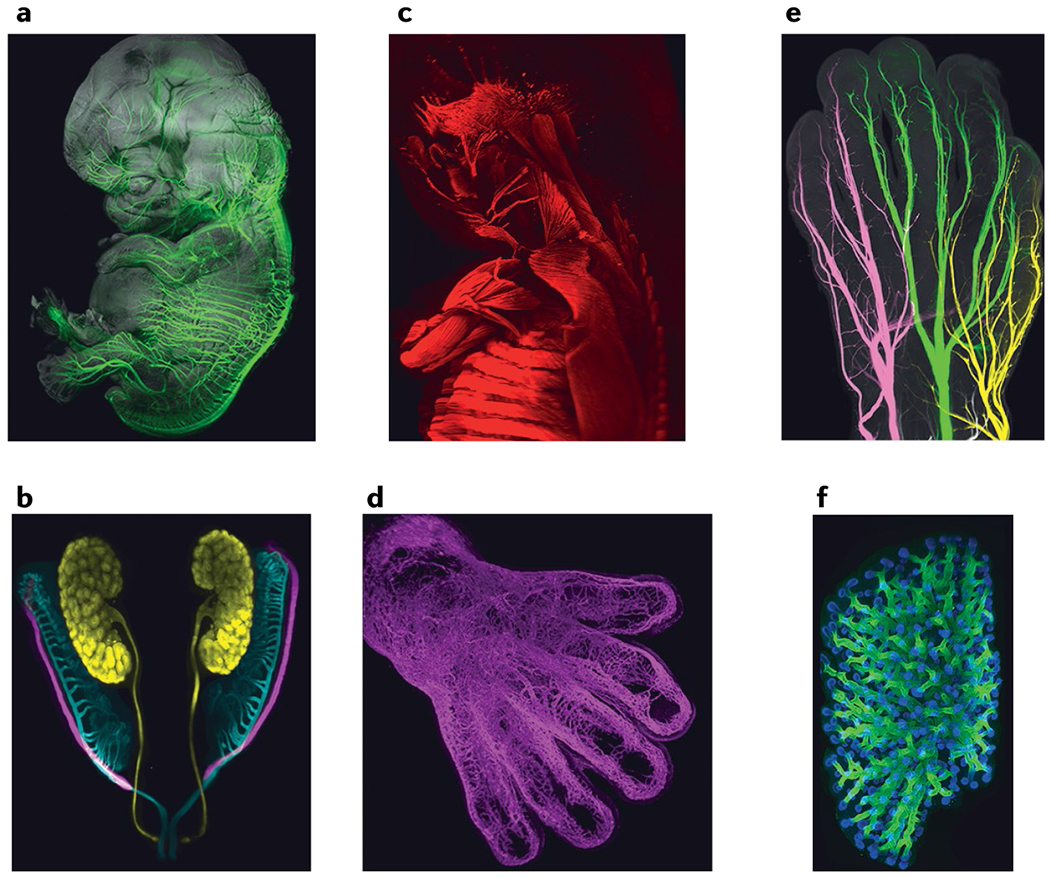
State-of-the-art tissue-clearing methods provide subcellular-level optical access to intact tissues from individual organs and even to some entire mammals. When combined with light-sheet microscopy and automated approaches to image analysis, existing tissue-clearing methods can speed up and may reduce the cost of conventional histology by several orders of magnitude. In addition, tissue-clearing chemistry allows whole-organ antibody labelling, which can be applied even to thick human tissues. By combining the most powerful labelling, clearing, imaging and data-analysis tools, scientists are extracting structural and functional cellular and subcellular information on complex mammalian bodies and large human specimens at an accelerated pace. The rapid generation of terabyte-scale imaging data furthermore creates a high demand for efficient computational approaches that tackle challenges in large-scale data analysis and management. In this Review, we discuss how tissue-clearing methods could provide an unbiased, system-level view of mammalian bodies and human specimens and discuss future opportunities for the use of these methods in human neuroscience.


Conflict of interest statement

Competing interests

H.R.U. is a co-inventor on a patent applications covering the CUBIC reagents (PCT/JP2014/070618 (pending), patent applicant is RIKEN, other co-inventors are E. A. Susaki and K. Tainaka; PCT/JP2017/016410 (pending), patent applicant is RIKEN, other co-inventors are K. Tainaka and T. Murakami) and a co-founder of CUBICStars Inc. A.E. is the applicant and the inventor on a patent application for technologies relating to vDISCO clearing (PCT/EP2018/063098 (pending)). K.C. is the inventor or a co-inventor on patents and patent applications for CLARITY (PCT/US2013/031066 (active), patent applicant is Stanford University, co-inventor is K. A. Deisseroth), stochastic electrotransport (PCT/US2015/024297 (active), patent applicant is MIT), SHIELD (PCT/US2016/064538 (pending), applicant is Massachusetts Institute of Technology (MIT), other co-inventors are E. Murray and J. H. Cho), SWITCH (PCT/US2016/064538 (pending), applicant is MIT, other co-inventors are E. Murray and J. H. Cho) and MAP (PCT/US2017/030285 (pending), applicant is MIT, other co-inventors are T. Ku, J. M. Swaney and J. Y. Park) and a co-founder of LifeCanvas Technologies. V.G. is a co-inventor on patent applications covering PACT and PARS (PCT/US2014/048985 (active), applicant is California Institute of Technology, other co-inventors are V. Gradinaru and B. Yang) and adeno-associated virus (US14/485,024 (active), applicant is California Institute of Technology, other co-inventors are B. E. Deverman, P. H. Patterson and V. Gradinaru) technologies. P.J.K. is an inventor or co-inventor on patents and patent applications covering multiview imaging (US14/049,470 (active), applicant is Howard Hughes Medical Institute) and adaptive light-sheet microscopy (PCT/US2017/038970 (pending), applicant is Howard Hughes Medical Institute, other co-inventors are R. K. Chhetri and L. A. Royer). P.T. and A.C. declare no competing interests.

Figures

Fig. 1 |
Fig. 1 |. Major tissue-clearing methods and their key features.
a | Hydrophobic methods rely on a complete dehydration of the tissue, followed by lipid extraction and refractive index (RI) matching using organic solvents. Flydrophobic methods are generally fast and can clear tissues fully. However, some hydrophobic methods can bleach the signal of fluorescent proteins rapidly. b | Hydrophilic methods are based on water-soluble solutions and are usually associated with higher biosafety and compatibility than hydrophobic methods. A potent hydrophilic method such as CUBIC starts with decolourization, which is followed by delipidation, RI matching and (optionally) expansion; some hydrophilic methods need longer incubation times for intact organs. c | Hydrogel embedding forms the third major category of tissue clearing. Hydrogel-based methods use either monomer and initiator molecules to make a synthetic gel or polyepoxide to make a reinforced tissue gel. Hydrogel-based methods can allow retainment of enough RNAs for assays such as fluorescence in situ hybridization and can be used to expand tissues several fold owing to the hydrogel mesh that glues the tissues. Some hydrogel-based methods need longer incubation times for intact organs.
Fig. 2 |
Fig. 2 |. Whole-brain single-cell-resolution imaging and analysis.
a | Tissue-clearing methods allow whole-brain profiling of cells. The brain data obtained can be registered in the 3D single-cell-resolution mouse brain atlas (CUBIC-Atlas) and shared by a worldwide research community via the Internet. First, tissue clearing (and fluorescent staining if applicable) is applied to the specimen. Cleared brains are imaged using high-resolution light-sheet microscopy. A graphics processing unit-based high-speed cell counting program identifies all cells from the acquired images, rendering the whole tissue into an ensemble of cellular points (that is, a point cloud). Then, individual brains are registered onto the common brain coordinates to allow guantitative comparison and analysis. Finally, these data should be shared among researchers to allow collaborative and large-scale analysis. b | Images of an adult mouse brain obtained by the hydrophilic tissue-clearing and expansion protocol CUBIC-X and custom-made high-resolution light-sheet microscopy. Nuclear staining using propidium iodide was applied to the cleared brain tissue. Magnified views of some of the representative brain regions, including cerebral cortex (view 1), hippocampus (view 2), cerebellum (view 3) and thalamus (view 4), are presented, along with the whole-brain overview. Scale bars indicate 50 μm after normalization of the sample expansion. c | The 3D single-cell-resolution mouse brain atlas CUBIC-Atlas. With use of nuclear staining images such as the ones shown in part b, all cell nuclei in a whole mouse brain were identified, totalling ~108 cells,. The colour of each cell represents anatomical annotations of each brain region obtained from the Allen Brain Atlas. d | The whole-brain neuronal activity profile with or without the long-term administration of a NMDA receptor inhibitor (MK-801) was quantified by imaging the destabilized fluorescent protein dVenus under the control of the Arc gene promoter by using the Arc–dVenus transgenic mouse. Each Arc–dVenus mouse brain at different circadian times (CT) was mapped onto CUBIC-Atlas in a probabilistic manner to virtually reconstruct the time series. Arc–dVenus-expressing cells are shown as dots, with their colours representing their anatomical areas. e | By clustering analysis of the data shown in part d, four distinct populations of cells were identified, exhibiting different activity patterns on MK-801 administration. Localization of each cluster is shown in coronal sections, revealing an inhomogeneous cellular population in the lower and upper dentate gyrus. Parts b–e were adapted from REF., Springer Nature Limited.
Fig. 3 |
Fig. 3 |. The SHIELD–MAP and AAV-based labelling system.
SHIELD (system-wide control of interaction time and kinetics of chemicals) combined with MAP (magnified analysis of proteome) allows integrated circuit mapping at single-cell resolution. a | The SHIELD–MAP pipeline. SHIELD allows fully integrated multiscale imaging of fluorescent protein-labelled circuits, mRNAs and proteins within the same mouse brain by simultaneously protecting the molecular and structural information within cleared tissues. b | The image shows a 3D rendering of fluorescent protein-labelled neuronal circuitry of parvalbumin (PV)-positive neurons in the globus pallidus externa (GPe) with an overlaid axon trace of a single labelled neuron. The inset shows example images from multi round staining and multiscale imaging. Scale bar 50 μm for the insets. c | Reconstructed axon arborization of the neuron and its downstream targets. Each circle represents a neuron. The number of putative axosomatic boutons is marked inside each circle. The colour of each circle provides molecular details for each neuron. d | Reconstructed putative axosomatic connectivity for ‘cell D’ (the cell highlighted in orange in part c). Ramified axons (grey) and enhanced green fluorescent protein (eCFP)-positive presynaptic boutons (blue) are segmented. Scale bars 20 μm. e | Viral-assisted spectral tracing (VAST) can be used to label and visualize the 3D morphology and connectivity of cells in thick, cleared tissue blocks. Here, the schematic shows the two-component VAST labelling system,,. A high dose of a three-vector cocktail (individually expressing a red, green or blue fluorescent protein) is coadministered along with a variable dose of an inducer vector that is required to turn on expression of the three proteins. To label specific cell populations, the expression of the fluorescent proteins can also be made Cre dependent. f | Projection image of the olfactory bulb where mitral cells are labelled by VAST (left). Sparse labelling of these cells allows tracing of their dendritic arbors (middle). An overlay of the traces and the projection image is shown in right-hand image. AAV, adeno-associated virus; CR, calretinin; FISH, fluorescence in situ hybridization; hSyn1, human synapsin 1 gene promoter; IHC, immunohistochemistry; GPi, globus pallidus interna; nRT, nucleus reticularis thalami; SNr, substantia nigra pars reticulata; STN,subthalamic nucleus; WPRE, Woodchuck hepatitis post-transcriptional regulatory element. Parts ad are adapted from REF., Springer Nature Limited. Parts e and f are adapted from REF., Springer Nature Limited.
Fig. 4 |
Fig. 4 |. Towards a 3D developmental human cell atlas.
Solvent-based tissue clearing is particularly suitable for the analysis of human embryos as it allows visualization and mapping of immunolabelled cells in large and intact specimens. This provides unprecedented views of developing organs and human cells. a–d | Peripheral nerves (part a), Müllerian and Wolffian ducts and kidney in the urogenital system (part b), muscles in the back, arm and head (part c) and the vasculature in the hand (part d) of a human embryo at 8 weeks of gestation. e,f | The three sensory nerves of the hand (part e) and lung epithelial tubules (part f) in a fetus at 9.5 weeks of gestation. Parts a,b,d–f are adapted with permission from REF., Elsevier. Part c is adapted with permission from REF, Company of Biologists doi:10.1242/dev.180349.
Fig. 5 |
Fig. 5 |. Resolution and speed of custom and commercial light-sheet microscopes.
a | Lateral versus axial system resolution of custom,,– (red) and commercial, (green) light-sheet microscopes and state-of-the-art two-photon microscopes (blue). System resolution values representthe optical configurations and light-sheet properties reported in each study for the demonstration experiments shown in part b. The guantification disregards spatial sampling limitations inherent to the choice of detector. Resolution values are provided as the full width at half maximum (FWHM) size of the system point spread function. Lattice light-sheet (LLS) microscopy uses two different acquisition modes (dithered light sheet versus structured illumination (SI)), which affect the speed and resolution. b | Sampling-limited 3D resolution versus volume throughput for commercial light-sheet microscopes (green) and imaging experiments performed with custom light-sheet (black) and two-photon (blue) microscopes. 3D resolution is defined as dlat2dax, where dlat is the sampling-limited lateral FWHM size and dlat is the sampling-limited axial FWHM size of the point spread function. Lateral sampling can be adjusted by changing the magnification of the detection system, which typically affects both volume throughput and effective resolution (for examples, see ×1.26 versus ×12.6 magnification settings for the LaVision BioTec ultramicroscope or ×16 versus ×32 magnification settings for IsoView). Data points for custom light-sheet and two-photon microscopy refer to imaging of hippocampal dendrites, Caenorhabditis elegans development, cellular dynamics, zebrafish nervous system and mouse brains. Data points for commercial microscopes reflect the technical specifications provided by the manufacturer,. All techniques included in the plot have been successfully applied to the imaging of cleared tissues. c | Working distance of the detection systems for the methods shown in parts a and b. The design by Economo et al. does not require long-working-distance optics for imaging mouse brains since their microscope is integrated with a tissue vibratome. Chhetri et al. surrounded the specimen with four identical objectives for illumination and fluorescence detection, which allows an increase in the bidirectional working distance by a factor of 2 (compared with the native working distance of a single objective) in the special case of imaging transparent, cleared tissues. The maximum supported specimen size can in principle also be doubled in other light-sheet techniques at the expense of temporal resolution by rotating the specimen by 180° and acquiring volumetric data from this opposite view. Tomer et al. proposed using the majority of the detection objective’s working distance to introduce a block of high-refractive-index material in the detection path. The effective working distance (distance between the block and the in-focus region of the specimen) is thus typically not identical to the native working distance of the objective. For this reason, the latter technique is not included in this plot.

References

    1. Spalteholz W Über das Durchsichtigmachen von Menschlichen und Tierischen Präparaten. (S. Hirzel, 1914).
    1. Chung K et al. Structural and molecular interrogation of intact biological systems. Nature 497, 332–337 (2013). - PMC - PubMed
    2. This article is the first to demonstrate in situ synthesis of a hydrogel and its fusion with tissue via covalent bonds to form a cleared tissue–hydrogel hybrid.

    1. Yang B et al. Single-cell phenotyping within transparent intact tissue through whole-body clearing. Cell 158, 945–958 (2014). - PMC - PubMed
    2. This article first reports clearing of adult rodents via the vasculature; RNA detection in cleared tissues with single-molecule resolution by single-molecule fluorescence in situ hybridization and that specific formulations of tissue–hydrogel hybrids can significantly expand.

    1. Renier N et al. iDISCO: a simple, rapid method to immunolabel large tissue samples for volume imaging. Cell 159, 896–910 (2014. - PubMed
    1. Susaki EA et al. Whole-brain imaging with single-cell resolution using chemical cocktails and computational analysis. Cell 157, 726–739 (2014. - PubMed
    2. This article first reports on the delipidation activity of amino alcohols and the high-performance hydrophilic tissue-clearing method CUBIC and reports tissue clearing of the marmoset brain.

Publication types