. 2020 Jan 2;11(1):68.
doi: 10.1038/s41467-019-13867-y.

Genome-scale reconstructions of the mammalian secretory pathway predict metabolic costs and limitations of protein secretion

Affiliations

Genome-scale reconstructions of the mammalian secretory pathway predict metabolic costs and limitations of protein secretion

Jahir M Gutierrez et al. Nat Commun. .

Abstract

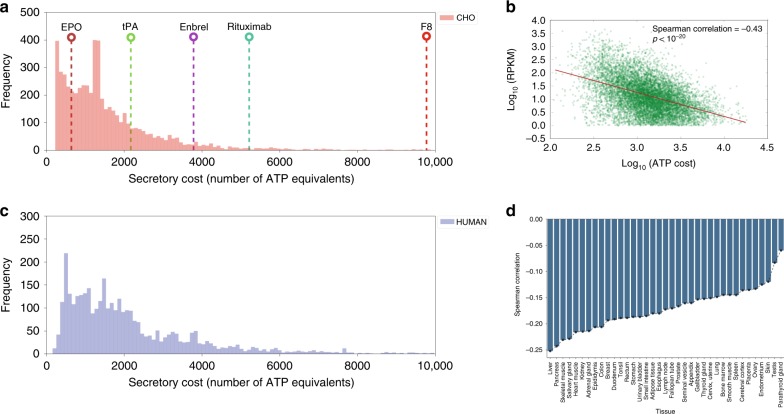
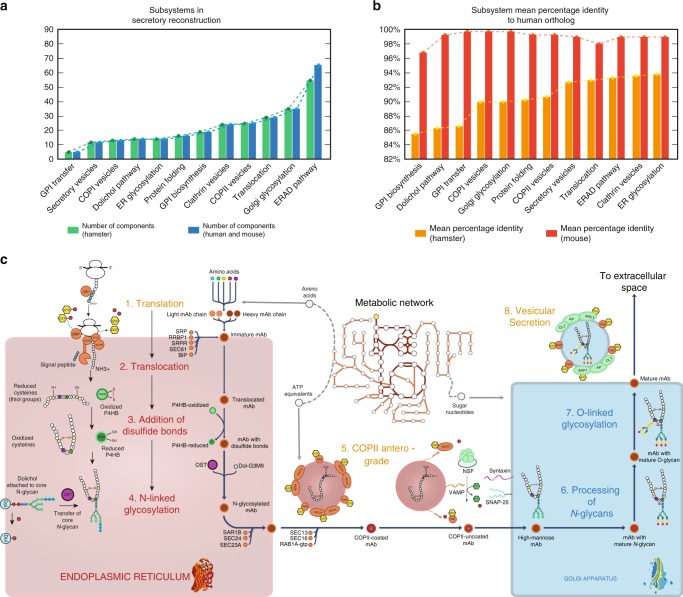
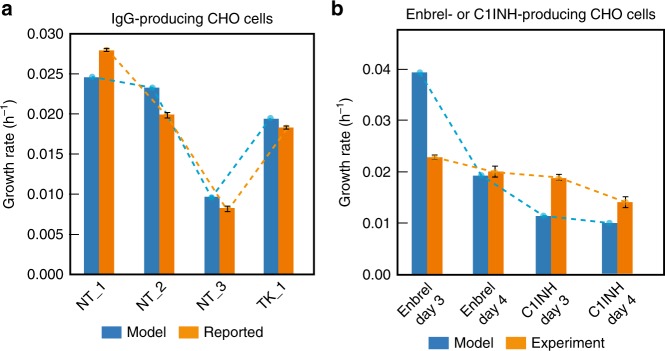
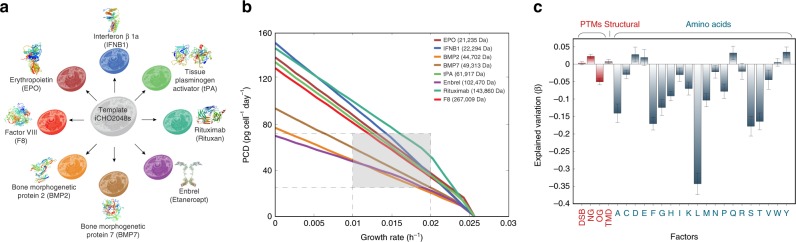
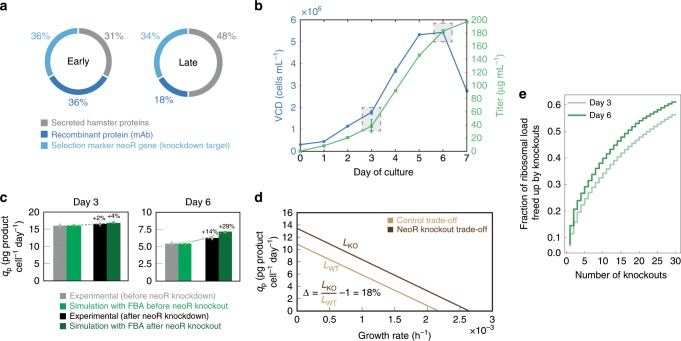
In mammalian cells, >25% of synthesized proteins are exported through the secretory pathway. The pathway complexity, however, obfuscates its impact on the secretion of different proteins. Unraveling its impact on diverse proteins is particularly important for biopharmaceutical production. Here we delineate the core secretory pathway functions and integrate them with genome-scale metabolic reconstructions of human, mouse, and Chinese hamster ovary cells. The resulting reconstructions enable the computation of energetic costs and machinery demands of each secreted protein. By integrating additional omics data, we find that highly secretory cells have adapted to reduce expression and secretion of other expensive host cell proteins. Furthermore, we predict metabolic costs and maximum productivities of biotherapeutic proteins and identify protein features that most significantly impact protein secretion. Finally, the model successfully predicts the increase in secretion of a monoclonal antibody after silencing a highly expressed selection marker. This work represents a knowledgebase of the mammalian secretory pathway that serves as a novel tool for systems biotechnology.


Conflict of interest statement

The authors declare no competing interests.

Figures

Fig. 1
Fig. 1. Mammalian secretory cells preferentially suppress more expensive proteins.
The bioenergetic cost of each secreted CHO (a) and human (c) protein was computed. The bioenergetic costs of five representative biotherapeutics produced in CHO cells are shown for comparison purposes (see Table 1). b Scatter plot and Spearman correlation of gene expression measured by ribosomal profiling and protein cost (in number of ATP per protein) in CHO cells from Kallehauge et al. during the early exponential growth phase of culture. d Spearman correlations between ATP cost and gene expression levels (measured by RNA-Seq) across human tissues,,. Gene transcription levels from the Human Protein Atlas were analyzed against the ATP cost of producing the translated proteins. All p-values associated with each correlation are < 1 × 10-20. Highly secretory tissues show the strongest negative correlation of secreted protein cost vs. mRNA expression levels. RPKM = reads per kilobase of transcript per million. Source data are provided as a Source Data file.
Fig. 2
Fig. 2. Components in the reconstruction of the secretory pathway in mammalian cells.
a The reconstruction comprises 261 proteins in CHO cells and 271 proteins in human and mouse that are distributed across 12 subsystems. The different component numbers arise from the fact that the Chinese hamster proteome annotation only contains one alpha and one beta proteasome subunits, whereas the human and mouse contain 12 subunits of different subtypes. b High similarities were seen for proteins in CHO and human, with a high-mean percentage identity in each subsystem (calculated with the sequence alignment tool BLAST). c Simplified schematic of reactions and subsystems involved in the secretion of a monoclonal antibody (mAb). A total of eight subsystems are necessary to translate, fold, transport, glycosylate, and secrete a mAb. The color of the subsystem names indicates if the reactions occur in the cytoplasm (orange), the ER lumen (red) or the Golgi apparatus (blue). The detailed description of all components can be found in Supplementary Data 1. GPI glycosylphosphatidylinositol, ER endoplasmic reticulum, ERAD ER-associated degradation.
Fig. 3
Fig. 3. Recombinant protein-producing models of iCHO2048s predict measured growth rates.
a Growth rates were computed using an IgG-specific iCHO2048s model and compared to experimentally measured growth rates from six datasets from two previous studies using IgG-producing cell lines,. NT and TK specify the initials of the first author of the two studies (Neil Templeton, Thomas Kallehauge). b Additional growth, productivity, and metabolomic data were obtained from Enbrel and C1INH-producing CHO cells, and models were constructed. The model-predicted growth rates during exponential growth phase were consistent with experimental growth rates of Enbrel-producing CHO cells and C1INH-producing CHO cells at almost all time points. In all cases, the iCHO2048s models were constrained to produce the recombinant protein at the measured specific productivity rate. The values used to constrain each of the iCHO2048s models are reported in Supplementary Data 3. Error bars represent the standard deviation of three biological replicates. Source data are provided as a Source Data file.
Fig. 4
Fig. 4. Construction of product-specific iCHO2048s models.
a Eight product-specific iCHO2048s models were constructed for biotherapeutics commonly produced in CHO cells. The protein structures shown were downloaded from the Protein Data Bank (www.rcsb.org) with IDs (in clockwise order starting from the top): 1au1, 5brr, 1hzh, 3alq, 1m4u, 2h64, 4bdv, and 1eer. b Pareto optimality frontiers of growth-productivity trade-off curves were computed for the eight iCHO2048s models using the same constraints and experimental data from Supplementary Data 3. The shaded region corresponds to range of maximum productivity at commonly observed growth rates in CHO cell cultures. The molecular weight (in Daltons) of each biotherapeutic is shown in the legend. c All protein features (PTMs, transmembrane domains, and amino acid compositions) were used to fit a multivariate linear regression to predict specific productivity. The model coefficients (β) quantify their contribution to the explained variation in specific productivity. Error bars represent the standard error of the fitted coefficients. Source data are provided as a Source Data file.
Fig. 5
Fig. 5. iCHO2048s recapitulates experimental results of neoR knock-down in silico.
a Ribosome occupancy was measured with ribosomal profiling during early (left) and late (right) exponential growth phases. b Time profiles are shown for viable cell density (VCD) and titer in experimental culture. Shaded boxes indicate the time points corresponding to early (day 3) and late (day 6) growth phases. c Flux balance analysis was used to predict specific productivity (qp) with the iCHO2048s model before and after in silico knockout of the neoR gene. d Growth-productivity trade-offs were predicted by iCHO2048s and demonstrated a potential 18% increase after the neoR in silico knockout. The formula for calculating the trade-off improvement (Δ) is shown in the plot. LWT = length of trade-off curve before knockout, LKO = length of trade-off curve after knockout. e Ribosomal occupancy for all mRNA sequences bearing a signal peptide sequence were analyzed from the Kallehauge et al. study and demonstrated that the top 30 secreted proteins accounted >50% of the ribosomal occupancy of secreted proteins. Error bars represent the standard deviation of three biological replicates. Source data are provided as a Source Data file.

Similar articles

Cited by

References

    1. Uhlen M., Fagerberg L., Hallstrom B. M., Lindskog C., Oksvold P., Mardinoglu A., Sivertsson A., Kampf C., Sjostedt E., Asplund A., Olsson I., Edlund K., Lundberg E., Navani S., Szigyarto C. A.-K., Odeberg J., Djureinovic D., Takanen J. O., Hober S., Alm T., Edqvist P.-H., Berling H., Tegel H., Mulder J., Rockberg J., Nilsson P., Schwenk J. M., Hamsten M., von Feilitzen K., Forsberg M., Persson L., Johansson F., Zwahlen M., von Heijne G., Nielsen J., Ponten F. Tissue-based map of the human proteome. Science. 2015;347(6220):1260419–1260419. doi: 10.1126/science.1260419. - DOI - PubMed
    1. Walsh G. Biopharmaceutical benchmarks 2018. Nat. Biotechnol. 2018;36:1136–1145. doi: 10.1038/nbt.4305. - DOI - PubMed
    1. Feizi A, Österlund T, Petranovic D, Bordel S, Nielsen J. Genome-scale modeling of the protein secretory machinery in yeast. PLoS ONE. 2013;8:e63284. doi: 10.1371/journal.pone.0063284. - DOI - PMC - PubMed
    1. Liu L, Feizi A, Österlund T, Hjort C, Nielsen J. Genome-scale analysis of the high-efficient protein secretion system of Aspergillus oryzae. BMC Syst. Biol. 2014;8:73. doi: 10.1186/1752-0509-8-73. - DOI - PMC - PubMed
    1. Irani ZA, Kerkhoven EJ, Shojaosadati SA, Nielsen J. Genome-scale metabolic model of Pichia pastoris with native and humanized glycosylation of recombinant proteins. Biotechnol. Bioeng. 2016;113:961–969. doi: 10.1002/bit.25863. - DOI - PubMed

Publication types