. 2020 Apr;14(4):881-895.
doi: 10.1038/s41396-019-0580-z. Epub 2020 Jan 2.

Phage-specific metabolic reprogramming of virocells

Affiliations

Phage-specific metabolic reprogramming of virocells

Cristina Howard-Varona et al. ISME J. 2020 Apr.

Abstract

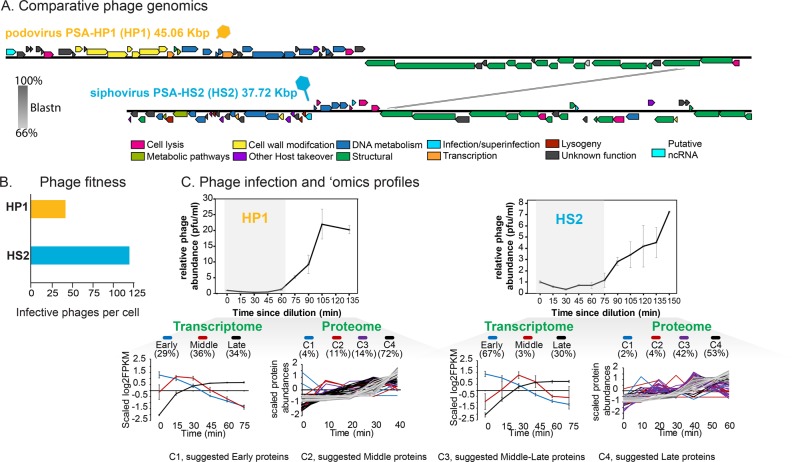
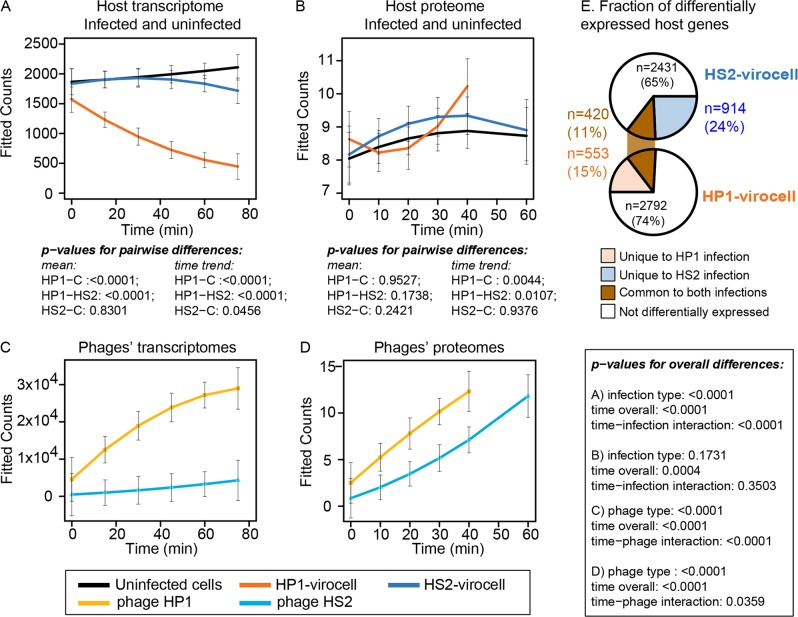
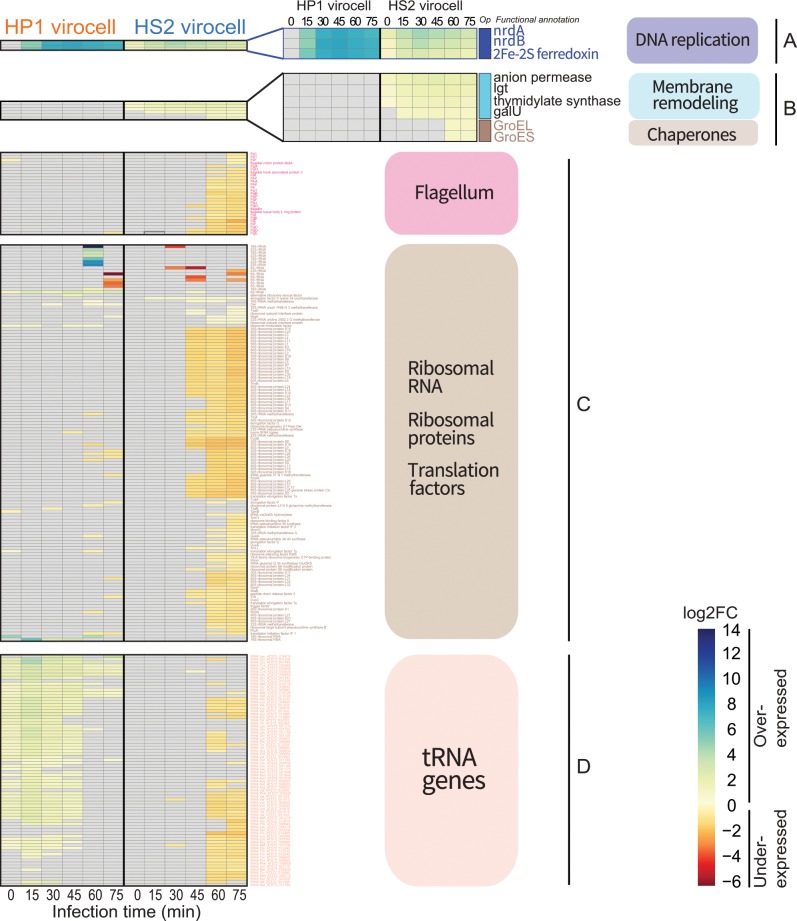
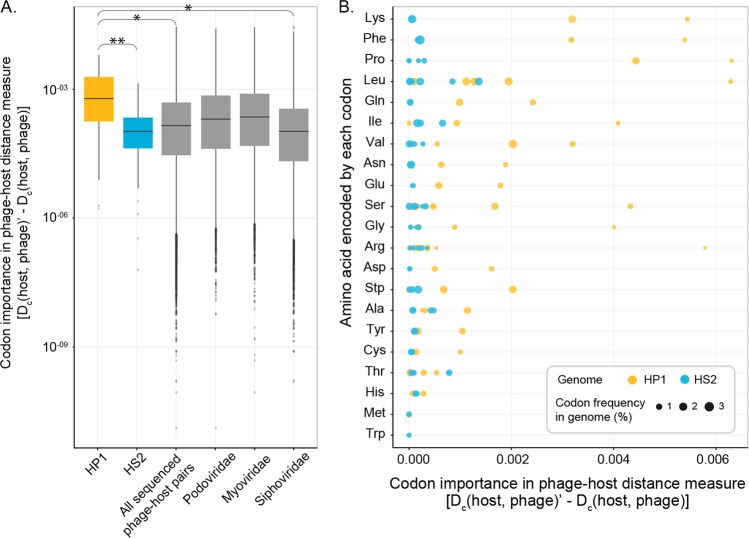
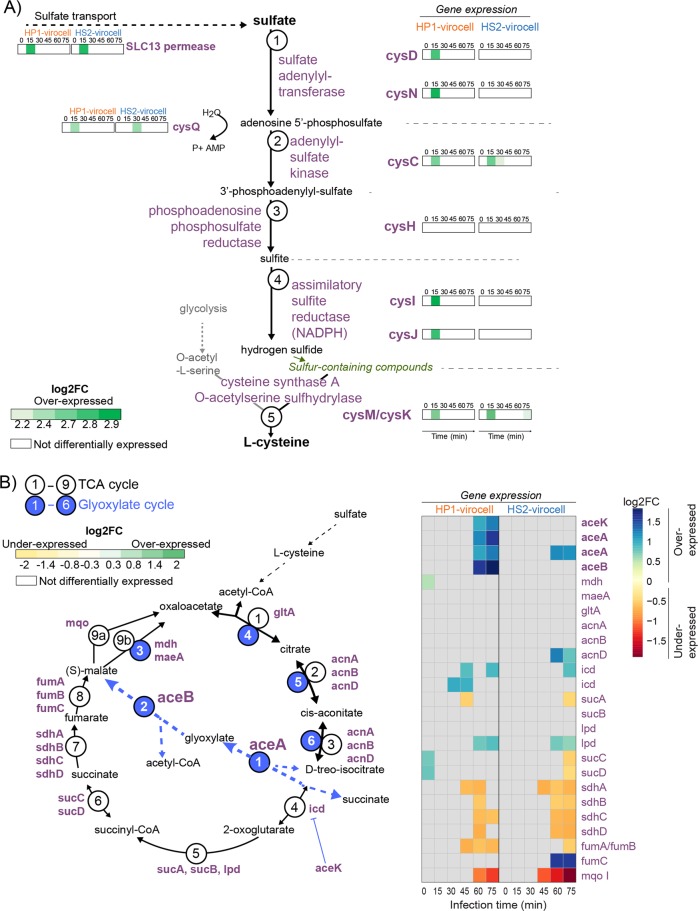
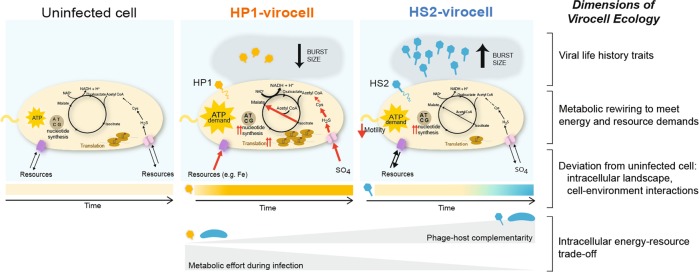
Ocean viruses are abundant and infect 20-40% of surface microbes. Infected cells, termed virocells, are thus a predominant microbial state. Yet, virocells and their ecosystem impacts are understudied, thus precluding their incorporation into ecosystem models. Here we investigated how unrelated bacterial viruses (phages) reprogram one host into contrasting virocells with different potential ecosystem footprints. We independently infected the marine Pseudoalteromonas bacterium with siphovirus PSA-HS2 and podovirus PSA-HP1. Time-resolved multi-omics unveiled drastically different metabolic reprogramming and resource requirements by each virocell, which were related to phage-host genomic complementarity and viral fitness. Namely, HS2 was more complementary to the host in nucleotides and amino acids, and fitter during infection than HP1. Functionally, HS2 virocells hardly differed from uninfected cells, with minimal host metabolism impacts. HS2 virocells repressed energy-consuming metabolisms, including motility and translation. Contrastingly, HP1 virocells substantially differed from uninfected cells. They repressed host transcription, responded to infection continuously, and drastically reprogrammed resource acquisition, central carbon and energy metabolisms. Ecologically, this work suggests that one cell, infected versus uninfected, can have immensely different metabolisms that affect the ecosystem differently. Finally, we relate phage-host genome complementarity, virocell metabolic reprogramming, and viral fitness in a conceptual model to guide incorporating viruses into ecosystem models.


Conflict of interest statement

The authors declare that they have no conflict of interest.

Figures

Fig. 1
Fig. 1. Podophages PSA-HP1 (HP1) and PSA-HS2 (HS2).
a Blastn-based phage genome comparison. b Phage fitness on Pseudoalteromonas str. 13–15, defined as number of infective phages produced per cell. c Temporal dynamics of phage infection (0 = 15 min after phage addition) to measure latent periods and ‘omics profiles. Transcriptome: average and standard deviation of scaled gene expression classified as early (blue), middle (red), or late (black). Proteome: detected proteins and their scaled abundances, colored following the transcript clusters. Parentheses contain either the fraction of total genes expressed or of proteins detected. Pfu particle forming units.
Fig. 2
Fig. 2. Host global transcriptome and proteome takeover by phage.
a Temporal fitted raw transcript counts for uninfected controls, HP1 infected (HP1 virocell), and HS2-infected (HS2 virocell) cells. b Temporal fitted protein counts for uninfected controls, HP1 virocells, and HS2 virocells. Temporal fitted raw transcript (c) or protein (d) HP1 and HS2 counts. For all, p values indicate confidence from the ANOVA analysis of a linear model predicting the counts with sample type (uninfected, HP1 infected, or HS2-infected cells), a linear and quadratic function of time, interaction between infection type and time, and the between-sample pairwise comparisons. The error bars indicate 95% Bonferroni-corrected simultaneous confidence intervals for the fitted response. All pairwise comparisons are multiple-comparison corrected using Tukey’s method. Time (min) = 0 indicates 15 min after diluting the infection. e Host genes differentially expressed with and without each phage.
Fig. 3
Fig. 3. Host genes differentially expressed in both virocells.
Heatmap representing select host genes’ fold change (log2FC) expression in infected vs uninfected, separated into categories: a The operon (“op”) containing the genes nrdA, nrdB and ferredoxin is the highest expressed group in both virocells. b The operon containing 5 genes mainly involved in cellular transport that comprises the group of most under-expressed genes in both virocells. c An operon with putative membrane remodeling genes and the chaperones GroEL/ES is the highest expressed group in the HS2 virocells. d Underexpression of both flagellar synthesis and assembly and protein translation genes (including ribosomal RNA, ribosomal proteins and translation factors) in the HS2 virocells. e Overexpression of tRNA genes in the HP1 virocells, which are under-expressed in the HS2 virocells.
Fig. 4
Fig. 4. Dissimilarity between phage and host codons and amino acids.
a Distribution of all codon importance measures for phage–host distances. Datasets include: HP1 or HS2 against Pseudoalteromonas str. 13–15, all sequenced phage–host pairs in RefSeq (n = 1187), and either the myoviridae (n = 229), podoviridae (n = 166), or siphoviridae (n = 671) phage–host pair subset. Greater values represent codons causing greater distances between phage and host codon frequency vectors. Box represents the interquartile range (IQR) with the middle line as the median. Whiskers extend to 1.5*IQR and dots are outlier values beyond that. Pairwise comparisons between all x-variables are significant (pairwise Wilcoxon test, p value < 0.05; Tables S4 and S5). Asterisks denote the HP1 significant comparisons described. b Each point represents the codon importance in the HP1 host and HS2-host similarity measures (x-axis, as in a). Synonymous codons are aggregated by the encoded amino acids (y-axis). The point size denotes phage genome codon frequency.
Fig. 5
Fig. 5. Phage-specific energy metabolism rewiring in virocells.
a Sulfate intracellular transport and reduction to hydrogen sulfide, for cysteine production. Enzyme gene expression is shown as log2-fold change (log2FC; comparing infected vs uninfected). b The TCA cycle (black) with its glyoxylate bypass (blue), for the presumed consumption of cysteine. Each enzyme and its expression (log2FC in infected vs uninfected cells) is shown on the heatmap. For both, protein dynamics are represented in Fig. S7. For all expression, absence of virocell differential expression has white/gray background.
Fig. 6
Fig. 6. The dimensions of virocell ecology.
Viral life history traits, e.g., burst size, adsorption and infection efficiency, latent period, impact viral fitness. The multi-omics analyses here have enabled the identification of mechanisms underlying these fitness-defining traits. During infection, the virocell undergoes metabolic rewiring to meet energy and resource demands. The greater metabolic effort during infection incurred by the HP1 virocell was evidenced by (i) an immediate, sustained, and more drastic deviation from uninfected cell, as seen in host transcription and protein levels; (ii) fast phage transcription and high accumulation of phage proteins; and (iii) rewiring host central carbon and energy metabolisms to meet the cost of creating more transcripts and proteins. In contrast, little work was invested by the HS2 virocell until past the midpoint of infection. This intracellular impact determines the degree to which the virocell deviates from the uninfected cell through time and, consequently, the environmental footprint of the virocell. We propose that a major determinant of the intracellular battle waged during infection is the phage–host complementarity of biomolecules (nucleotides, amino acids), which underlies an intracellular energy-resource trade-off. Namely, the phage with the highest degree of host complementarity (here, HS2) is able to access and utilize the available resources with minimal energetic effort, while minimizing the intracellular impact on the host and maximizing its fitness.

Similar articles

Cited by

References

    1. Falkowski PG, Fenchel T, Delong EF. The microbial engines that drive earth’s biogeochemical cycles. Science. 2008;320:1034–9. doi: 10.1126/science.1153213. - DOI - PubMed
    1. Wommack KE, Colwell RR. Virioplankton: viruses in aquatic ecosystems. Microbiol Mol Biol Rev. 2000;64:69–114. doi: 10.1128/MMBR.64.1.69-114.2000. - DOI - PMC - PubMed
    1. Breitbart M, Bonnain C, Malki K, Sawaya NA. Phage puppet masters of the marine microbial realm. Nat Microbiol. 2018;3:754–66. doi: 10.1038/s41564-018-0166-y. - DOI - PubMed
    1. Zimmerman AE, Howard-Varona C, Needham DM, John SG, Worden AZ, Sullivan MB, et al. Metabolic and biogeochemical consequences of viral infection in aquatic ecosystems. Nat Rev Microbiol. 2020;18:21–34. - PubMed
    1. Forterre P. Manipulation of cellular syntheses and the nature of viruses: the virocell concept. Comptes Rendus Chim. 2011;14:392–9. doi: 10.1016/j.crci.2010.06.007. - DOI

Publication types