. 2020 Mar;124(3):410-422.
doi: 10.1038/s41437-019-0292-1. Epub 2020 Jan 2.

European minnows through time: museum collections aid genetic assessment of species introductions in freshwater fishes (Cyprinidae: Phoxinus species complex)

Affiliations

European minnows through time: museum collections aid genetic assessment of species introductions in freshwater fishes (Cyprinidae: Phoxinus species complex)

Anja Palandačić et al. Heredity (Edinb). 2020 Mar.

Abstract

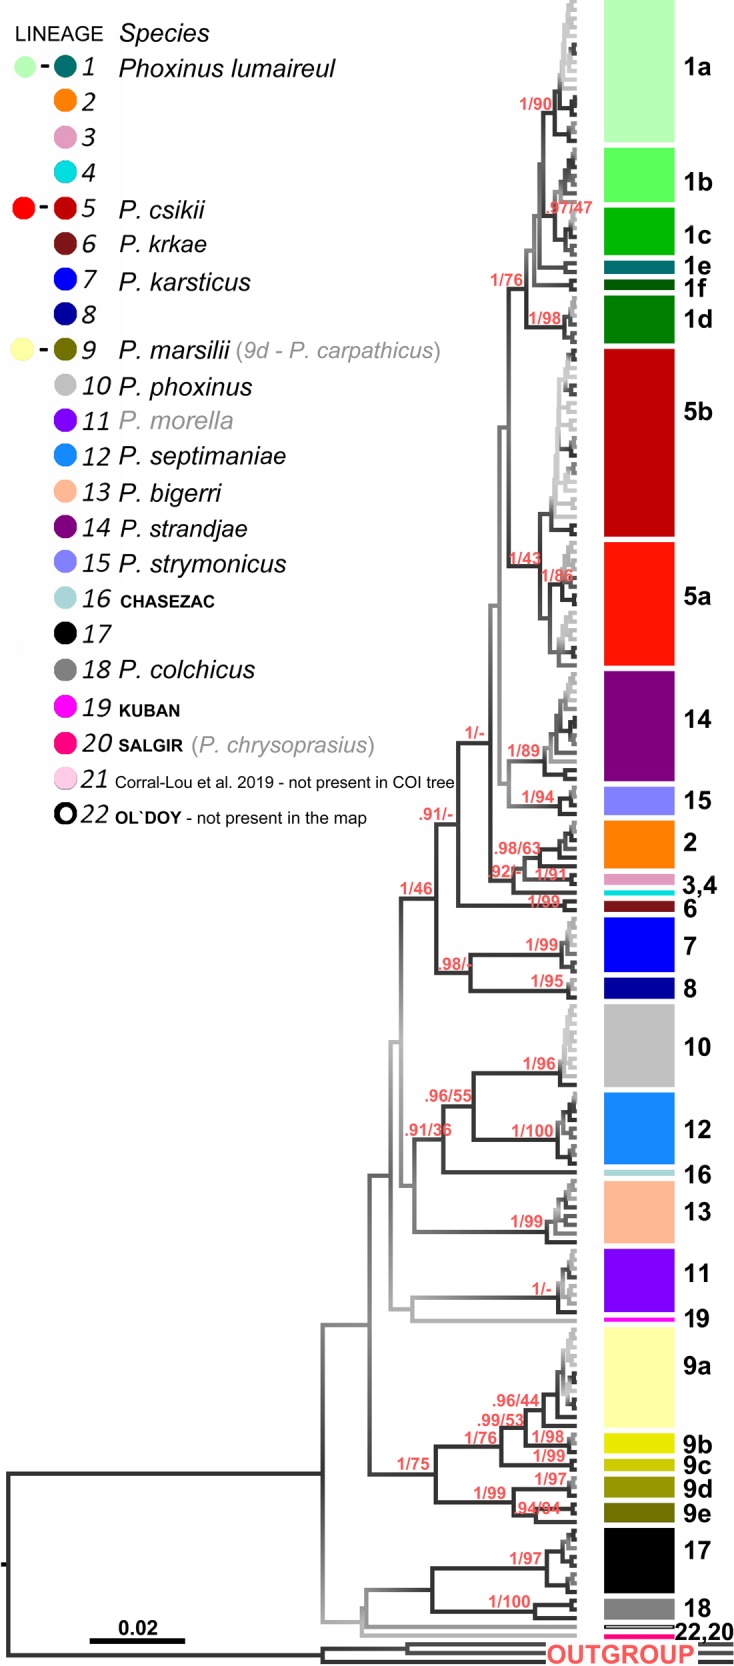
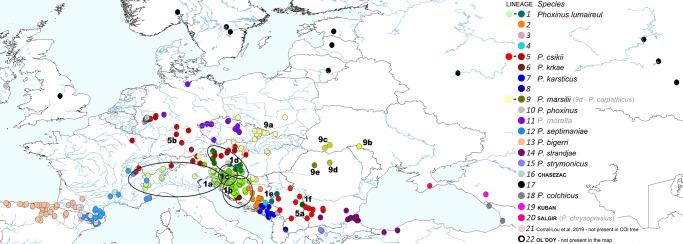
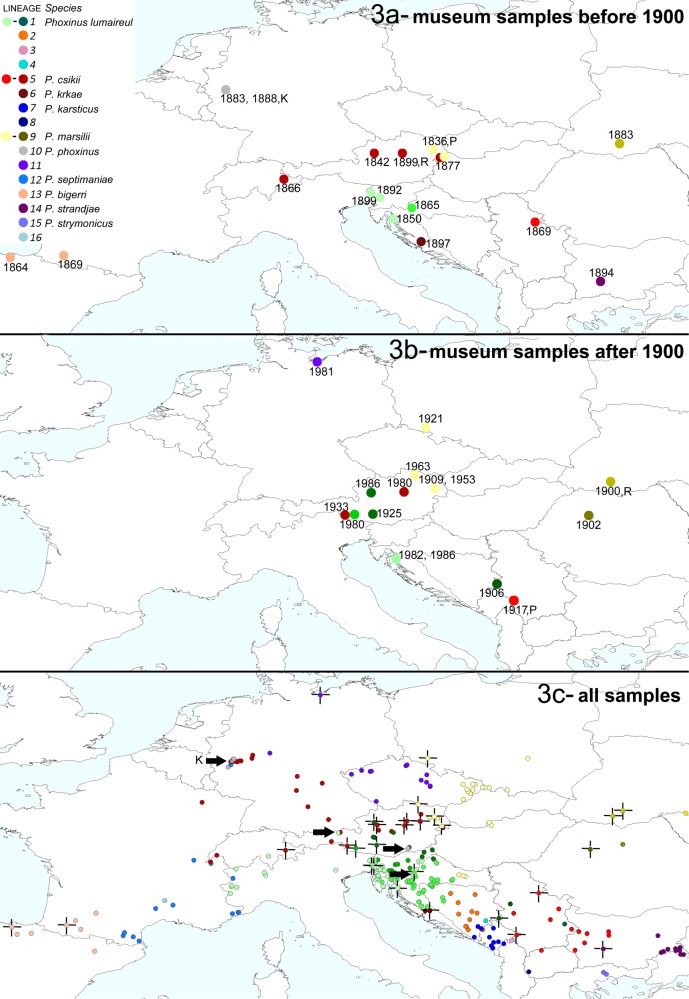
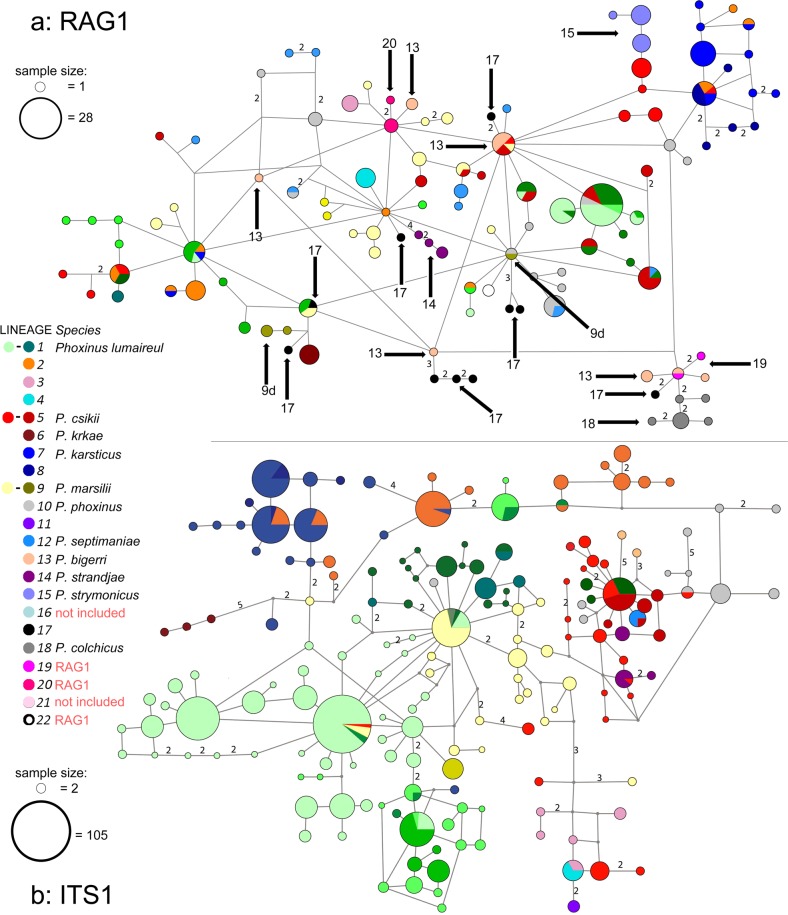
Massive fish introductions have taken place throughout much of the world, mostly over the last 70 years, and present a major threat to the genetic diversity of native fishes. Introductions have been reported for European Phoxinus, a ubiquitous small cyprinid that populates a wide variety of habitats. Species delineation in European Phoxinus has proven difficult with one reason being ranges of distribution that often traverse drainage boundaries. The present study combines recent samples with museum samples to better understand the current distribution of Phoxinus species and their distributions prior to the massive introductions of fishes in Europe, and to evaluate the use of museum specimens for species distribution studies. For these purposes, genetic lineages from sites collected prior to 1900 (n = 14), and between 1900 and 1950 (n = 8), were analysed using two mitochondrial and nuclear markers. Although possible fish introductions were detected, our results show that the distribution of genetic lineages of museum samples is comparable to that of the extant lineages of European Phoxinus present in those areas. These observations suggest that in the studied ranges the distribution of Phoxinus lineages has been driven by natural processes.


Conflict of interest statement

The authors declare that they have no conflict of interest.

Figures

Fig. 1
Fig. 1. Phylogenetic reconstruction of European Phoxinus based on cytochrome oxidase I.
Phylogenetic tree constructed from the barcoding region of COI using Bayesian inference (BI) with BEAST 1.8.0 (Drummond et al. 2012). Branches carry posterior probabilities and bootstrap supports (BS) from the tree constructed with the Maximum-Likelihood (ML) method (PhyML; Guindon et al. 2010). The tree is shaded according to the value of posterior probabilities: the lighter the shade the weaker its support. Only posterior probabilities above 0.9 are shown. A lack of bootstraps originating from the difference between the BI and ML trees is denoted with −. Genetic lineages are presented in the diagram in the upper left corner. The genetic lineages, which are valid species, are written in black and the lineages, for which the species name is available but not valid, are in grey. For the genetic lineages, which were collected at a single sampling site, their locality is given. The outgroup consist of Rhynchocypris lagowskii (AP009147), Tribolodon hakonensis (AB626855) and Oreoleuciscus potanini (AB626851).
Fig. 2
Fig. 2. Current distribution of European Phoxinus genetic lineages based on COI and cytb.
All studies are included. For clarity, subclades are annotated with letters, 1a–f, 5a–b, and 9a–e and black circles represent the approximate currently known distribution of subclades 1a–d. Major river drainages are shown.
Fig. 3
Fig. 3. A comparison of recent and museum material for European Phoxinus.
This presents a closer view of Fig. 2, showing only the part of Europe for which the museum material is available. Genetic lineages were determined based on the mitochondrial genes COI and cytb. Lineages and attributed (currently valid) species are presented in the legend. Year of collection is noted beside each sampling site. Previous studies: K, Knebelsberger et al. ; P, Palandačić et al. ; R, Ramler et al. . a Museum samples collected prior to 1900. b Museum samples collected after 1900. c All samples; museum samples denoted with a crosshair; arrows denote sample sites where fish introductions are identified.
Fig. 4
Fig. 4. Haplotype networks constructed with nuclear DNA.
a Haplotype network constructed with RAG1. Colours represent lineages detected by mtDNA analysis, and are shown in the legend. The gametic phase of heterozygous individuals was determined using Phase 2.1 (Stephens et al. , Stephens and Scheet 2005). An unrooted minimum-spanning network was constructed with the median-joining algorithm (Bandelt et al. 1999) implemented in Network 5.1 (www.fluxus-engineering.com) with default settings. The lines carry the number of mutations where more than one. Circle size corresponds to haplotype frequency, with the biggest encompassing 28 samples. Arrows denote the lineages first presented by RAG1. b ITS1 haplotype network constructed using homozygotes, simple heterozygotes resolved by Phase 2.1 (Stephens et al. , Stephens and Scheet 2005), and cloned samples. Lines carry the number of mutations when more than one. Circle size corresponds to haplotype frequency, with the biggest encompassing 105 samples. However, sampling was not distributed equally among the lineages, cloning revealed more than two haplotypes per sample and did not have the same success rate in all the lineages, while allele dropout might be present in museum samples. Thus, the size of the circles do not project a realistic picture of haplotype frequencies.

References

    1. Ahnelt H. Translocations of tropical and subtropical marine fish species into the Mediterranean. A case study based on Siganus virgatus (Teleostei: Siganidae) Biologia. 2016;71:952–959. doi: 10.1515/biolog-2016-0106. - DOI
    1. Alfaro JWL, Boubli JP, Olson LE, Di Fiore AD, Wilson B, Gutierrez-Espeleta GA, et al. Explosive Pleistocene range expansion leads to widespread Amazonian sympatry between robust and gracile capuchin monkeys. J Biogeogr. 2012;39:272–288. doi: 10.1111/j.1365-2699.2011.02609.x. - DOI
    1. Aparicio E, Vargas MJ, Olmo JM, de Sostoa A. Decline of native freshwater fishes in a Mediterranean watershed on the Iberian Peninsula: a quantitative assessment. Environ Biol Fish. 2000;59(1):11–19. doi: 10.1023/A:1007618517557. - DOI
    1. Arnheim N (1983) Concerted evolution in multigene families. In: Nei M, Koehn R (eds) Evolution of genes and proteins. Sinauer, Sunderland, MA, p 38–61
    1. Bailey CD, Carr TG, Harris SA, Hughes CE. Characterization of angiosperm nrDNA polymorphism, paralogy, and pseudogenes. Mol Phylogenet Evol. 2003;29:435–455. doi: 10.1016/j.ympev.2003.08.021. - DOI - PubMed

Publication types

Substances